. 2021 Jul 6;12(1):4164.
doi: 10.1038/s41467-021-24442-9.

Oncogenic cooperation between TCF7-SPI1 and NRAS(G12D) requires β-catenin activity to drive T-cell acute lymphoblastic leukemia

Affiliations

Oncogenic cooperation between TCF7-SPI1 and NRAS(G12D) requires β-catenin activity to drive T-cell acute lymphoblastic leukemia

Quentin Van Thillo et al. Nat Commun. .

Abstract

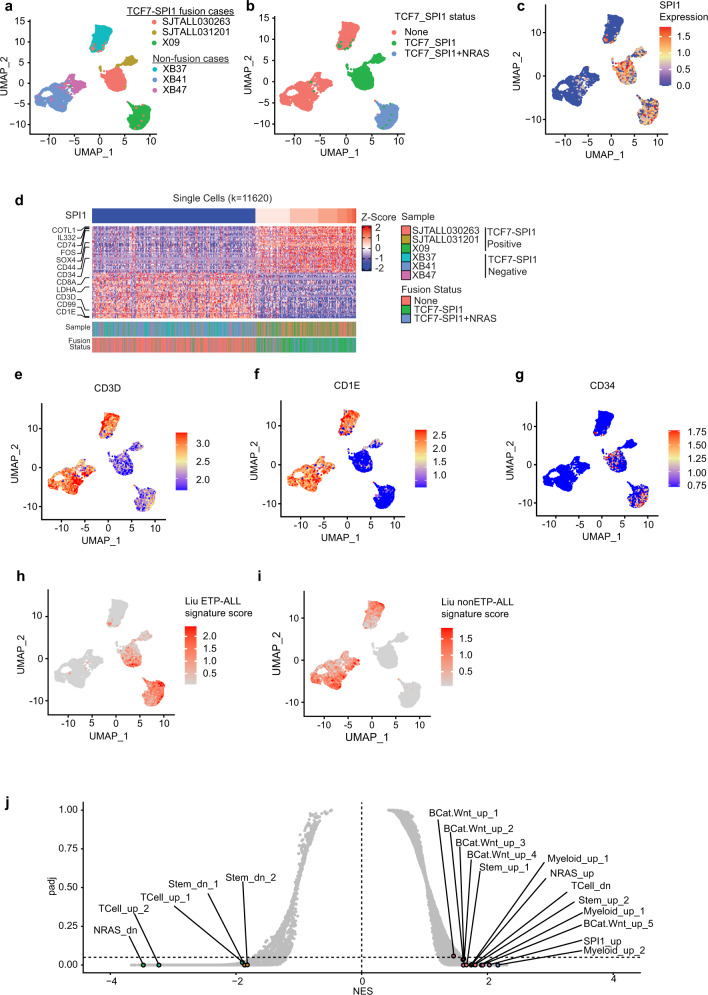
Spi-1 Proto-Oncogene (SPI1) fusion genes are recurrently found in T-cell acute lymphoblastic leukemia (T-ALL) cases but are insufficient to drive leukemogenesis. Here we show that SPI1 fusions in combination with activating NRAS mutations drive an immature T-ALL in vivo using a conditional bone marrow transplant mouse model. Addition of the oncogenic fusion to the NRAS mutation also results in a higher leukemic stem cell frequency. Mechanistically, genetic deletion of the β-catenin binding domain within Transcription factor 7 (TCF7)-SPI1 or use of a TCF/β-catenin interaction antagonist abolishes the oncogenic activity of the fusion. Targeting the TCF7-SPI1 fusion in vivo with a doxycycline-inducible knockdown results in increased differentiation. Moreover, both pharmacological and genetic inhibition lead to down-regulation of SPI1 targets. Together, our results reveal an example where TCF7-SPI1 leukemia is vulnerable to pharmacological targeting of the TCF/β-catenin interaction.


Conflict of interest statement

The authors declare no competing interests.

Figures

Fig. 1
Fig. 1. Identification and characterization of the TCF7-SPI1 fusion in patient X09 with T-cell acute lymphoblastic leukemia.
a Left panel: flow cytometry staining of the X09 patient sample for cyCD3, CD1a, CD4, CD8, CD117, CD2, CD7, HLA-DR. Right panel: Circos plot showing the translocation between chromosomes 5 and 11 in the X09 patient. Additional mutations are shown with their respective chromosomal location. b Scheme of the t(5;11) translocation between TCF7 and SPI1. The breakpoints are located at TCF7 intron 4-5 (Chr. 5) and SPI1 intron 2–3 (Chr. 11). c Long read nanopore sequencing confirming the translocation with the resulting GridION reads shown schematically alongside Sanger sequencing confirmation of the breakpoint region. d Schematic representation of the resulting TCF1-PU.1 (TCF7-SPI1) fusion protein. The different domains are shown. CTNNB1: β-catenin binding domain; TAD: trans-activating domain; HMG: high mobility group box.
Fig. 2
Fig. 2. Single-cell RNA sequencing identifies that high SPI1 expression is associated with NRAS, stem cell, and Wnt/β-catenin signaling cell signatures.
ac UMAP plot of 11,620 malignant T-cells from 6 T-ALL samples with cells colored by their patient of origin (a), TCF7-SPI1 and TCF7-SPI1 + NRAS mutation status (b), level of SPI1 expression (c), the scalebar represents normalized expression values. d Heat map for all single cells across 6 T-ALL patients highlighting top 25 and bottom 25 genes correlated with SPI1 expression. eg UMAP plot for expression levels of CD3D (e) CD1E (f) and, CD34 (g) highlighting differential expression between fusion-positive and fusion-negative T-ALL cases. h, i UMAP plot of cells colored by the average expression of the ETP-ALL (h) or nonETP-ALL (i) signature derived from Liu et al., the scalebar represents averaged and scaled gene signature expression values. j Associated GSEA analysis pathways associated with SPI1 expression highlighting enrichment of stem, Wnt/β-catenin, and myeloid signature. Full annotation and associated statistic of each pathway provided in Supplementary Data 8.
Fig. 3
Fig. 3. The presence of the NRAS(G12D) mutation is necessary for in vitro transformation to cytokine-independent growth.
a Constitutive retroviral vectors with either BFP-P2A-TCF7SPI1, BFP-P2A-NRAS(G12D) or TCF7-SPI1-P2A-NRAS(G12D) followed by an IRES-sequence and GFP. b Schematic representation of the inducible Cre-Lox system. The same constructs as in (a) were cloned in the antisense direction between 2 anti-parallel asymmetric Lox66/Lox71 sites. Upon expression of Cre-recombinase the sequence is flipped in a unidirectional manner. c, d Western blot analysis showing expression of TCF7, SPI1, and NRAS for the different indicated constructs in Ba/F3 cells (c) (n = 1) or Cre-Ba/F3 cells with active Cre-recombinase (d) (n = 1). WT = Wild-type Ba/F3 and used as a control lysate. The viral P2A sequences within the expression vector results in a 3′ in-frame 18 amino acid sequence tail on the first protein expressed accounting for the increased molecular weight for NRAS(G12D) and TCF7-SPI1 in (c) and (d), respectively. e Growth curve of Ba/F3 cells transduced with the vectors illustrated in (a) or empty vector (white). f Growth curve with floxed constructs illustrated in (b) in Ba/F3-Cre cells alongside an empty vector control. gj Growth curves in pro-T cells after transduction with the indicated constructs and empty vector. Either no growth factors (g), Scf (h), Il7 (i) or Dll4 (j) were omitted. ej The number of cells is shown as a mean with standard deviation, n = 3 independent experiments for each condition.
Fig. 4
Fig. 4. Conditional co-expression of TCF7-SPI1 fusion and NRAS(G12D) within developing T cells cooperate to generate an immature T-cell acute lymphoblastic leukemia.
a Schematic representation of the conditional bone marrow transplant (BMT) model. b Survival curve showing the disease-free survival with no significant difference in disease latency between NRAS only and TCF7-SPI1-P2A-NRAS (p = 0.7429). Secondary transplantations (dashed lines) have significantly shorter disease latencies (p = 0.0008 for NRAS only; p = <0.0001 for TCF7-SPI1-P2A-NRAS). Log-rank (Mantel–Cox) test. c White blood cell (WBC), spleen weight and thymus weight at end stage for the primary BMT. n = 4 biologically independent animals for TCF7-SPI1, 8 for NRAS only (for the WBC graph n = 9) and n = 9 biologically independent animals for TCF7-SPI1 + NRAS in the three graphs. d Equivalent WBC, spleen, and thymus data for secondary transplantation. c, d Each point represents a different mouse, n = 5 biologically independent animals for NRAS only and 6 for TCF7-SPI1 + NRAS; the mean is shown with standard deviation. P values are indicated and were calculated by a one-way ANOVA with post hoc Dunnett T3 multiple comparisons test for (c) and a two-tailed Mann–Whitney test for (d). e Immunophenotyping of two different mice from (b) for each condition with spleen or thymus cells. Flow cytometry for cyCD3, CD4, CD8, CD117 are shown after gating on the viable and GFP+ cells. Distinguishing markers between the two conditions and their respective percentages are highlighted in red.
Fig. 5
Fig. 5. The N-terminal β-catenin binding site of the TCF1-PU.1 fusion protein is essential for transcriptional activity and ETP-ALL development in vivo.
a Schematic representation of the protein domains resulting from the entire TCF7-SPI1 fusion gene (above) or without (below) the β-catenin binding domain (CTNNB1) at the N-terminus (first 55 amino acids). b Kaplan–Meier curve for disease-free survival with the indicated inducible constructs. Log-rank (Mantel–Cox) test, p = 0.0589. c Spleen and thymus weights at end stage for mice in (b). Dots represent different mice (n = 6 biologically independent animals for ΔβCat-TCF7-SPI1 and 5 for TCF7-SPI1); the mean is shown with standard deviation. P values are indicated and were calculated by a two-tailed Mann–Whitney test. d Flow cytometry staining of a thymus sample of a ΔβCat-TCF7-SPI1-P2A-NRAS(G12D) mouse. Staining for CD4 and CD8 is shown after gating on GFP-positive cells. eg Dual luciferase assay as described in “Methods”. e HEK293T cells with GAL4 constructs. Overnight treatment with CHIR-99021 at a dose of 1 μM. f Mel888 cells with GAL4 constructs. g Mel888 cells with SPI1 reporter gene containing the LB1 promotor or mutant. Results were normalized to the average GAL4 signal. P values (eg) are indicated, one-way ANOVA with post hoc Dunnett T3 multiple comparisons test. Mean with standard deviation is shown. Dots represent different samples, n = 3 independent experiments per condition. Repeat experiments of (e) and (f) are shown in Supplementary Fig. 5.
Fig. 6
Fig. 6. Genetic and small molecule antagonism of the TCF7-SPI1 fusion results in leukemia phenotype differentiation.
a Schematic representation of the shRNAmir in the LT3GECIR vector. b Schematic representation of the in vivo inducible knockdown mouse model. Mice received doxycycline or normal chow. c FACS plots for a shREN_713 (above) and a shSPI_885 mouse (below). Staining for CD4-PE (left) and CD8-BV421 (right) is shown after gating on GFP and mCHERRY positive cells from peripheral blood, shREN_713 is represented in white and shSPI_885 in purple. d Mean fluorescence intensity (MFI) of CD4, CD8, cKIT, and CD2 GFP+/mCHERRY+ peripheral blood is shown in mice with shREN_713 (n = 8) or shSPI_885 (n = 8). Dots represent different mice. P values are indicated and were analyzed with a two-tailed unpaired Mann–Whitney test. Mean is shown with standard error of the mean. e RNA-seq gene expression analysis in mice with shSPI1_885 versus shREN_713. GSEA using the Zhang and Liu ETP-ALL signature gene sets. Normalized enrichments scores, p values, and FDR q values are indicated. f iCisTarget motif analysis in mice with shSPI1_885 versus shREN_713 (left) or after 24 h ex vivo treatment with PKF 118-310 versus DMSO (right). Motifs in both down- (above) and upregulated genes (below) were ranked according to their respective normalized enrichment scores. SPI1 motifs are indicated in orange. P values are indicated and were calculated with a hypergeometric distribution. All results can be found in Supplementary Data 15–22.

References

    1. De Keersmaecker, K. et al. Exome sequencing identifies mutation in CNOT3 and ribosomal genes RPL5 and RPL10 in T-cell acute lymphoblastic leukemia. Nat. Genet.45, 186–190 (2013). - PMC - PubMed
    1. Li, Y. et al. IL-7 Receptor mutations and steroid resistance in pediatric T cell acute lymphoblastic leukemia: a genome sequencing study. PLoS Med.13, e1002200 (2016). - PMC - PubMed
    1. Degryse, S. et al. JAK3 mutants transform hematopoietic cells through JAK1 activation causing T-cell acute lymphoblastic leukemia in a bone marrow transplant mouse model. Blood124, 3092–3100 (2014). - PubMed
    1. Atak, Z. K. et al. Comprehensive analysis of transcriptome variation uncovers known and novel driver events in T-cell acute lymphoblastic leukemia. PLoS Genet.9, e1003997(2013). - PMC - PubMed
    1. Liu Y, et al. The genomic landscape of pediatric and young adult T-lineage acute lymphoblastic leukemia. Nat. Genet. 2017;49:1211–1218. doi: 10.1038/ng.3909. - DOI - PMC - PubMed

Publication types

MeSH terms