

Colonization of Warsaw by the red fox Vulpes vulpes in the years 1976-2019
- PMID: 34230499
- PMCID: PMC8260808
- DOI: 10.1038/s41598-021-92844-2
Colonization of Warsaw by the red fox Vulpes vulpes in the years 1976-2019
Abstract
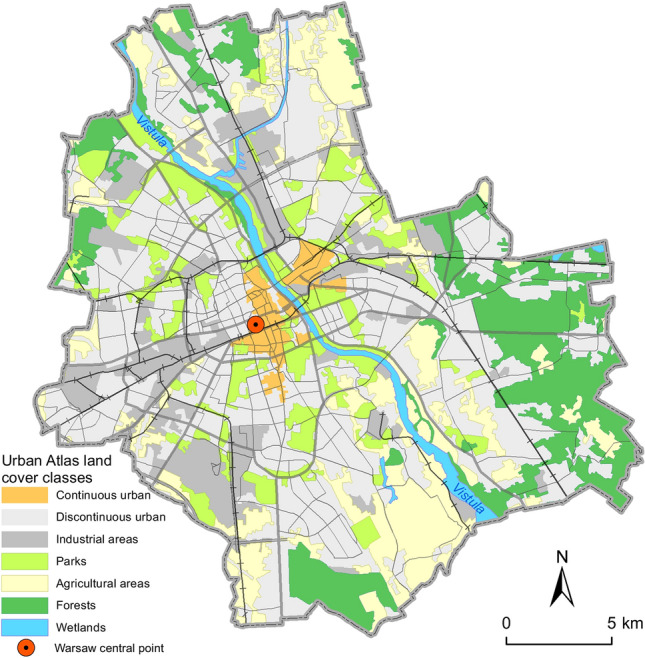
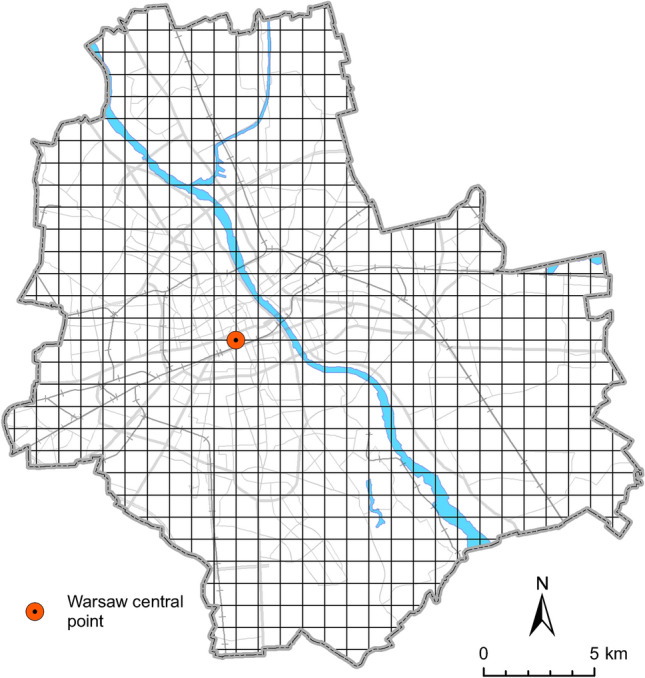
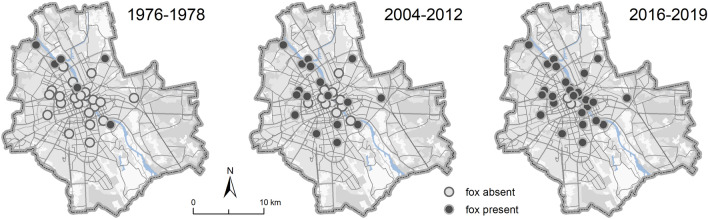
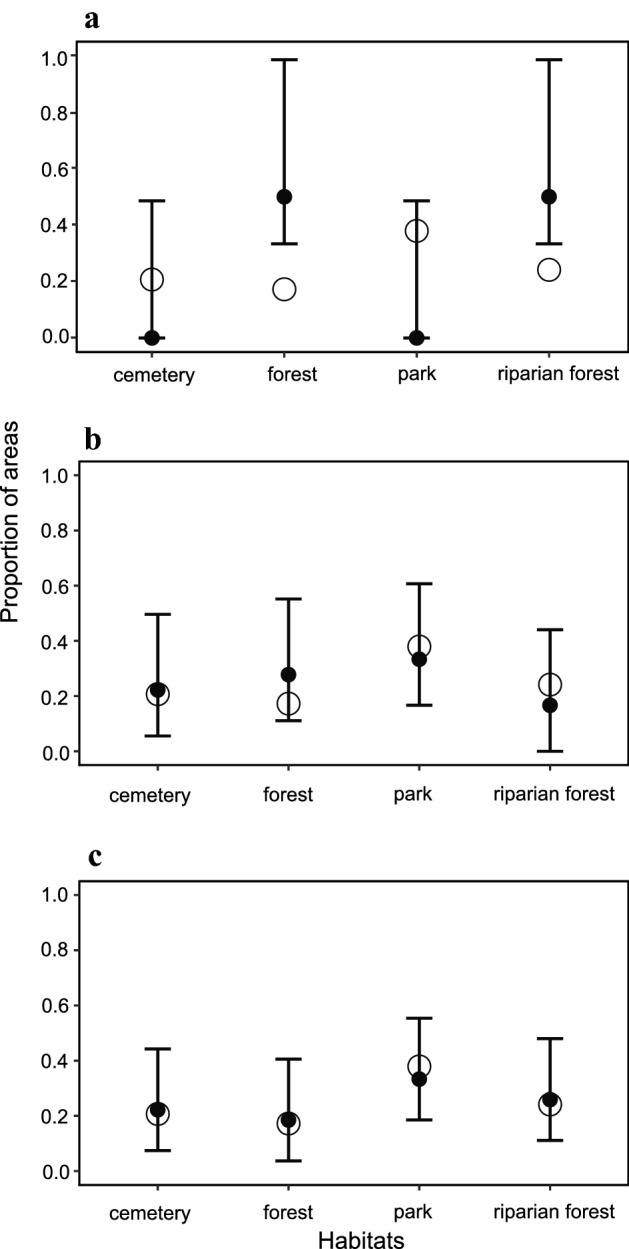
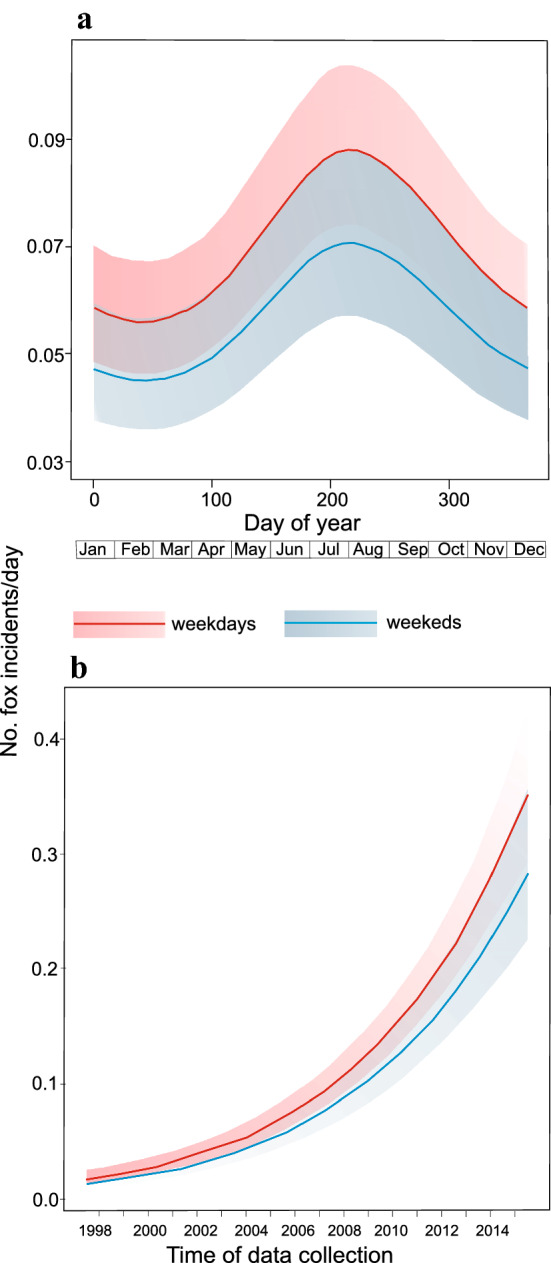
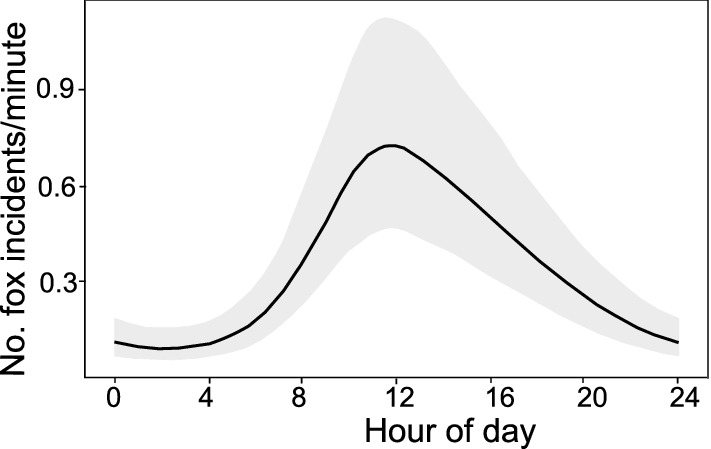
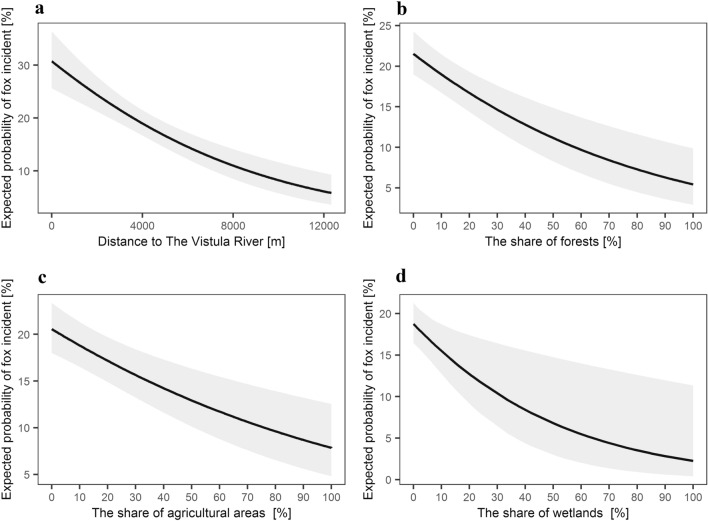
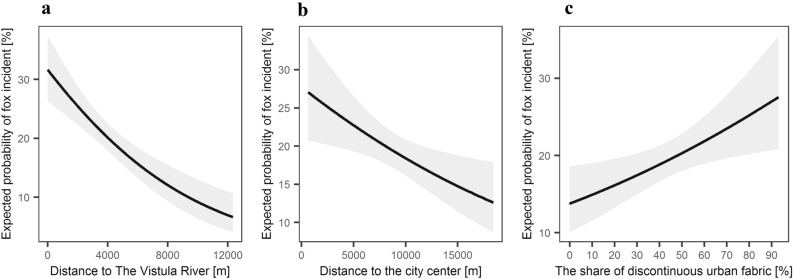
The red fox is one of the most adaptable carnivores inhabiting cities. The aim of our study was to describe the process of Warsaw colonization by the red fox. We focused on: (1) the fox distribution in Warsaw on the basis of presence-absence data (2005-2012) over a grid of 1 × 1 km2, (2) the process of settlement in 29 green areas (study periods 1976-1978, 2004-2012, and 2016-2019) in relation to habitat type, and (3) temporal and spatial patterns of the red fox incidents (1998-2015) reported by Warsaw citizens. We found out that: (1) the red fox penetrated the whole city (i.e. its presence was confirmed in all squares of the grid), (2) 21% of the green areas were colonized in 1976-1978 but 93% in 2016-2019. Forests and riparian habitats were occupied more frequently than parks and cemeteries in 1976-1978 with no difference in the further years; (3) the probability of the fox incidents increased over years, was higher in June-October, on working days, and around noon, and with the share of discontinuous urban fabric in the buffers around incident locations. Nevertheless, the incidents only partially reflect population abundance trends and activity patterns of the species, so should be treated cautiously.
Conflict of interest statement
The authors declare no competing interests.
Figures
References
-
- Baker PJ, Newman T, Harris S. Bristol’s foxes—40 years of change. Br. Wildl. 2001;12:411–417.
-
- Vuorisalo T, et al. Urban development from an avian perspective: Causes of hooded crow (Corvus corone cornix) urbanization in two Finnish cities. Landsc. Urban Plan. 2003;62:69–87. doi: 10.1016/S0169-2046(02)00124-X. - DOI
-
- Baker PJ, Harris S. Urban mammals: What does the future hold? An analysis of the factors affecting patterns of use of residential gardens in Great Britain. Mammal Rev. 2007;37:297–315.
-
- Evans KL, Hatchwell BJ, Parnell M, Gaston KJ. A conceptual framework for the colonization of urban areas: The blackbird Turdus merula as a case study. Biol. Rev. 2010;85:643–667. - PubMed
-
- Geiger M, Taucher AL, Gloor S, Hegglin D, Bontadina F. In the footsteps of city foxes: Evidence for a rise of urban badger populations in Switzerland. Hystrix It. J. Mamm. 2018;29:236–238.
MeSH terms
LinkOut - more resources
Full Text Sources
