. 2021 Dec;28(12):3297-3315.
doi: 10.1038/s41418-021-00817-9. Epub 2021 Jul 6.

Prolonged SARS-CoV-2 RNA virus shedding and lymphopenia are hallmarks of COVID-19 in cancer patients with poor prognosis

Anne-Gaëlle Goubet #  1   2   3 Agathe Dubuisson #  2   3 Arthur Geraud  2   4   5 François-Xavier Danlos  2   3 Safae Terrisse  2   3 Carolina Alves Costa Silva  2   3 Damien Drubay  2   6   7 Lea Touri  2   8 Marion Picard  2   3   9   10   11 Marine Mazzenga  2   3 Aymeric Silvin  2   3 Garett Dunsmore  2   3 Yacine Haddad  2   3 Eugenie Pizzato  2   3 Pierre Ly  2   3 Caroline Flament  2   3 Cléa Melenotte  2   3 Eric Solary  1   2   12   13 Michaela Fontenay  14   15 Gabriel Garcia  2   16 Corinne Balleyguier  2   16 Nathalie Lassau  1   2   16   17 Markus Maeurer  18 Claudia Grajeda-Iglesias  2   3   19   20 Nitharsshini Nirmalathasan  2   19   20 Fanny Aprahamian  2   19   20 Sylvère Durand  2   19   20 Oliver Kepp  19   20 Gladys Ferrere  2   3 Cassandra Thelemaque  2   3 Imran Lahmar  2   3 Jean-Eudes Fahrner  2   3 Lydia Meziani  2   21 Abdelhakim Ahmed-Belkacem  22 Nadia Saïdani  23 Bernard La Scola  24   25 Didier Raoult  24   25 Stéphanie Gentile  26 Sébastien Cortaredona  25   27 Giuseppe Ippolito  28 Benjamin Lelouvier  29 Alain Roulet  29 Fabrice Andre  1   2   4   30 Fabrice Barlesi  2   4   31 Jean-Charles Soria  1   2 Caroline Pradon  2   32   33 Emmanuelle Gallois  2   34 Fanny Pommeret  2   4 Emeline Colomba  2   4 Florent Ginhoux  35   36   37 Suzanne Kazandjian  38 Arielle Elkrief  38   39 Bertrand Routy  39   40 Makoto Miyara  41 Guy Gorochov  41 Eric Deutsch  1   2   21   42 Laurence Albiges  1   2   4 Annabelle Stoclin  2   43 Bertrand Gachot  2   44 Anne Florin  2   8 Mansouria Merad  2   45 Florian Scotte  2   46 Souad Assaad  47   48   49 Guido Kroemer  2   19   20   50   51   52   53 Jean-Yves Blay  47   48   49 Aurélien Marabelle  2   3   4   5   54 Frank Griscelli  2   34   55   56   57 Laurence Zitvogel #  58   59   60   61 Lisa Derosa #  62   63   64   65
Affiliations

Prolonged SARS-CoV-2 RNA virus shedding and lymphopenia are hallmarks of COVID-19 in cancer patients with poor prognosis

Anne-Gaëlle Goubet et al. Cell Death Differ. 2021 Dec.

Abstract

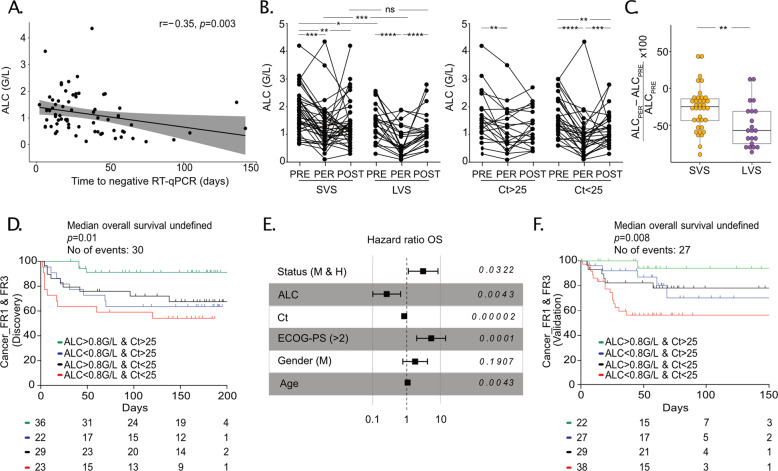
Patients with cancer are at higher risk of severe coronavirus infectious disease 2019 (COVID-19), but the mechanisms underlying virus-host interactions during cancer therapies remain elusive. When comparing nasopharyngeal swabs from cancer and noncancer patients for RT-qPCR cycle thresholds measuring acute respiratory syndrome coronavirus-2 (SARS-CoV-2) in 1063 patients (58% with cancer), we found that malignant disease favors the magnitude and duration of viral RNA shedding concomitant with prolonged serum elevations of type 1 IFN that anticorrelated with anti-RBD IgG antibodies. Cancer patients with a prolonged SARS-CoV-2 RNA detection exhibited the typical immunopathology of severe COVID-19 at the early phase of infection including circulation of immature neutrophils, depletion of nonconventional monocytes, and a general lymphopenia that, however, was accompanied by a rise in plasmablasts, activated follicular T-helper cells, and non-naive Granzyme B+FasL+, EomeshighTCF-1high, PD-1+CD8+ Tc1 cells. Virus-induced lymphopenia worsened cancer-associated lymphocyte loss, and low lymphocyte counts correlated with chronic SARS-CoV-2 RNA shedding, COVID-19 severity, and a higher risk of cancer-related death in the first and second surge of the pandemic. Lymphocyte loss correlated with significant changes in metabolites from the polyamine and biliary salt pathways as well as increased blood DNA from Enterobacteriaceae and Micrococcaceae gut family members in long-term viral carriers. We surmise that cancer therapies may exacerbate the paradoxical association between lymphopenia and COVID-19-related immunopathology, and that the prevention of COVID-19-induced lymphocyte loss may reduce cancer-associated death.


Conflict of interest statement

LZ and GK are cofounders of everImmune, a biotech company devoted to the use of commensal microbes for the treatment of cancers. AG and AM as part of the Drug Development Department (DITEP) are Principal/sub-Investigator of Clinical Trials for Abbvie, Adaptimmune, Aduro Biotech, Agios Pharmaceuticals, Amgen, Argen-X Bvba, Arno Therapeutics, Astex Pharmaceuticals, Astra Zeneca, Astra Zeneca Ab, Aveo, Bayer Healthcare Ag, Bbb Technologies Bv, Beigene, Bioalliance Pharma, Biontech Ag, Blueprint Medicines, Boehringer Ingelheim, Boston Pharmaceuticals, Bristol-Myers Squibb, Bristol-Myers Squibb International Corporation, Ca, Celgene Corporation, Cephalon, Chugai Pharmaceutical Co., Clovis Oncology, Cullinan-Apollo, Daiichi-Sankyo, Debiopharm S.A., Eisai, Eisai Limited, Eli Lilly, Exelixis, Forma Tharapeutics, Gamamabs, Genentech, Gilead Sciences, Glaxosmithkline, Glenmark Pharmaceuticals, H3 Biomedicine, Hoffmann-La Roche Ag, Incyte Corporation, Innate Pharma, Institut De Recherche Pierre Fabre, Iris Servier, Janssen Cilag, Janssen Research Foundation, Kura Oncology, Kyowa Kirin Pharm. Dev., Lilly France, Loxo Oncology, Lytix Biopharma As, Medimmune, Menarini Ricerche, Merck Kgaa, Merck Sharp & Dohme Chibret, Merrimack Pharmaceuticals, Merus, Millennium Pharmaceuticals, Molecular Partners Ag, Nanobiotix, Nektar Therapeutics, Nerviano Medical Sciences, Novartis Pharma, Octimet Oncology Nv, Oncoethix, Oncomed, Oncopeptides, Onyx Therapeutics, Orion Pharma, Oryzon Genomics, Ose Pharma, Pfizer, Pharma Mar, Philogen S.P.A., Pierre Fabre Medicament, Plexxikon, Rigontec Gmbh, Roche, Sanofi Aventis, Sierra Oncology, Sotio A.S, Syros Pharmaceuticals, Taiho Pharma, Tesaro, Tioma Therapeutics, Wyeth Pharmaceuticals France, Xencor, Y’s Therapeutics, Research Grants from Astrazeneca, BMS, Boehringer Ingelheim, Janssen Cilag, Merck, Novartis, Pfizer, Roche, Sanofi. Non-financial support (drug supplied) from Astrazeneca, Bayer, BMS, Boringher Ingelheim, Johnson & Johnson, Lilly, Medimmune, Merck, NH TherAGuiX, Pfizer, Roche. NL reports to be a Speaker at Jazz Pharmaceutical E.D. reports grants and personal fees from ROCHE GENENTECH, grants from SERVIER, grants from ASTRAZENECA, grants and personal fees from MERCK SERONO, grants from BMS, grants from MSD, outside the submitted work. OK is a cofounder of Samsara Therapeutics. F.B. reports personal fees from Astra Zeneca, Bayer, Bristol-Myers Squibb, Boehringer Ingelheim, Eli Lilly Oncology,ß. Hoffmann-La Roche Ltd, Novartis, Merck, MSD, Pierre Fabre, Pfizer and Takeda, outside the submitted work. J-CS was a full-time employee of Astra Zeneca between September 2017 and December 2019, he reports consultancy: Relay Therapeutics, Gritstone Oncology and shares: Gritstone, Astra Zeneca, Daiichi-Sankyo, outside the submitted work. LA reports consulting fees compensated to institution for Pfizer, Novartis, Bristol Myer Squibb, Ipsen, Roche, MSD, Astra Zeneca, Merck, Amgen, Astellas, Exelixis, Corvus Pharmaceuticals, Peloton Therapeutics, outside the submitted work. FS reports consulting fees from AMGEN, Roche, Chugai, Mylan, Mundi Pharma, Leo Pharma, Pierre Fabre Oncology, Helsinn, MSD, Pfizer, BMS, outside the submitted work.

Figures

Fig. 1
Fig. 1. Prolonged duration of SARS-CoV-2 RNA shedding correlated with high viral load and COVID-19 severity in patients with cancer.
A Graphical schema of cohorts and patients’ accrual. B Proportion of patients with cancer from translational research (TR) (Cancer_FR1_TR, n = 35, magenta area) or healthcare workers (HCW, n = 45, blue area) by days of RT-qPCR positivity. Vertical dashed line at 40 days represents the 95th percentile of HCW and the median of positivity of patients with cancer. C Kaplan–Meier curves of time to negative RT-qPCR in HCW (n = 45, blue dotted lines) and patients with cancer (Cancer_FR1_TR, n = 35, magenta continuous lines). D COVID-19+ cancer-bearing or history of cancer (+) and cancer-free (−) individuals from FR2 treated with hydroxychloroquine +/− azithromycin: number (percentages) of patients with RT-qPCR positivity beyond 16 days (90th percentile of the cancer-free population of FR2). E Number (percentages) of HCW, Cancer_FR1 patients (Cancer_FR1_TR), or Canadian patients with cancer (Cancer_CA) with short, intermediate (grouped in short-term viral RNA shedding, SVS), and prolonged (long-term viral RNA shedding, LVS) viral RNA shedding (E), according to the presence/absence of viral symptoms (symptomatic, Sym, vs asymptomatic, Asym) (F), diagnosis of hematological (H) versus solid (S) malignancy (G), and cancer staging (localized (L), locally advanced (LA), metastatic (M)) (H). I Number (percentages) of Cancer_FR1 patients (from translational research and clinical routine), Cancer_FR2 patients (Cancer_FR2) or Canadian patients with cancer (Cancer_CA) divided in SVS and LVS and regarding their respective COVID-19 severity. J Spearman correlation between Cycle threshold (Ct) for the RT-qPCR amplification of genes encoding proteins of SARS-CoV-2 replication–transcription complex at diagnosis and duration of RT-qPCR positivity for Cancer_FR1 (from translational research and clinical routine), each dot representing one sample/patient. K Ct values for the RT-qPCR amplification of genes encoding proteins of SARS-CoV-2 replication–transcription complex in nasopharyngeal swabs performed at diagnosis in SVS versus LVS in Cancer_FR1_TR and CR and Cancer_FR2, and dynamics over time from day 0 up to day 80 after inclusion in SVS (n = 33 samples, n = 28 patients, orange dots) versus LVS (57 samples, n = 17 patients, purple dots) in Cancer_FR1 (from translational research and clinical routine). L Redundancy statistical analysis (RDA) of cancer and viral related-clinical factors accounting for the variance of SARS-CoV-2 viral shedding status. Clinical components were influenced by the virus shedding (SVS versus COVID-19-negative, P = 0.037; LVS versus COVID-19 negative, P = 0.0010), COVID severity (mild versus COVID-19-negative, P = 0.0030; moderate versus COVID-19-negative, P = 0.0574; severe versus COVID-19-negative, P not computable), age (P = 0.0514), hematological rather than solid malignancy (hematological versus solid, P = 0.001), metastatic status (P = 0.0059), and Ct values at diagnosis (≥25 versus < 25, P = 0.0738). Chi-square tests with *P < 0.05, **P < 0.01, ***P < 0.001, ****P < 0.0001.
Fig. 2
Fig. 2. Immunotypes associated with prolonged viral RNA shedding in patients with cancer.
A Volcano plot of the differential cellular and soluble immune parameters contrasting short-term viral RNA shedding (SVS) versus long-term viral RNA shedding (LVS) during the first 20 days of symptoms. Volcano plot was generated computing for each immune factor: (i) the log2 of fold change among the mean relative percentages after normalization in SVS versus LVS (x axis); (ii) the log10 of P values deriving from Wilcoxon test calculated on relative percentages in absolute values (y axis). Black and red dots are considered nonsignificant (P < 0.05) or significant (P > 0.05), respectively. BF Temporal changes and correlation of blood leukocyte parameters measured by high-dimensional spectral flow cytometry (BD) and soluble factors IFNα2a and anti-SARS-CoV-2 IgG (E, F) in various phases of COVID-19 presentation (no virus infection (Ctls, gray dots), asymptomatic viral infection (Asym, light blue dots), symptomatic viral infection examined in the first 20 days (≤20 d) or after 20 days (>20 d) of symptoms with those experiencing short-term viral RNA shedding (SVS, orange dots) or long-term viral RNA shedding (LVS, purple dots) and RT-qPCR-negative COVID-19 patients in the convalescent phase (recovery, green dots, or circled dots). Box plots display a group of numerical data through their 3rd and 1st quartiles (box), mean (central band), minimum and maximum (whiskers). Each dot represents one sample, each patient being drawn one to three times. Statistical analyses used one-way ANOVA with Kenward–Roger method to take into account the number of specimen/patient: *P < 0.05, **P < 0.01, ***P < 0.001, ****P < 0.0001. BD Percentages of neutrophils that do not express either CD101 and/or CD10 and lost CD16 within the gate of CD45+CD56-CD3-CD19-CD15+ cells (B, upper panel). Spearman correlation between the percentage of immature neutrophils (CD10+/−CD101+/−CD16) measured within the first 20 days of symptoms with the duration of SARS-CoV-2 RT-qPCR positivity (B, lower panel). C, D Percentages of CD38+ICOS+ among CXCR5+PD-1+ non-naive CD4+ (C, left panel), plasmablasts defined as CD19lowCD38highCD27+ within the CD19+ gate (C, right panel), double-negative IgD-CD27- among CD19+ cells (D, left panel) and their Spearman correlation when measured within the first 20 days of symptoms with the duration of SARS-CoV-2 RT-qPCR positivity (D, right panel). E Ultrasensitive electrochemiluminescence assay to monitor the serum concentrations of IFNα2a (E, left panel) in a kinetic fashion (E, right panel). Each line and dot represent one patient and one sample, respectively, and the dashed line represents the median value of controls. F Spearman correlation between the serum IFNα2a values measured in symptomatic patients with IgG titers against SARS-CoV-2 S1 RBD considered as continuous variables (F, left panel). The raw data are represented in the right panel at both time points for each group of patients.
Fig. 3
Fig. 3. Lymphopenia and high viral load are dismal prognosis factors for overall survival in cancer patients in the first and second surge of the pandemic.
A Spearman correlation between the absolute lymphocyte counts (ALC) of Cancer_FR1 (from translational research and clinical routine), with the duration of SARS-CoV-2 RT-qPCR positivity (only evaluable patients for both factors, n = 69 patients). B, C ALC of Cancer_FR1 (from translational research and clinical routine) in SVS (n = 37 patients) versus LVS (n = 22 patients) subsets (B, left panel) or SARS-CoV-2-cycle threshold (Ct) >25 (n = 21 patients) versus Ct <25 (n = 29 patients) (B, right panel) monitored during the COVID-19 pandemic (“PER”, between −4 and +7 days of the disease diagnosis by RT-qPCR), between 210 and 12 days before the symptom onset of COVID-19 (“PRE”) or within the recovery period (between 0 and 123 days after negative RT-qPCR) (“POST”) at Gustave Roussy, with the calculation of the reduction between “PRE” and during COVID-19 (C). One patient defined as an outlier (at 215%) by ROUT method was excluded from the LVS group for the analysis. Each line and dot represents one patient and one sample. Statistical analyses used one-way ANOVA (paired and unpaired) with Kenward–Roger method taking into account the number of specimen/patient (B): *P < 0.05, **P < 0.01, ***P < 0.001, ****P < 0.0001, and Mann–Whitney (C): **P < 0.01. D Kaplan–Meier curve and Cox regression analysis of overall survival of cancer patients from the Discovery (1st surge) cohort (Cancer_FR1 + Cancer_FR3), all stages included, according to ALC and Ct value at diagnosis. Refer to Table 1 for patient characteristics. E Multivariate Cox regression analysis stratified for the cohort and adjusted for age, ECOG status, gender, and metastatic and/or hematological status of cancer patients from the Discovery (1st surge) cohort (Cancer_FR1 + Cancer_FR3). F Kaplan–Meier curve and Cox regression analysis of overall survival of cancer patients from Validation (2nd surge) cohort (Cancer_FR1 + Cancer_FR3), all stages included, according to ALC and Ct value at diagnosis. Refer to Table 1 for patient characteristics.
Fig. 4
Fig. 4. Prolonged viral shedding is associated with T-cell exhaustion.
A Spearman correlation matrix focusing on the most significant immune variables and serum analytes monitored within the first 20 days of symptoms in patients diagnosed with COVID-19 in the Cancer_FR1_TR cohort. Stars indicate significant values (P < 0.05) for positive (red) or negative (blue) correlations. B Percentages of PD-1 expressing cells within the non-naive CD8+CD3+ population (B, upper panel), monitoring in various phases of COVID-19 presentation (no virus infection (Ctls, gray dots), asymptomatic viral infection (Asym, light blue dots), symptomatic viral infection examined in the first 20 days (≤20 d) or after 20 days (>20 d) of symptoms with those experiencing short-term viral RNA shedding (SVS, orange dots) or long-term viral RNA shedding (LVS, purple dots) and RT-qPCR-negative COVID-19 patients in the convalescent phase (recovery, green dots or circled dots) among Cancer_FR1_TR (B, middle panel) and Spearman correlation with the duration of SARS-CoV-2 RT-qPCR positivity measured within the first 20 days of symptoms (B, lower panel). C Percentages of subsets co-expressing PD-1 and Granzyme B (C, left panel) or Granzyme B and FasL (C, right panel) in non-naive CD8+. D Percentage of PD-1+ and Granzyme B+ within the non-naive CD8+ expressing EomeshighTCF-1high gate (D, left panel) and Spearman correlation between this ratio measured within the first 20 days of symptoms with the duration of SARS-CoV-2 RT-qPCR positivity (D, right panel). Box plots display a group of numerical data through their 3rd and 1st quartiles (box), mean (central band), minimum, and maximum (whiskers). Each dot represents one sample, each patient being drawn one to three times. Statistical analyses used one-way ANOVA with Kenward–Roger method to take into account the number of specimen/patients: *P < 0.05, **P < 0.01, ***P < 0.001. Each line and dot represents one patient and one sample, respectively (B, middle panel).
Fig. 5
Fig. 5. Lymphopenia and prolonged viral shedding are associated with perturbations of the polyamine and biliary acid pathways.
A Volcano plot identifying statistically different serum metabolites between patients experiencing short-term viral RNA shedding (SVS) and those experiencing long-term viral RNA shedding (LVS) in Cancer_FR1_TR cohort. Metabolites significantly different between both groups are in red and annotated (P < 0.05, FC > 0.5). B Levels of murideoxycholic acid according to the duration of viral shedding in Cancer_FR1_TR (left panel) and Spearman correlation with absolute lymphocyte count (ALC) (right panel). The color code corresponds to the category of cycle threshold (Ct) and ALC at diagnosis. C, D Serum concentrations of deoxycholic acid according to the duration of viral shedding in Cancer_FR1_TR (C) and the severity of COVID-19 infection in cancer-free individuals (D). E Waterfall plot of Spearman’s correlation coefficient (rs) between ALC and 221 metabolites in the serum of patients diagnosed positive for COVID-19. F N1, N8 diacetylspermidine relative abundance in controls, SVS and LVS patients in the Cancer_FR1 cohort, that is negatively correlated with the ALC. The color code corresponds to the category of cycle threshold (Ct) and ALC at diagnosis. G Levels of N1, N8 diacetylspermidine in noncancer COVID-19 patients according to the clinical severity compared to COVID-19-negative controls (Ctls) (P < 0.0001) (G, left panel), that are negatively correlated with the absolute lymphocyte count (ALC) (G, right panel). Box plots display a group of numerical data through their 3rd and 1st quartiles (box), mean (central band), minimum and maximum (whiskers). Each dot represents one sample, each patient being drawn once for cancer-free individuals and one to two times for cancer patients. Statistical analyses used one-way ANOVA with Kenward–Roger method to take into account the number of specimen/patient (B, left panel, CE, left panel): *P < 0.05, **P < 0.01), non-parametric unpaired Wilcoxon test (Mann–Whitney) for each two-group comparison: *P < 0.05, **P < 0.01, ***P < 0.001, ****P < 0.0001.
Fig. 6
Fig. 6. Lymphopenia and prolonged viral shedding are associated with blood recirculation of Enterobacteriaceae and Micrococcaceae DNA.
A Stacked bar charts showing the relative abundance of bacterial families obtained by 16S sequencing of the whole-blood samples in patients experiencing short-term viral RNA shedding (SVS) and long-term viral RNA shedding (LVS) among Cancer_FR1_TR. Only the top 15 most abundant bacterial families are represented (the others are in the category “Other”). B Linear discriminant analysis effect size (LEfSe) analysis displaying linear discriminant analysis score (LDA) of the blood bacterial taxa differentially recovered from SVS (orange) versus LVS (purple) patients (*P < 0.05 with Mann–Whitney test between the two groups of patients). C Mean (bar plots, +/− SEM) and individual values (dot plots) of relative proportions of Enterobacteriaceae (C, left panel) and Micrococcaceae (C, right panel) family members in SARS-CoV-2-positive and recovered patients. Significance between SVS and LVS patients was evaluated using Mann–Whitney test (*P < 0.05). D, E Spearman correlations between the relative proportions of Enterobacteriaceae with paired concentrations of CCL22 in serum (D) and with paired percentages of Granzyme B (GzB)+PD-1+ in EomeshiTCF-1hi non-naive CD8+ measured in blood (E). F Idem as in A. considering segregating the cohort in two groups; ALC > 0.8 G/L and/or Ct >25 patients versus ALC < 0.8 G/L & Ct <25 patients. G LEfSe analysis displaying LDA score of the blood bacterial taxa significantly increased in ALC > 0.8 G/L and/or Ct >25 patients (gray) and ALC < 0.8 G/L & Ct <25 patients (red). The displayed bacterial taxa are significantly different (*P < 0.05 with Mann–Whitney test) between the two groups of patients. H Idem as in C segregating the cohort into the same two groups as in F. Significance between ALC > 0.8 G/L and/or Ct >25 patients and ALC < 0.8 G/L & Ct <25 patients was evaluated using the Mann–Whitney test (*P < 0.05).

References

    1. Derosa L, Melenotte C, Griscelli F, Gachot B, Marabelle A, Kroemer G, et al. The immuno-oncological challenge of COVID-19. Nat Cancer. 2020;1:946–64. - PubMed
    1. Albiges L, Foulon S, Bayle A, Gachot B, Pommeret F, Willekens C, et al. Determinants of the outcomes of patients with cancer infected with SARS-CoV-2: results from the Gustave Roussy cohort. Nat Cancer. 2020;1:965–75. - PubMed
    1. Rugge M, Zorzi M, Guzzinati S. SARS-CoV-2 infection in the Italian Veneto region: adverse outcomes in patients with cancer. Nat Cancer. 2020;1:784–8. - PubMed
    1. Assaad S, Avrillon V, Fournier M-L, Mastroianni B, Russias B, Swalduz A, et al. High mortality rate in cancer patients with symptoms of COVID-19 with or without detectable SARS-COV-2 on RT-PCR. Eur J Cancer. 2020;135:251–9. - PMC - PubMed
    1. Luo J, Rizvi H, Preeshagul IR, Egger JV, Hoyos D, Bandlamudi C, et al. COVID-19 in patients with lung cancer. Ann Oncol. 2020;31:1386–96. - PMC - PubMed

Publication types

MeSH terms