[Preprint]. 2021 Jul 2:2021.07.01.21259859.
doi: 10.1101/2021.07.01.21259859.

Combining genomic and epidemiological data to compare the transmissibility of SARS-CoV-2 lineages

Affiliations

Combining genomic and epidemiological data to compare the transmissibility of SARS-CoV-2 lineages

Mary E Petrone et al. medRxiv. .

Update in

  • Combining genomic and epidemiological data to compare the transmissibility of SARS-CoV-2 variants Alpha and Iota.
    Petrone ME, Rothman JE, Breban MI, Ott IM, Russell A, Lasek-Nesselquist E, Badr H, Kelly K, Omerza G, Renzette N, Watkins AE, Kalinich CC, Alpert T, Brito AF, Earnest R, Tikhonova IR, Castaldi C, Kelly JP, Shudt M, Plitnick J, Schneider E, Murphy S, Neal C, Laszlo E, Altajar A, Pearson C, Muyombwe A, Downing R, Razeq J, Niccolai L, Wilson MS, Anderson ML, Wang J, Liu C, Hui P, Mane S, Taylor BP, Hanage WP, Landry ML, Peaper DR, Bilguvar K, Fauver JR, Vogels CBF, Gardner LM, Pitzer VE, St George K, Adams MD, Grubaugh ND. Petrone ME, et al. Commun Biol. 2022 May 11;5(1):439. doi: 10.1038/s42003-022-03347-3. Commun Biol. 2022. PMID: 35545661 Free PMC article.

Abstract

Emerging SARS-CoV-2 variants have shaped the second year of the COVID-19 pandemic and the public health discourse around effective control measures. Evaluating the public health threat posed by a new variant is essential for appropriately adapting response efforts when community transmission is detected. However, this assessment requires that a true comparison can be made between the new variant and its predecessors because factors other than the virus genotype may influence spread and transmission. In this study, we develop a framework that integrates genomic surveillance data to estimate the relative effective reproduction number (R t ) of co-circulating lineages. We use Connecticut, a state in the northeastern United States in which the SARS-CoV-2 variants B.1.1.7 and B.1.526 co-circulated in early 2021, as a case study for implementing this framework. We find that the R t of B.1.1.7 was 6-10% larger than that of B.1.526 in Connecticut in the midst of a COVID-19 vaccination campaign. To assess the generalizability of this framework, we apply it to genomic surveillance data from New York City and observe the same trend. Finally, we use discrete phylogeography to demonstrate that while both variants were introduced into Connecticut at comparable frequencies, clades that resulted from introductions of B.1.1.7 were larger than those resulting from B.1.526 introductions. Our framework, which uses open-source methods requiring minimal computational resources, may be used to monitor near real-time variant dynamics in a myriad of settings.


Figures

Figure 1:
Figure 1:. B.1.1.7 and B.1.526* dominated the circulating SARS-CoV-2 populations in Connecticut and New York City in early 2021.
(a) Trends in COVID-19 incidence were consistent across northeastern states throughout the pandemic. (map) Connecticut (teal) is bordered by New York, Rhode Island, and Massachusetts. New York City is less than 50 miles from Fairfield County. Weekly COVID-19 incidence was tabulated according to the Johns Hopkins COVID-19 portal (https://github.com/CSSEGISandData/COVID-19). Shapefile source: United States Census Bureau. (b) New Haven County led the state in the percentage of COVID-19 cases sequenced between November 30, 2020 and May 9, 2021 (3.33%). During this period, 0.51% of COVID-19 cases in New York City were sequenced. Genomes that were collected through targeted variant screening (e.g., spike-gene target failure) were excluded from this analysis. Shapefile source: the Connecticut Department of Energy & Environmental Protection (DEEP) Geographic Information Systems Open Data Website. (c) Together, B.1.1.7 and B.1.526* variants displaced nearly all other SARS-CoV-2 lineages in New Haven County (n = 2,086), Fairfield County (n = 612), and New York City (n = 4,528). The lineages of sequenced viruses were assigned using pangolin v.2.4.2. The lineages B.1.526, B.1.526.1, and B.1.526.2 were assigned to the general lineage category ‘B.1.526*’. We calculated a 7-day rolling average for the proportion of B.1.1.7, B.1526*, and ‘other’ SARS-CoV-2 lineages sequenced in our dataset. (d) Logistic regression of the growth rates per lineage using Rv.4.0.1. Line colors correspond to the legend in (c). (e) Slope of logistic growth shown in (d). Bar colors correspond to the legend in (c).
Figure 2:
Figure 2:. B.1.1.7 had a larger effective reproduction number (Rt) than B.1.526 during the COVID-19 vaccination campaign.
(a, d) Daily incidence and full vaccination rates (2 weeks post last dose) of B.1.1.7, B.1.526*, and other circulating lineages in New Haven County (a) and New York City (d). Daily cases were assigned to one of three lineage categories (‘B.1.1.7’, ‘B.1.526*’, and ‘other’) according to the 7-day rolling average of variant frequency among sequenced cases. ‘B.1.526*’ includes the sublineages B.1.526, B.1.526.1, and B.1.526.2. (b, e) Time-varying effective reproduction numbers (Rt) were calculated using the R package epiEstim. An Rt value above 1 indicates that an infected individual will, on average, infect more than 1 additional person. We assumed a serial interval of mean 5.2 days and standard deviation of 4 days for all lineages. We used a smoothing spline to smooth the daily Rt curves (line) with the package, stat in R v4.0.1. Non-smoothed estimates are shown as individual points. 0.025 and 0.975 quantiles are shown as dotted lines (c, f) Ratios of estimated Rt between March 4 and May 4, 2021 calculated using the splines shown in (b) and (e).
Figure 3:
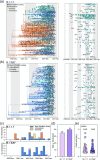
Figure 3:. B.1.1.7 was introduced into Connecticut at a similar frequency as B.1.526* but was associated with larger cluster sizes.
(a, b) Discrete phylogeography of B.1.1.7 (a) and B.1.526* (b). Tips and nodes were assigned one of four possible locations: Connecticut, New York/New Jersey, domestic, and international. The phylogeographic analysis was performed in BEAST using a time-resolved tree as the fixed topology . Bootstrap values for each clade are shown at each ancestral node (right) and were obtained by constructing individual maximum likelihood trees with 1000 ultrafast bootstraps in IQTree. Clades without a support value were part of polytomies. (c) We summed the number of sustained introductions for each variant by week. We defined sustained introductions as Connecticut-only clades containing at least 3 tips related by a non-Connecticut ancestor with at least 0.7 posterior probability for the inferred location. Bar colors indicate the source of introduction. (d) There were more sustained introductions of B.1.526* than B.1.1.7 into Connecticut. (e) The size of B.1.1.7 clades in Connecticut was on average larger than B.1.526* clades in Connecticut. We calculated the log10 size of Connecticut clades shown in (a) and (b). The horizontal line denotes the median log cluster size.

References

    1. Faria N. R. et al. Genomic characterisation of an emergent SARS-CoV-2 lineage in Manaus: preliminary findings. Virological (2021).
    1. Rambaut Andrew, Loman Nick, Pybus Oliver, Barclay Wendy, Barrett Jeff, Carabelli Alesandro, Connor Tom, Peacock Tom, David L Robertson Erik Volz. Preliminary genomic characterisation of an emergent SARS-CoV-2 lineage in the UK defined by a novel set of spike mutations. Virological (2020).
    1. Wibmer C. K. et al. SARS-CoV-2 501Y.V2 escapes neutralization by South African COVID-19 donor plasma. Nat. Med. 27, 622–625 (2021). - PubMed
    1. Grubaugh N. D., Hodcroft E. B., Fauver J. R., Phelan A. L. & Cevik M. Public health actions to control new SARS-CoV-2 variants. Cell 184, 1127–1132 (2021). - PMC - PubMed
    1. Hodcroft E. B. et al. Emergence and spread of a SARS-CoV-2 variant through Europe in the summer of 2020. medRxiv (2020) doi: 10.1101/2020.10.25.20219063. - DOI - PubMed

Publication types