. 2021 Oct 22;31(12):5526-5535.
doi: 10.1093/cercor/bhab176.

Associations between Task-Related Modulation of Motor-Evoked Potentials and EEG Event-Related Desynchronization in Children with ADHD

Affiliations

Associations between Task-Related Modulation of Motor-Evoked Potentials and EEG Event-Related Desynchronization in Children with ADHD

Joshua B Ewen et al. Cereb Cortex. .

Abstract

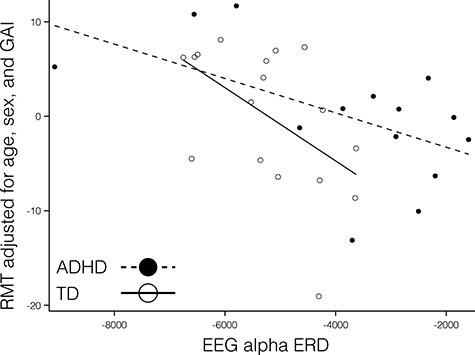
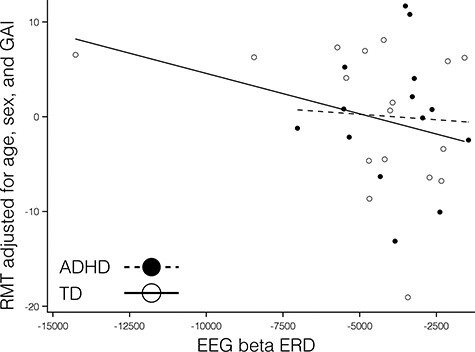
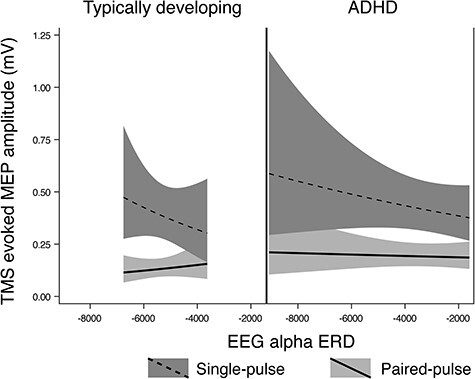
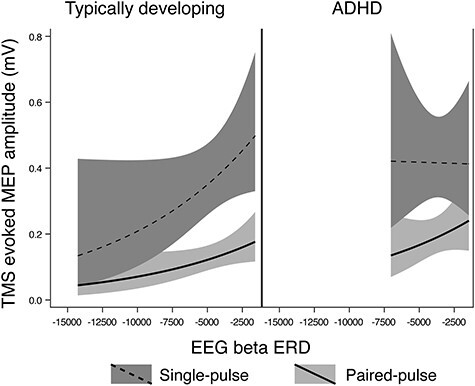
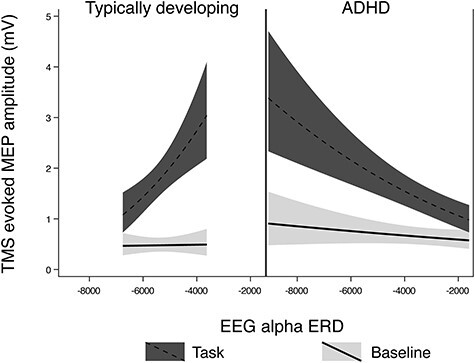
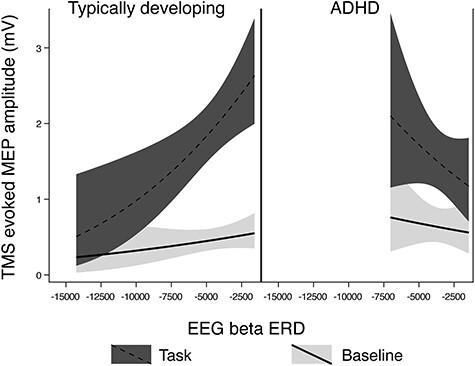
Children with attention-deficit/hyperactivity disorder (ADHD) have previously shown a decreased magnitude of event-related desynchronization (ERD) during a finger-tapping task, with a large between-group effect. Because the neurobiology underlying several transcranial magnetic stimulation (TMS) measures have been studied in multiple contexts, we compared ERD and 3 TMS measures (resting motor threshold [RMT], short-interval cortical inhibition [SICI], and task-related up-modulation [TRUM]) within 14 participants with ADHD (ages 8-12 years) and 17 control children. The typically developing (TD) group showed a correlation between greater RMT and greater magnitude of alpha (10-13 Hz, here) ERD, and there was no diagnostic interaction effect, consistent with a rudimentary model of greater needed energy input to stimulate movement. Similarly, inhibition measured by SICI was also greater in the TD group when the magnitude of movement-related ERD was higher; there was a miniscule diagnostic interaction effect. Finally, TRUM during a response-inhibition task showed an unanticipated pattern: in TD children, the greater TMS task modulation (TRUM) was associated with a smaller magnitude of ERD during finger-tapping. The ADHD group showed the opposite direction of association: Greater TRUM was associated with larger magnitude of ERD. Prior EEG results have demonstrated specific alterations of task-related modulation of cortical physiology, and the current results provide a fulcrum for multimodal study.

Keywords: ADHD; TMS; event-related desynchronization; mirror overflow; response inhibition.


Figures

Figure 1
Figure 1
There was a significant association between RMT (adjusted) and alpha ERD in the TD children (hollow circles and solid line; formula image; P = 0.024; with one highly influential point removed). The association in the ADHD group did not reach significance though the measured effect size was similar (formula image; P = 0.068; with one highly influential point removed). There was no significant diagnostic interaction effect (formula image and P = 0.62), contrary to our predictions.
Figure 2
Figure 2
There was no statistically-significant association between RMT and beta ERD in TDs (formula image; P = 0.14; and one influential point removed) or in the ADHD group (formula image; P = 0.97; and one influential point removed). There was no significant diagnostic-group interaction (formula image and P = 0.65). Note that the outlier to the negative end of the x-axis was not influential; removing it did not substantially alter the calculated statistical results.
Figure 3
Figure 3
Regression Mixed-Model alpha ERD/baseline SICI relationships in n = 17 TD children and n = 14 children with ADHD. In these figures, the upper (dashed) line is single pulse MEP amplitudes, the lower (solid) line is 3-ms paired (inhibitory) MEP amplitudes. A greater distance between the 2 lines indicates a greater SICI ratio (i.e., more inhibition), and a more negative ERD value indicates a higher magnitude of ERD. The baseline SICI-alpha ERD association reached statistical significance in the control group (P = 0.0024) but not in the ADHD group (P = 0.27), with a statistically significant but very-small-magnitude diagnostic interaction effect (P = 0.017).
Figure 4
Figure 4
Regression Mixed-Model beta ERD/SICI relationships in n = 17 TD children and n = 14 children with ADHD. In these figures, the upper (dashed) line is single pulse MEP amplitudes, the lower (solid) line is 3 ms paired (inhibitory) MEP amplitudes, with a greater distance between the 2 lines indicating a larger SICI effect. A more negative ERD value indicates a greater magnitude of ERD. There was no statistical association between SICI and beta ERD in the TD group (P = 0.85), however there was a significant association in the ADHD group (P = 0.045). There was no significant diagnostic-group interaction effect (P = 0.11), though the plot illustrates an opposite direction of association between groups, with TD showing a smaller SICI ratio associated with a larger magnitude of ERD and ADHD showing a larger SICI ratio associated with a larger magnitude of ERD. The nonlinear shape in TD is due to logarithmic transformation to optimize residuals.
Figure 5
Figure 5
Regression Mixed-Model alpha ERD/TRUM relationships in n = 8 TD children and n = 9 children with ADHD. In these figures, the upper (red) line is MEP amplitudes during the response inhibition task trials, the lower (blue) line is the MEP amplitudes at rest. Among TD children with more left M1 alpha ERD when finger tapping, there is less left M1 TRUM (the ratio of the red to the blue line value) (P < 0.001). The relationship is opposite children with ADHD (P < 0.001), and the diagnostic interaction effect was large (P < 0.001). The nonlinear shape is due to logarithmic transformation to optimize residuals.
Figure 6
Figure 6
Regression Mixed-Model beta ERD/TRUM relationships in n = 8 TD children and n = 9 children with ADHD. In these figures, the upper (red) line is MEP amplitudes during the response inhibition task trials, the lower (blue) line is the MEP amplitudes at rest. The pattern of results was similar to that seen with alpha ERD: that is, TD children showed a greater magnitude of ERD when the magnitude of TRUM was smallest (P < 0.001), and the children with ADHD showed a greater magnitude of ERD when the magnitude of TRUM was the largest (P = 0.021). The was a diagnostic interaction effect (P < 0.001). The nonlinear shape in the TD group is due to logarithmic transformation to optimize residuals.

References

    1. Cannon J, McCarthy MM, Lee S, Lee J, Borgers C, Whittington MA, Kopell N. 2014. Neurosystems: brain rhythms and cognitive processing. Eur J Neurosci. 39:705–719. - PMC - PubMed
    1. Chen R, Yaseen Z, Cohen LG, Hallett M. 1998. Time course of corticospinal excitability in reaction time and self-paced movements. Ann Neurol. 44:317–325. - PubMed
    1. Cole WR, Mostofsky SH, Larson JC, Denckla MB, Mahone EM. 2008. Age-related changes in motor subtle signs among girls and boys with ADHD. Neurology. 71:1514–1520. - PMC - PubMed
    1. Conners CK, Sitarenios G, Parker JD, Epstein JN. 1998. The revised Conners' Parent Rating Scale (CPRS-R): factor structure, reliability, and criterion validity. J Abnorm Child Psychol. 26:257–268. - PubMed
    1. Coxon JP, Stinear CM, Byblow WD. 2006. Intracortical inhibition during volitional inhibition of prepared action. J Neurophysiol. 95:3371–3383. - PubMed

Publication types