. 2021 Sep 6;220(9):e202101092.
doi: 10.1083/jcb.202101092. Epub 2021 Jul 7.

Catalytically inactive, purified RNase H1: A specific and sensitive probe for RNA-DNA hybrid imaging

Affiliations

Catalytically inactive, purified RNase H1: A specific and sensitive probe for RNA-DNA hybrid imaging

Magdalena P Crossley et al. J Cell Biol. .

Abstract

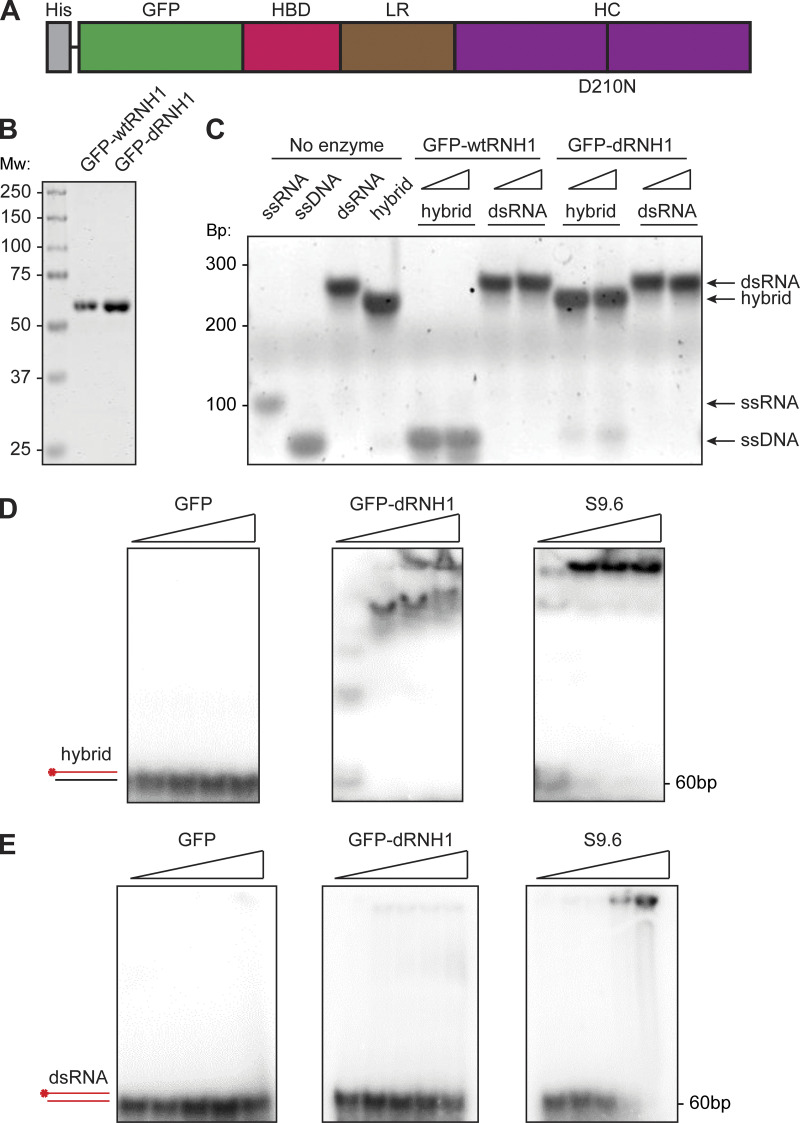
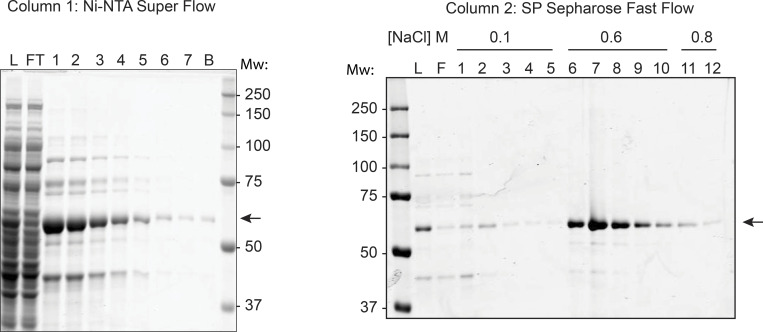
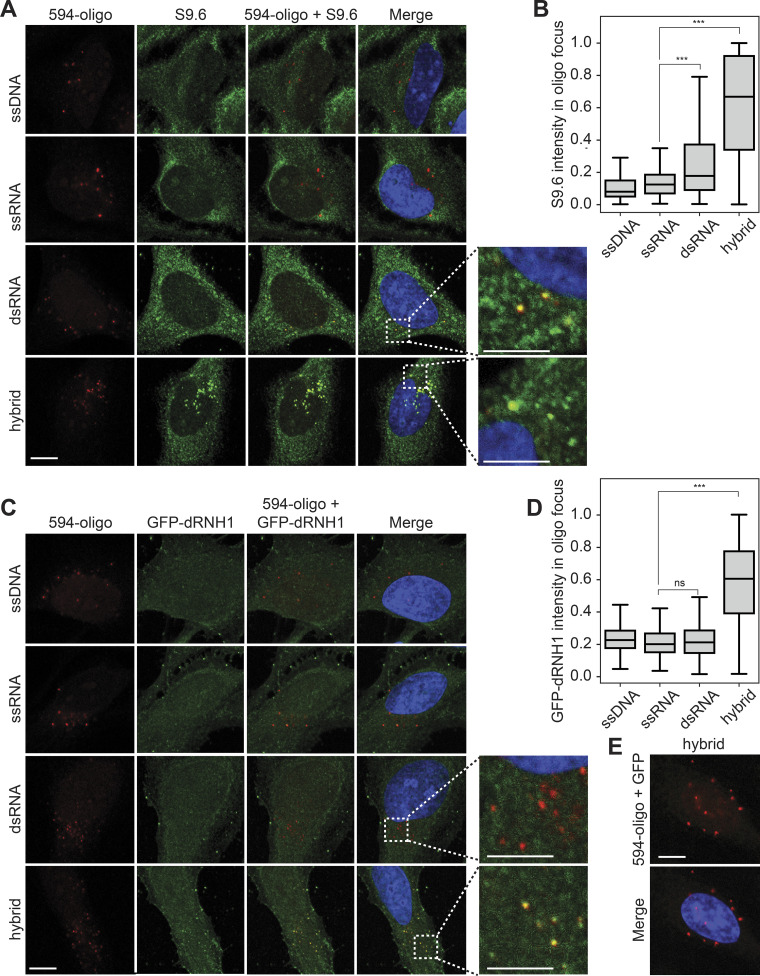
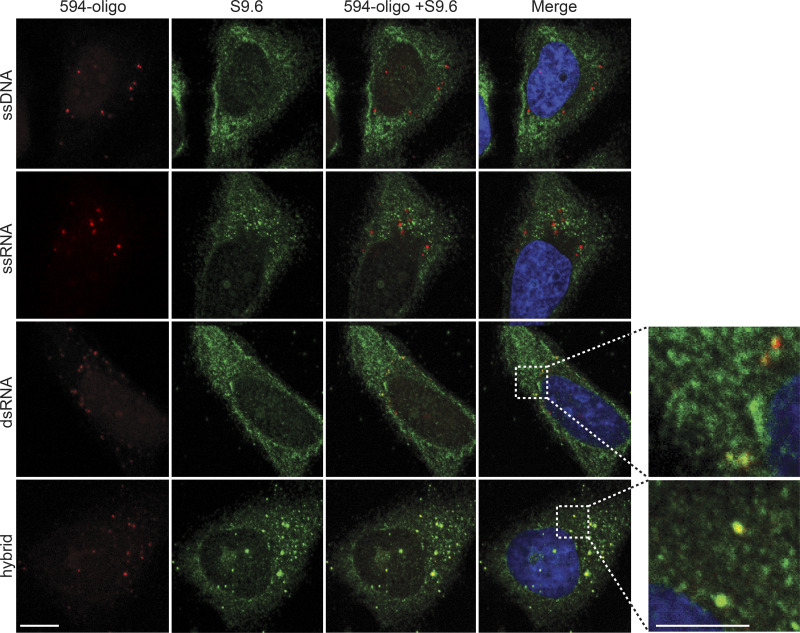
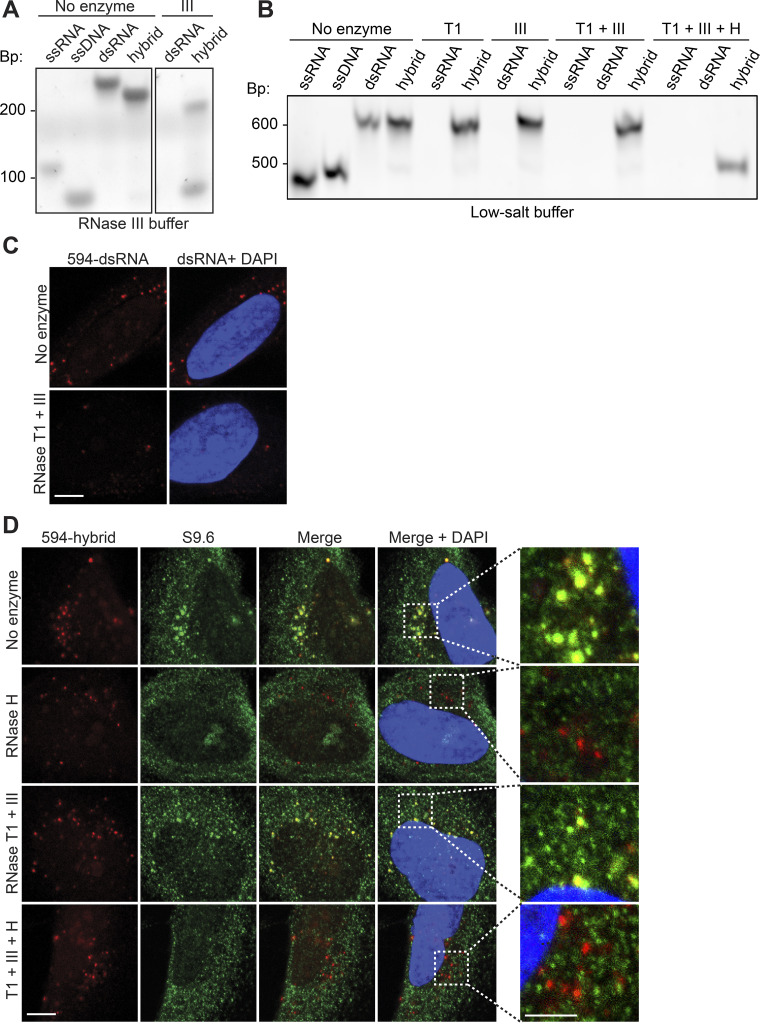
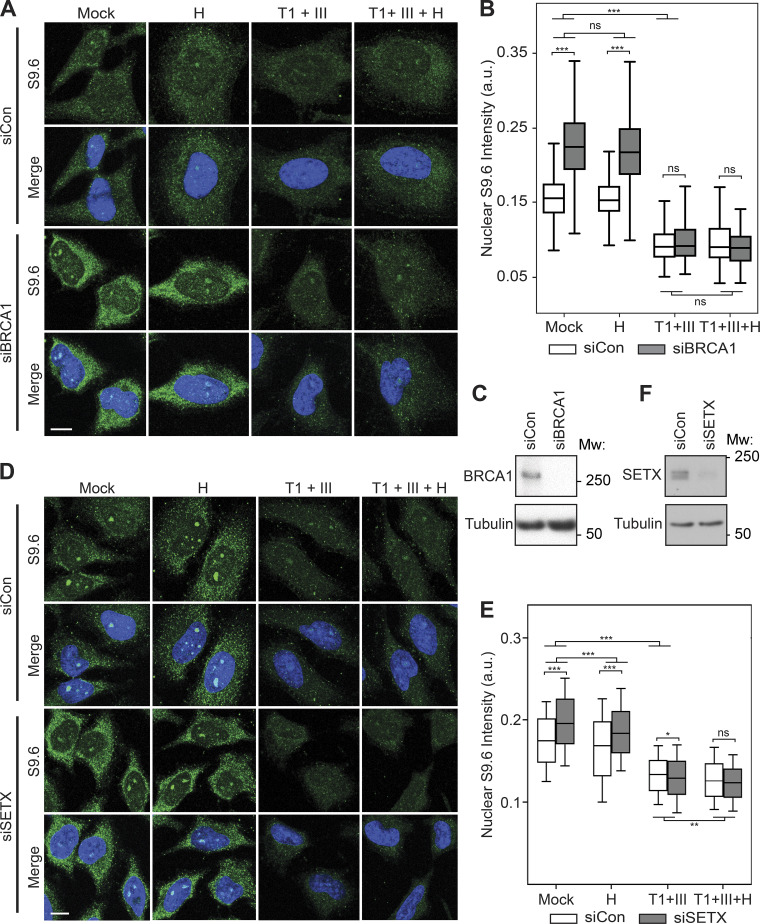
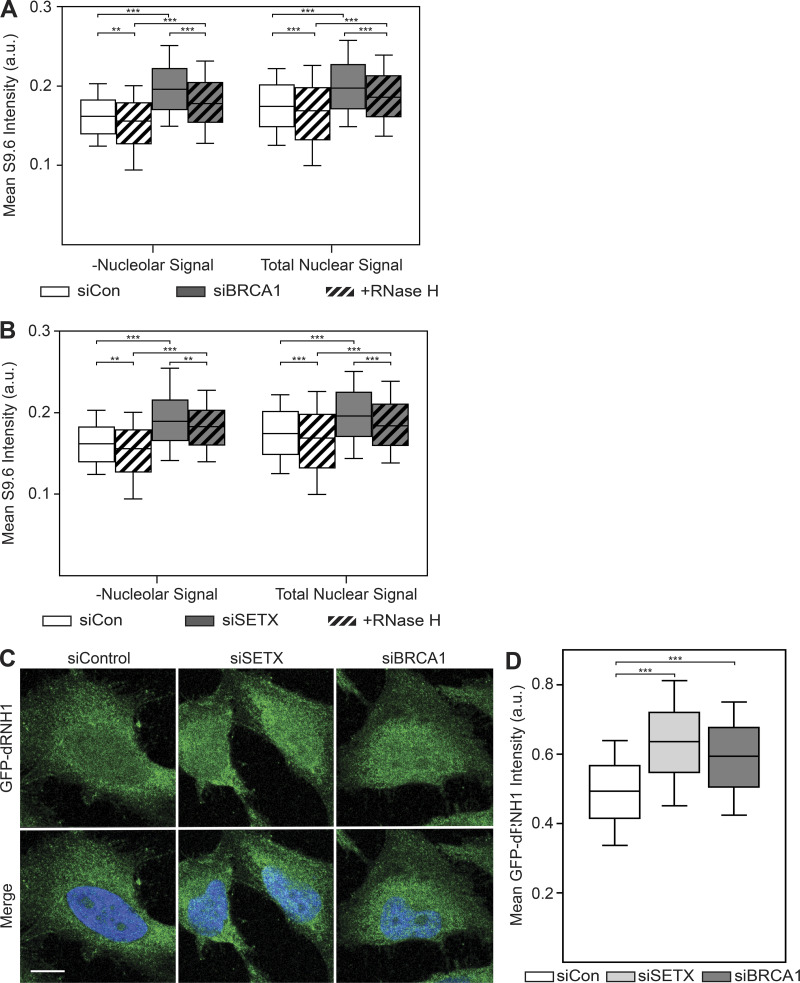
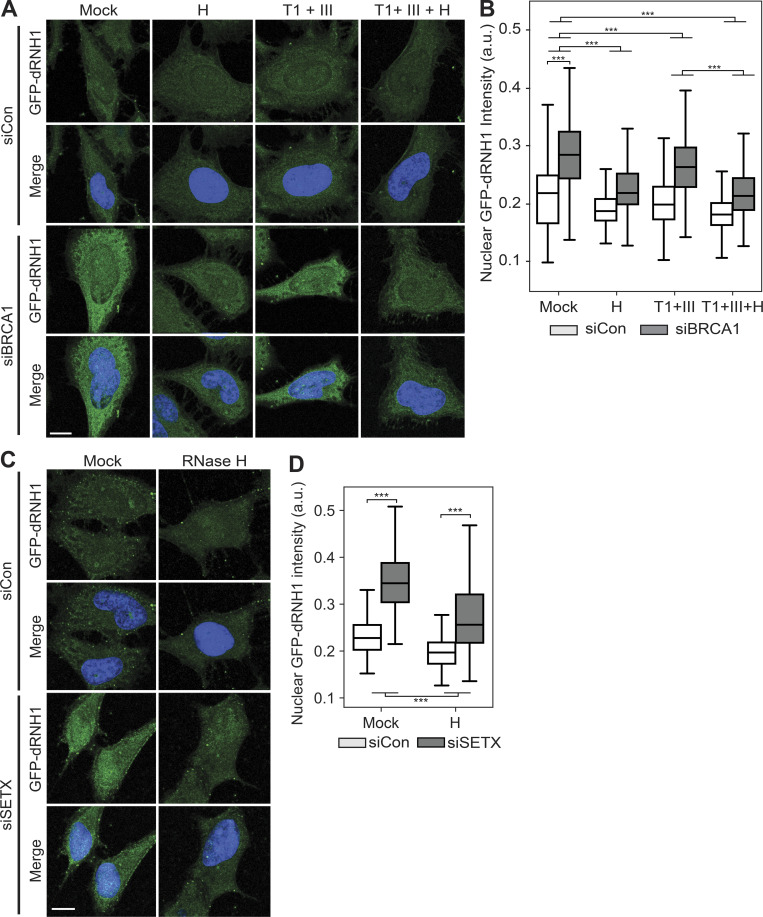
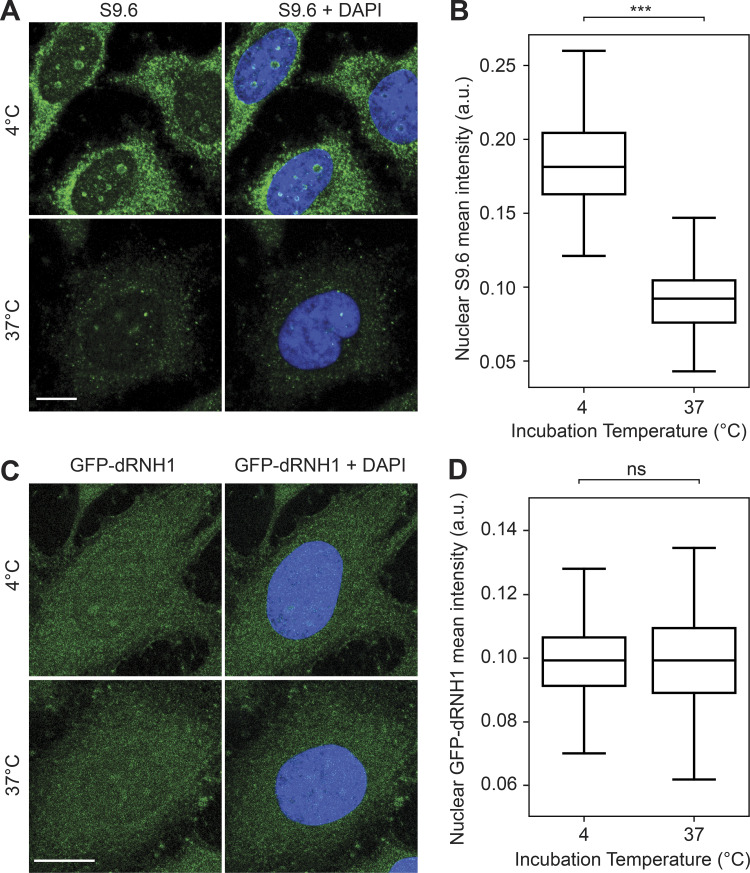
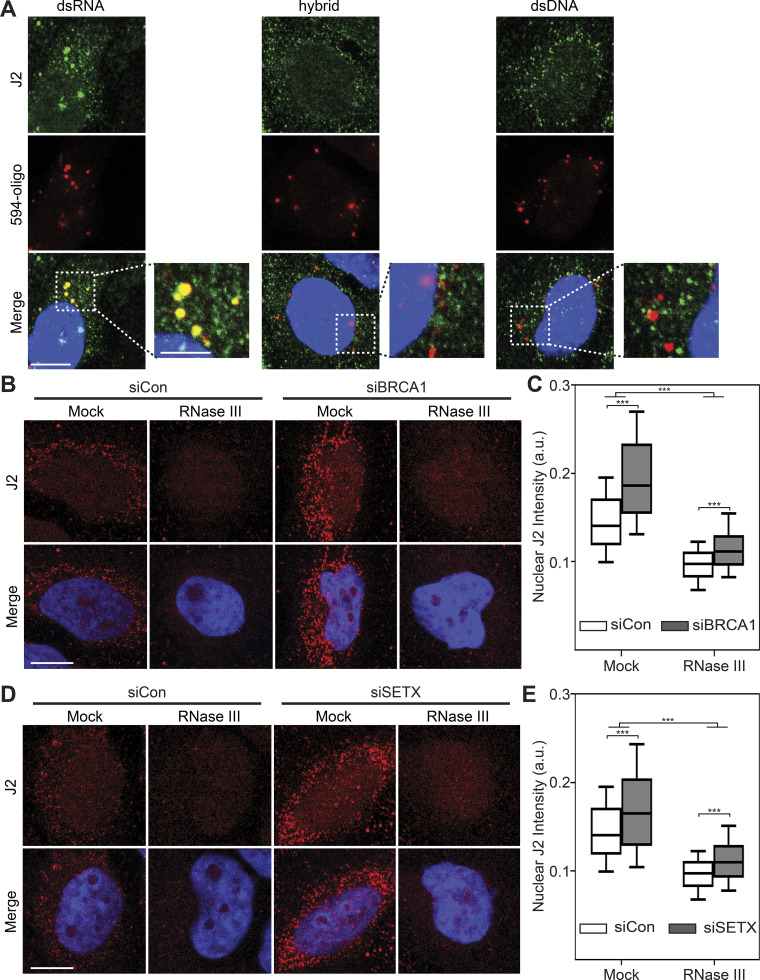
R-loops are three-stranded nucleic acid structures with both physiological and pathological roles in cells. R-loop imaging generally relies on detection of the RNA-DNA hybrid component of these structures using the S9.6 antibody. We show that the use of this antibody for imaging can be problematic because it readily binds to double-stranded RNA (dsRNA) in vitro and in vivo, giving rise to nonspecific signal. In contrast, purified, catalytically inactive human RNase H1 tagged with GFP (GFP-dRNH1) is a more specific reagent for imaging RNA-DNA hybrids. GFP-dRNH1 binds strongly to RNA-DNA hybrids but not to dsRNA oligonucleotides in fixed human cells and is not susceptible to binding endogenous RNA. Furthermore, we demonstrate that purified GFP-dRNH1 can be applied to fixed cells to detect hybrids after their induction, thereby bypassing the need for cell line engineering. GFP-dRNH1 therefore promises to be a versatile tool for imaging and quantifying RNA-DNA hybrids under a wide range of conditions.


Figures

Figure 1.
Figure 1.
Purified GFP-dRNH1 is catalytically inactive and specific for RNA–DNA hybrids in vitro. (A) Schematic illustration of GFP-dRNH1. HBD, hybrid binding domain; HC, hybrid catalytic domain; His, His tag; LR, linker region. (B) Purified GFP-RNaseH1, both GFP-wtRNH1 and GFP-dRNH1, were resolved on a 4–12% Bis-Tris SDS-PAGE gel and stained with Coomassie G-250. Mw, molecular weight in kDa. (C) Products from enzymatic reactions following incubations of oligonucleotide substrates with GFP-wtRNH1 or GFP-dRNH1 were resolved on a polyacrylamide gel and stained with SYBR Gold. Bp, DNA size in base pairs. (D) RNA–DNA hybrids 60 bp in length were labeled with 32P, and 1 nM of labeled substrate was incubated with increasing concentrations of GFP (left), GFP-dRNH1 (middle), or S9.6 antibody (right; 1, 10, 20, 40 nM). The resulting complexes were resolved on a native polyacrylamide gel. Unbound RNA–DNA hybrids are indicated at the bottom of the gel. (E) dsRNA 60 bp in length was labeled with 32P, and 1 nM of substrate was incubated with increasing concentrations of GFP (left), GFP-dRNH1 (middle), or S9.6 antibody (right; 1, 10, 20, 40, 80 nM). The resulting complexes were resolved on a native polyacrylamide gel. Unbound dsRNA is indicated at the bottom of the gel.
Figure S1.
Figure S1.
Purification of GFP-RNH1. GFP-RNH1 was purified by Ni–nitrilotriacetic acid (Ni-NTA) superflow (left), followed by SP sepharose fast flow (right), and 5 μl of the indicated fractions were resolved on a 10% Tris-glycine SDS-PAGE gel and stained with Coomassie G-250 stain. Purification fractions analyzed included L, column load; FT, flow through; 1–7 or 1–12, eluted fractions; and B, leftover beads. The GFP-RNH1 protein is indicated by arrows. Mw, molecular weight in kDa.
Figure 2.
Figure 2.
S9.6 antibody but not GFP-dRNH1 binds to transfected dsRNA in human cells. (A) Representative confocal images showing HeLa cells transfected with ATTO-594 (red)-labeled ssDNA, ssRNA, dsRNA, or RNA–DNA hybrids and stained with S9.6 antibody (green). Inset images are magnified to show overlap of S9.6 signal and ATTO-594 foci. (B) Quantification of mean S9.6 intensities within individual oligonucleotide foci shown in A. (C) Same as in A, but with GFP-dRNH1 staining (green). (D) Quantification of mean GFP-dRNH1 intensities within individual oligonucleotide foci shown in C. (E) Representative confocal images of HeLa cells transfected with ATTO-594 (red) RNA–DNA hybrids and stained with GFP (green). Box plots show median (box central line), 25% and 75% percentiles (box edges), and minimum and maximum values (whiskers). Data are combined from three biological replicates (n = 3), with at least 60 oligonucleotide foci scored per condition per experiment. ***, P ≤ 0.001 by Mann-Whitney U test; ns, P > 0.05. Scale bars are 10 microns; 5 microns for inset images. Inset images are magnified to show overlap of S9.6 or GFP-dRNH1 signal with ATTO-594 foci.
Figure S2.
Figure S2.
Multiple batches of S9.6 antibody bind to transfected RNA–DNA hybrids and dsRNA in human cells. Representative confocal images of HeLa cells transfected with ATTO-594 (red)-labeled ssDNA, ssRNA, dsRNA, or RNA–DNA hybrids, followed by immunostaining with S9.6 antibody sourced from Kerafast (green). Inset images are magnified to show overlap of S9.6 signal and ATTO-594 foci. Scale bar is 10 microns; 5 microns for inset images.
Figure S3.
Figure S3.
Treatment of coverslips with RNases can selectively remove RNA and RNA–DNA hybrids. (A) Products from enzymatic reactions of oligonucleotide substrates with RNase III, incubated in commercially sourced ShortCut RNase III buffer supplemented with manganese. Hybrid, RNA–DNA hybrid. Products were resolved on a polyacrylamide gel and stained with SYBR Gold. (B) Same as in A, but oligonucleotides were digested with RNase T1 (T1); RNase III (III); RNases T1 and III combined (T1+ III); and RNases T1, III, and H combined (T1 + III + H) and incubated in low-salt, magnesium-containing buffer. (C) Representative confocal images of HeLa cells transfected with ATTO-594 (red)-labeled dsRNA. After fixation, coverslips were either mock treated or treated with a combination of RNases T1 and III. (D) Same as in C, but HeLa cells were transfected with ATTO-594 (red)-labeled RNA–DNA hybrids. After fixation, coverslips were treated with the following enzymes: none (No enzyme); RNase H; RNase T1 and RNase III combined (RNase T1 + III); or RNase H, RNase T1, and RNase III combined (T1 + III + H). S9.6 signal is shown in green and DAPI in blue. Scale bars are 10 microns; 5 microns for inset images. Inset images are magnified to show overlap of S9.6 signal and ATTO-594 foci. Bp, DNA size in base pairs.
Figure 3.
Figure 3.
Increased S9.6 immunofluorescent signal upon BRCA1 and SETX depletion is due to binding to dsRNA. (A) Representative confocal images of HeLa cells transfected with control or BRCA1-targeting siRNAs. After fixation, coverslips were treated with the following enzymes: none (Mock); RNase H (H); RNase T1 and RNase III combined (T1 + III); RNase H, RNase T1, and RNase III combined (T1 + III + H). S9.6 signal is shown in green, DAPI in blue. (B) Quantification of mean nuclear S9.6 intensities for the conditions shown in B. Box plots show median (box central line), 25% and 75% percentiles (box edges), and minimum and maximum values (whiskers). (C) Levels of BRCA1 analyzed by Western blotting. Tubulin serves as a loading control. (D) Same as in A, but with transfection of control or SETX-targeting siRNAs. (E) Quantification of mean nuclear S9.6 intensities for the conditions shown in D. Box plots show median (box central line), 25% and 75% percentiles (box edges), and 10% and 90% percentiles (whiskers). (F) Protein levels of SETX as analyzed by Western blotting. Tubulin serves as a loading control. Data are combined from three biological replicates (n = 3), with at least 120 nuclei scored per condition per experiment. *, P ≤ 0.05; **, P ≤ 0.01; ***, P ≤ 0.001 (by Mann-Whitney U test); ns, P > 0.05. Scale bars are 10 microns. Mw, molecular weight in kDa.
Figure S4.
Figure S4.
Exclusion of nucleolar regions does not resensitize S9.6 immunostaining to RNase H treatment, whereas GFP-dRNH1 is compatible with PFA fixation.(A) Quantification of mean nuclear S9.6 signal in control or siBRCA1 cells after excluding the nucleolar regions (left). Total mean nuclear S9.6 signal after BRCA1 depletion (Fig. 3 B) is shown on the right for reference. (B) Same as in A but with SETX depletion. Nucleolar regions were excluded (left), whereas total mean nuclear S9.6 signal after SETX depletion (Fig. 3 E) is shown on the right for reference. (C) Representative confocal images of 4% PFA-fixed HeLa cells. After fixation, coverslips were incubated with GFP-dRNH1. GFP-dRNH1 signal is shown in green and DAPI in blue. (D) Quantification of mean nuclear GFP-dRNH1 intensities for the conditions shown in C. Box plots show median (box central line), 25% and 75% percentiles (box edges), and 10% and 90% percentiles (whiskers). Data are combined from three biological replicates (n = 3), with at least 100 nuclei scored per condition per experiment. **, P ≤ 0.01; ***, P ≤ 0.001 (Mann-Whitney U test). Scale bars are 10 microns.
Figure 4.
Figure 4.
BRCA1 and SETX depletion leads to increases in RNA–DNA hybrids, detectable by GFP-dRNH1. (A) Representative confocal images of HeLa cells transfected with control or BRCA1-targeting siRNAs. After fixation, coverslips were treated with the following enzymes: none (Mock); RNase H (H); RNase T1 and RNase III combined (T1 + III); RNase H, RNase T1, and RNase III combined (T1 + III + H). GFP-dRNH1 signal is shown in green, DAPI in blue. (B) Quantification of mean nuclear GFP-dRNH1 intensities for the conditions shown in A. (C) Same as in A but with transfection of control or SETX-targeting siRNAs. (D) Quantification of mean nuclear GFP-dRNH1 intensities for the conditions shown in C. Box plots show median (box central line), 25% and 75% percentiles (box edges), and minimum and maximum values (whiskers). Data are combined from three biological replicates (n = 3), with at least 80 nuclei scored per condition per experiment. ***, P ≤ 0.001 (Mann-Whitney U test). Scale bars are 10 microns.
Figure S5.
Figure S5.
S9.6 immunostaining is sensitive to incubation temperature. (A) Representative confocal images of methanol-fixed HeLa cells. After fixation, coverslips were incubated in PBS and kept at 4°C or 37°C overnight, followed by S9.6 immunostaining. S9.6 signal is shown in green and DAPI in blue. (B) Quantification of mean nuclear S9.6 intensities for the conditions shown in A. (C) Same as in A but for GFP-dRNH1 staining. (D) Same as for B but for GFP-RNH1 staining. Scale bars are 10 microns. Box plots show median (box central line), 25% and 75% percentiles (box edges), and minimum and maximum values (whiskers). Data are combined from two biological replicates (n = 2), with at least 45 nuclei scored per condition per experiment. ***, P ≤ 0.001 (Mann-Whitney U test); ns, P > 0.05.
Figure 5.
Figure 5.
Loss of BRCA1 and SETX increases cellular dsRNA. (A) Representative confocal images showing HeLa cells transfected with ATTO-594 (red)-labeled dsRNA or RNA–DNA hybrids and stained with the J2 antibody (green). Inset images are magnified to show overlap of J2 signal and ATTO-594 foci. (B) Representative confocal images of HeLa cells transfected with control or BRCA1-targeting siRNAs. After fixation, coverslips were either mock treated or treated with RNase III. J2 signal is shown in red, DAPI in blue. (C) Quantification of mean nuclear J2 intensities shown in B. (D) Same as in B but following SETX depletion. (E) Quantification of mean nuclear J2 intensities shown in D. All box plots show median (box central line), 25% and 75% percentiles (box edges), and 10% and 90% percentiles (whiskers). Data are combined from three biological replicates (n = 3), with at least 75 nuclei scored per condition per experiment. ***, P ≤ 0.001 (by Mann-Whitney U test); ns, P > 0.05. Scale bar is 10 microns; 5 microns for inset images.

References

    1. Barroso, S., Herrera-Moyano E., Muñoz S., García-Rubio M., Gómez-González B., and Aguilera A.. 2019. The DNA damage response acts as a safeguard against harmful DNA–RNA hybrids of different origins. EMBO Rep. 20:e47250. 10.15252/embr.201847250 - DOI - PMC - PubMed
    1. Bhatia, V., Barroso S.I., García-Rubio M.L., Tumini E., Herrera-Moyano E., and Aguilera A.. 2014. BRCA2 prevents R-loop accumulation and associates with TREX-2 mRNA export factor PCID2. Nature. 511:362–365. 10.1038/nature13374 - DOI - PubMed
    1. Boguslawski, S.J., Smith D.E., Michalak M.A., Mickelson K.E., Yehle C.O., Patterson W.L., and Carrico R.J.. 1986. Characterization of monoclonal antibody to DNA⋅RNA and its application to immunodetection of hybrids. J. Immunol. Methods. 89:123–130. 10.1016/0022-1759(86)90040-2 - DOI - PubMed
    1. Castellano-Pozo, M., García-Muse T., and Aguilera A.. 2012. R-loops cause replication impairment and genome instability during meiosis. EMBO Rep. 13:923–929. 10.1038/embor.2012.119 - DOI - PMC - PubMed
    1. Cerritelli, S.M., and Crouch R.J.. 2009. Ribonuclease H: the enzymes in eukaryotes. FEBS J. 276:1494–1505. 10.1111/j.1742-4658.2009.06908.x - DOI - PMC - PubMed

Publication types

MeSH terms