Review
. 2022 Apr 27;122(8):7647-7689.
doi: 10.1021/acs.chemrev.1c00223. Epub 2021 Jul 7.

In-Cell Labeling and Mass Spectrometry for Systems-Level Structural Biology

Affiliations
Review

In-Cell Labeling and Mass Spectrometry for Systems-Level Structural Biology

Juan D Chavez et al. Chem Rev. .

Abstract

Biological systems have evolved to utilize proteins to accomplish nearly all functional roles needed to sustain life. A majority of biological functions occur within the crowded environment inside cells and subcellular compartments where proteins exist in a densely packed complex network of protein-protein interactions. The structural biology field has experienced a renaissance with recent advances in crystallography, NMR, and CryoEM that now produce stunning models of large and complex structures previously unimaginable. Nevertheless, measurements of such structural detail within cellular environments remain elusive. This review will highlight how advances in mass spectrometry, chemical labeling, and informatics capabilities are merging to provide structural insights on proteins, complexes, and networks that exist inside cells. Because of the molecular detection specificity provided by mass spectrometry and proteomics, these approaches provide systems-level information that not only benefits from conventional structural analysis, but also is highly complementary. Although far from comprehensive in their current form, these approaches are currently providing systems structural biology information that can uniquely reveal how conformations and interactions involving many proteins change inside cells with perturbations such as disease, drug treatment, or phenotypic differences. With continued advancements and more widespread adaptation, systems structural biology based on in-cell labeling and mass spectrometry will provide an even greater wealth of structural knowledge.


Figures

Figure 1.
Figure 1.
The schematic illustration of (A) protein painting and (B) covalent protein painting. A (A) dye or a (B) reagent for covalent labeling is added to the protein sample to interact with solvent accessible regions. After protein denaturation, only protein interfaces without any label are enzimaticly digested. (B) An adittional paiting step is used to chemically label non-labeled peptides. (A,B) Peptides are further detected by LC-MS/MS.
Figure 2.
Figure 2.
Schematic illustration of a bottom-up HDX workflow. Green and red dots in the protein structure indicate hydrogen and deuterium atoms in the peptide bonds, respectively. Reproduced with permission from Liu et al., 2020. Copyright 2020 American Chemical Society.
Figure 3.
Figure 3.
Schematic illustration of FPOP setup. Reproduced with permission from Liu et al, 2020. Copyright 2020 American Chemical Society.
Figure 4.
Figure 4.
In-cell HDX-MS scheme. Schematic representation of the in-cell HDX-MS strategy. Live Escherichia coli overexpressing the NTD of the spridrion are suspended in deuterated PBS. At each time-point, the exchange is quenched by addition of 10% formic acid, the cells are lysed by sonication, and the soluble fraction is isolated by centrifugation and subjected to direct MS analysis. Reproduced with permission from Kaldmae et al., 2020. Copyright 2019 John Wiley & Sons, Inc.
Figure 5.
Figure 5.
In vivo FPOP workflow. Worms are grown to the fourth larvae stage (L4) on nematode growth media plates. For IV-FPOP, worms are flowed through a 250 μm fused silica capillary in the presence of H2O2, and radicals are generated using a 248 nm wavelength excimer laser. Immediately after irradiation, excess H2O2 and radicals are quenched, worms are lysed, the protein extract is digested and prepared for mass spectrometry analysis, and the extent of FPOP modifications is calculated for proteins of interest. Reproduced with permission from Espino & Jones, 2019. Copyright 2019 American Chemical Society.
Figure 6.
Figure 6.
Experimental overview of proximity labeling. A proximity labeling (PL) enzyme is expressed in a desired subcellular compartment producing a cloud (depicted by red clouds) of reactive biotin which extends approximately 20 nm from the PL enzyme covalently bonding to nearby proteins. Enrichment of biotinylated molecules can be performed on the protein level (most common) as shown by the top pathway, or at the peptide level after proteolytic digestion of PL labeled proteins as illustrated by the bottom pathway.
Figure 7.
Figure 7.
Mapping of biotinylation sites with PL. (A) Biotinylated proteins identified by BioSITe were grouped by the degree of biotinylation. (B) 3D models of representative proteins identified in the study. GRB2 and CRK are homology models based on their human homologues (PDB ID 1GRI and 2EYZ, respectively), while the structure of STAT5A was taken from PDB ID 1Y1U. The other domain structures from each protein were modeled using their human homologues from PDB. Lysine residues that are biotinylated upon interaction with BirA*-BCR-ABL are highlighted as red sticks and labeled with their position. The biotinylated lysine residues are colored in red and the functional domains are indicated (CC, coiled coil; ROC, Ras of complex proteins; PH, pleckstrin homology; SH3, Src-homology 3; SH2, Src-homology 2; PID, phosphotyrosine interaction domain; DBD, DNA-binding domain). Reproduced with permission from Kim et al., 2018 Copyright 2017 Americal Chemical Society.
Figure 8.
Figure 8.
Genetically Encoded Photo-Crosslinkers in Living Cells and Photogenerated Reactive Intermediates under UV Light Activation. (A) Genetically encoded nonspecific photo-crosslinkers react with any nearby residue. (B) Genetically encoded site-selective photo-crosslinker reacts with carboxyl sidechain groups. (C) Genetically encoded photo-crosslinker in protein of interest (POI) selectively reacts with proximal lysine for capture of protein-protein interactions, producing predictable crosslinked peptides, facilitating MS analysis, and validation of post-translational modification (PTM) site of the substrate. Reproduced with permission from Hu et al. 2019 Copyright 2019 Elsevier Inc.
Figure 9.
Figure 9.
Flowchart diagram of how the ReACT algorithm functions during LC-MSn experiments. Used with permission from Weisbrod et al., 2013. Copyright 2013 American Chemical Society.
Figure 10.
Figure 10.
Error estimation for classes of cross-linked peptide pairs. a) Plot of E-value versus number of PSMs identifying all cross-linked peptide pairs. Target assignments (both peptides are target) are indicated by the blue trace while decoy assignments (either or both peptides are decoy) are indicated by the red trace. The same color scheme is used in all panels. The applied E-value threshold of 0.2 is indicated by a vertical black dashed line. FDR is calculated as the sum of decoy assignments divided by the sum of target assignments. b) Plot of E-value versus number of PSMs identifying intra-protein cross-linked peptide pairs. The lower partition of the plot is a y-axis zoom view to visualize the decoy trace. c) Plot of E-value versus number of PSMs identifying inter-protein cross-linked peptide pairs. The lower partition of the plot is a y-axis zoom view to visualize the decoy trace. d) Plot of E-value versus number of PSMs identifying homo-dimer cross-linked peptide pairs. Coloring is the same as in “a”. Reproduced with permission from Chavez et al., 2018. Copyright 2017 Elsevier Inc.
Figure 11.
Figure 11.
Overview of XLinkDB features for analysis and visualization of XL-MS data. Publically available at xlinkdb.gs.washington.edu.
Figure 12.
Figure 12.
IGX-MS-driven refined structural model of monomeric C6 (A) IGX-MS-driven homology model of monomeric free C6 depicted in two different orientations. Black dots indicate the few missing amino acids (residue 591–619, spanning about 81 Å) covering the linker region between the main body and C5b-binding region. (B) Superpositioning of C6 IGX-MS-driven model (purple and green surface) and C6 X-ray structure (orange and blue surface; PDB ID: 3T5O). Black dots indicate the few missing amino acids (residue 591–619) covering the linker region between the main body and C5b-binding region. (C) Contact maps with cross-linked residues (orange dots) of C6 X-ray structure (PDB ID: 3T5O, left panel) and IGX-MS-driven C6 model (right panel). The colored density represents a contact relationship smaller than 40 Å of individual residues. White density represents a contact relationship bigger than 40 Å of individual residues. (D) Distribution of lysine Cα–Cα distances of unique cross-links identified by IGX-MS for monomeric C6 when plotted on the reported X-ray structure (pink bars, PDB ID: 3T5O) and the IGX-MS-driven refined structural model (green bars). Reproduced with permission from Hevler et al., 2021. Copyright 2021 The Authors.
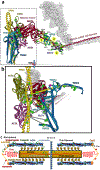
Figure 13.
Figure 13.. Interdependence of protein abundance and cross-linker concentration on cross-link formation in vitro.
(A) Equal amounts of purified 60S ribosomal particles from S. cerevisiae were mixed with increasing amounts of BSA (ranging from a 1 to 1 mixture (μg/ μg) up to a 50-fold excess of BSA) and cross-linked at a concentration of 1 mM BS3. After quenching of the reactions, the cross-linked ribosomes were separated again from the BSA by ultracentrifugation using sucrose cushion and prior to analysis by LC MS/MS. (B) Detected unique cross-linking sites within the 60S ribosomal subunit (intermolecular and intramolecular) within these samples and (C) after addition of excess cross-linker to the 50-fold excess BSA sample—4× BS3; 16× BS3; 80× BS3. Reproduced with permission from Fürsch et al., 2020. Copyright 2020 American Chemical Society.
Figure 14.
Figure 14.. Cross-linked peptide data compared with absolute protein abundance.
(A) Distribution of cross-linked proteins mapped to absolute abundance levels. (B) Cumulative protein abundance rank level for cross-linked proteins. Ninety percent of the cross-linked proteins were in the top 3263 most abundant proteins as measured by Kulak et al.. Reproduced with permission from Chavez et al., 2016. Copyright 2016 Elsevier Ltd.
Figure 15.
Figure 15.
PRM experimental outline. (A) Biological samples are prepared for qXL-MS comparing two or more conditions. The samples are treated with chemical cross-linker either as (1) a mixed sample if SILAC labeling was used or (2) as separate samples if carrying out a label free experiment or using isotopically labeled cross-linkers. Following the cross-linking reaction proteins are extracted, enzymatically digested, and subjected to various strategies (i.e. strong cation exchange and affinity chromatography) for enrichment of cross-linked peptide pairs. (B) LC-MS analysis of samples enriched for cross-linked peptide pairs is carried out. This consists of reversed phase chromatographic separation by LC followed by analysis by MS. The mass spectrometer is operated in PRM mode where an inclusion list of m/z values for the precursor ions of interest is used to target specific cross-linked peptides. The PRM mass spectrometric analysis used here consists of three steps including isolation of precursor ions, fragmentation by collision with neutral gasses, and detection of mass to charge ratios of the resulting fragment ions. (C) Resulting MS2 data are converted into transition lists and imported into Skyline for analysis. Reproduced from Chavez et al., 2016 . No copyright.
Figure 16.
Figure 16.
Quantification of BSA cross-linked peptide pairs with Skyline. (A) MS2 spectrum for the cross-linked peptide pair linking residues K235-K28 (ALK235AWSVAR_DTHK28SEIAHR), obtained from a 500 ng injection of cross-linked BSA digest. (B) Extracted ion chromatograms for the PRM transitions observed for the cross-linked peptide pair in A. C. Skyline generated bar plot illustrating the normalized peak areas for the cross-linked peptide pair linking K28-K235. Peak areas are shown for triplicate analyses of varying injection amounts (100, 200, 500, and 1000 ng cross-linked BSA digest). Bars are color coded to indicate the contribution of each individual transition to the total peak area and match the color scheme in panel B. Reproduced from Chavez et al., 2016 . No copyright.
Figure 17.
Figure 17.
Example fragmentation spectrum of an iqPIR cross-linked peptide pair. MS2 spectrum of the iqPIR cross-linked peptide pair linking lysine residues 207–226 of ADH1_YEAST using 1:1 ratio mixture of RH/SH cross-linked samples. The PDB structure 4w6z is shown as a ribbon structure colored red from the N-terminus to blue at the C-terminus with the cross-linked Lys shown as green space filled residues. Insets show expanded views of selected fragment ions, illustrating the isotopic differences which are used for quantification. For fragment ions differing by two 13C, the observed signal is shown in blue while the deconvoluted signal from the RH and SH are shown in red and orange, respectively. The reporter ion signal differs by four 13C, requiring no deconvolution, and follows the red/orange color scheme. Reproduced from Chavez et al., 2020. Copyright 2020 American Chemical Society.
Figure 18.
Figure 18.
OmpA dimeric model and mass spectra of the homodimer cross-linking relationship. (A) Precursor scan showing the homodimer cross-linked complex. Inset: isotopic distribution of the parent ion. (B) ISCID scan showing the reporter and the released peptide. (C) MS/MS spectrum of the OmpA released peptide with the sequence and assignment of fragments. (D) OmpA monomer model. Red: Lysine 213;Yellow: Lysine 294; Orange: Lysine 338.E, A dimeric structural model from docking results (viewing angle: top-down).Red: Lysine 213; Yellow: Lysine 294; Orange: Lysine 338. The distances between each lysine are labeled in red. Reproduced with permission from Zheng et al., 2011. Copyright 2011 The American Society for Biochemistry and Molecular Biology, Inc.
Figure 19.
Figure 19.
In-cell XL-MS studies with the gram negative bacteria Shewanella oneidensis MR-1 resulted in identification of the interaction between the two decaheme-containing proteins OmcA and MtrC,. (A) Cross-linked site-directed docking of structures for these two proteins (PDB: 4LM8, 4LMH) enabled structure prediction for this interaction. (B) Examination of heme groups within these two proteins indicated that solvent exposed heme groups appear proximal in the docked structure. (C) and (D) illustrate the relative orientation of heme groups in MtrC (pink) and OmcA (green) in the docked structure and suggest that this interaction could serve to branch the electron transfer chain at MtrC C7 to OmcA C10 and further increase capacitance and/or electron transfer to extracellular acceptors. Recent structural characterization of the Mtr complex, including MtrA, MtrB and MtrC (PDB: 6R2Q). (E) is consistent with the MtrC-OmcA model above which could serve to further branch this electron transfer network. Panel (E) reproduced with permission from Edwards et al., 2020. Copyright 2020 Elsevier Inc.
Figure 20.
Figure 20.
In-cell XL-MS analysis of the gram negative nosocomial pathogen Acinetobacter baumannii AB-5075 revealed the presence of evolved complexes to promote enhanced toxin resistance. (A) Oxa-23 was identified cross-linked to a series of outer membrane porin proteins, including OmpW, OmpA, CarO and an uncharacterized protein predicted to exist as a beta barrel, AB_2898. (B) In all cases, Oxa-23 K60 was identified linked to beta barrel lysine sites that exist at the periplasmic surface of the structure, as shown for the carbapenem resistant porin CarO and (C) other porins. (D) Proposed model of “porin localized toxin inactivation” that concentrates protective enzymes at periplasmic entry ports where intended substrate concentrations are maximized to improve enzymatic conversion. In the case of Oxa-23, cross-linked site directed docking with CarO and other porins resulted in orientation of Oxa-23 that positions the catalytic site and a surface channel to optimally direct substrates from the porin toward the catalytic site. (A-C reproduced from with permission from Wu et al. , 2016). Copyright 2016 Springer.
Figure 21.
Figure 21.
Conserved lysine site linkage between the two β-lactamase enzymes (PDB: 4JF4, 3V3R) and the OmpA C-terminal domain (PDB: 3TD3). (A) Oxa23 K60 and blaGES-11 K25 are both cross-linked to OmpA K252; (B) Oxa23 K145 and blaGES-11 K149 are both cross-linked to OmpA K252 and OmpA K319; (C) blaGES-11 K88 is cross-linked to OmpA K252, K288, K317, and this same OmpA linkage was observed with K102/K104 of Oxa23. The OmpA N-terminal structure model (a.a. 23-191, Uniprot ID: W6RU67) was generated by Phyre2 using the intensive modeling mode. The residues for noncovalent interaction with peptidoglycan in the OmpA CTD domain, Asp268, Arg283, Ala284, are highlighted in orange. Reproduced with permission from Zhong et al.,2020. Copyright 2019 American Chemical Society.
Figure 22.
Figure 22.
Ribbon structure of the E. coli ATP synthase F1/F0 with identified cross-links (red dashes). The left insert is a zoomed view of the cross-linked peptide between the α (gold) and b (dark blue) subunits. The right insert is a zoomed view of the cross-linked peptide between the α (gold) and δ (turquoise) subunits. Reproduced with permission from Rey et al., 2021. Copyright 2021 The Authors.
Figure 23.
Figure 23.
Determination of supercomplex structures from functional mitochondria. (A) Supercomplex model from rigid body docking (59) of complex I (NDUA2, NDUA4) and complex III (QCR2, QCR6) using cross-linked peptide distance constraints (NDUA2–QCR2; NDUA4–QCR6). Complex I is shown in pink, and complex III is shown in blue. Ribbon models of intercomplex cross-linked proteins are shown within the surface model in the left panel, and the distance constraints used are displayed as gray lines. (B) Workflow for the comparison of a recently published CryoEM structure (PDB ID code: 5J8K) (21) and the XL-MS–based supercomplex model. The XL-MS–based model was generated without prior knowledge of the CryoEM model. (C) Comparison of the in situ XL-MS docked supercomplex with the CryoEM supercomplex model (PDB ID code: 5J8K). Structures were aligned based on complex I. Complex I rmsd = 1.3 Å; complex III rmsd = 2.4 Å. Reproduced with permission from Schweppe et al., 2017. Copyright 2017 National Academy of Sciences.
Figure 24.
Figure 24.
Rotational states of ATP synthase captured by XL-MS. (A) The Phyre2 model of ATP8 (red) was superimposed on a helix assigned to ATP8 (yellow) in CryoEM–derived structures (55) of ATP synthase in rotational state 3 (PDB ID code: 5LQX) and rotational state 1 (PDB ID code: 5LQZ). Cross-linked sites (green space-filled residues) between APT8 (K46 and K48) and ATPD (K136) are compatible with state 3, whereas the cross-link between ATP8 (K48) and ATP5E (K50) is compatible only with state 1. Cross-linked sites involving ATP8 and six other ATP synthase subunits are indicated in the subnetwork and are displayed on a structure in (B). Reproduced with permission from Schweppe et al., 2017. Copyright 2017 National Academy of Sciences.
Figure 25.
Figure 25.
Interaction network in human mitochondria. White circles represent proteins for which PPI-links were identified, and lines illustrate these interactions. Thickness of line scales with the number of PPI-links for each interaction. Lines are dashed when only one cross-link was detected. Lines are colored according to interactions found in STRING or BioGrid database (black) or not (red). Additional blue lines indicate that this particular protein–protein interaction was also identified by Schweppe et al. and/or Liu et al. The most dense interaction network in human mitochondria was observed in oxidative phosphorylation complexes, mitochondrial heat shock proteins, and prohibitin. OMM: outer mitochondrial membrane, IMS: intermembrane space, and IMM: inner mitochondrial membrane. Reproduced with permission from Ryl el al.,2020. Copyright 2019 American Chemical Society.
Figure 26.
Figure 26.
SDS-page analysis comparing the protein profile of nuclear fractions derived from intact cells cross-linked with DSSO or derived from intact nuclei cross-linked with DSSO. The labeling of nuclear proteins is more efficient when DSSO is added to isolated nuclei. Reproduced with permission from Fasci et al., 2018. Copyright 2018 The Authors.
Figure 27.
Figure 27.
Cross-linking mass spectrometry (XL-MS) based strategy to investigate assemblies and interactions of nuclear proteins. (A)The MS-cleavable cross-linker DSSO diffuses inside the cell nucleus, possibly through the nuclear pore complex, facilitating efficient cross-linking of the nuclear proteins. (B) U2OS nuclei were isolated and cross-linked. After detergent fractionation, the proteome is digested and the cross-linked peptides are enriched by using strong cation exchange chromatography. The cross-linked peptides are analyzed by LC MS/MS, and by making use of the cleavable cross-linker efficiently identified using the XlinkX PD nodes. (C) Pie chart indicating the total number of unique cross-links at an FDR of 1%. Unique intralinks are unique cross-links between peptides derived from the same protein/gene. Unique interlinks connect peptides from distinguishable proteins/genes. The bar charts indicate the nuclear cross-links identified in the TX100 insoluble and soluble fraction. (D) The top panel displays a Venn diagram indicating the overlap between unique cross-links identified in the independent biological replicates of the fractionated and unfractionated nuclei samples. The bar chart below indicates the PPIs reproducibly identified in both these XL-MS datasets. In dark brown are indicated the PPIs annotated in the IntAct and/or in the CORUM databases. Reproduced with permission from Fasci et al., 2018. Copyright 2018 The Authors.
Figure 28.
Figure 28.
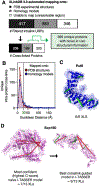
Protein intralinks mapped onto known structures are typically within distance constraints. For proteins of no known structure, intralinks can be used to refine structural models. (A) XlinkDB analysis showing the number of unique “filtered unambiguous” intralinks mapped onto structures in the PDB, onto homology models or that could not be mapped. Four of the 1,150 intralink URPs were not considered by XlinkDB 3.0. (B) The Euclidean distances of intralinks that could be mapped onto PDB structures or XlinkDB models. (C) A refined I-TASSER model for protein PUF6, showing that 6 out of 6 intralinks were within the 30 Å distance constraint. (D) Naïve (left) and then cross-link-refined (right) I-TASSER models for protein SCP160. In each case, the model represents that of highest confidence. Use of intralinks led to a change in predicted structure; this may be because cross-links reflect two in vivo conformations of the protein. Reproduced with permission from Bartolec et al., 2020 . Copyright 2019 American Chemical Society.
Figure 29.
Figure 29.
Interactome of proteins of enriched yeast nuclei, and detailed cross-link data for RNA polymerase and nucleolar ribosome biogenesis complexes. (A) High confidence, filtered protein–protein interaction network highlighting some major complexes (proteasome, RNA polymerase, histones, nucleolar/ribosomal biogenesis, nucleoporin). (B) Intra- and interprotein cross-links found for RNA polymerase I. Proteins are color-coded. For (A) and (B), inter-protein cross-links are black if present in Interactome3D or APID databases, or red if novel. Reproduced with permission from Bartolec et al., 2020. Copyright 2019 American Chemical Society.
Figure 30.
Figure 30.
Protein interactions in the V-ATPase complex. (A) Proteins are shown as colored bars. The length of the bars corresponds to the protein length. Cross-links identified within (grey) or between (blue and grey) ATPase subunits are shown in an interaction network. Inter-molecular cross-links identified in one (grey) or at least two (blue) biological replicates are shown. (B) 74 out of 78 observed cross-links could be mapped onto the available high-resolution structure of the V-ATPase complex from rat brain (PDB ID 6VQ6). Cross-linking distances and the number of cross-links obtained from at least one biological replicate that satisfy these distances are plotted in a histogram. 50 cross-linked amino acid residues showed distances <30 Ȧ (blue). Long-distance cross-links (red) were mostly observed in flexible protein subunits. Note that cross-links of subunits that are present in multiple copies are only mapped once. Reproduced from Wittig et al., 2021. Copyright 2020 Springer.
Figure 31.
Figure 31.
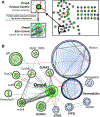
Depth of Interspecies and OmpA-Specific Intercellular Interactions. (A) Force-directed network of the interspecies protein interactions identified between A. baumannii and human proteins. Insets depict how multiple site-to-site cross-link interactions underlie each PPI. Interspecies cross-links are shown in red. (B) Site-to-site interactions for all proteins (bacterial and human) interacting with OmpA in the cell infection model. Nodes are individual lysine sites identified in cross-linked relationships between human (blue nodes) and bacterial (green nodes) proteins. Interspecies links are shown in red. Reproduced with permission from Schweppe et al., 2015. Copyright 2015 Elsevier Ltd.
Figure 32.
Figure 32.
XL-MS guided modeling of the OmpA-desmoplakin interaction. (A) TOP: OmpA CTD (green ribbon) co-crystal structure with peptidoglycan mimetic DAP peptide (gray) and lysine sites observed linked to human DSP (yellow). BOTTOM: Space filled structure rotated by 90° to reveal DAP binding pocket and groove (highlighted by dashed red line). (B) TOP: OmpA CTD BOTTOM: DSP plakin repeat C, cross-linked lysine sites in yellow. (C) Systems structural biology model of OmpA-DSP interface based on in vivo cross-linking data. (D) Interface close up illustrating how DSP R2759 in the docked model forms a salt bridge with OmpA D271, a residue critical for both OmpA-peptidoglycan binding and adhesion to lung epithelial cells.
Figure 33.
Figure 33.
17-AAG has a higher binding affinity to Hsp90 from tumor cells than normal cells or purified Hsp90 protein. 17-AAG (a) or ATP (b) has a higher binding affinity to Hsp90 from BT474 tumor cells than normal cells (NDF and RPTEC) and purified Hsp90. c, Apparent binding affinity of 17-AAG to Hsp90 from a panel of tumor and normal cells. Individual values of IC50 (circles) and the mean ± standard error of the mean (line with error bars) is shown. d, Correlation of the binding affinity of 17-AAG to Hsp90 to the cytotoxicity in different cells. Reproduced with permission from Kamal et al., 2003. Copyright 2003 Nature Publishing Group.
Figure 34.
Figure 34.
Homology model of Hsp90B. (A) Phyre2-generated homology model of HS90B representing an open extended conformation with minimal interaction between the NTD and MD. The NTD, MD, and CTD are indicated in cyan, red, and gray, respectively. Cross-linked residues are labeled and connected by red dashed lines. (B) Homology-based model of HS90B using a compact conformation of E. coli HtpG as a template. Reproduced with permission from Chavez et al.. Copyright 2016 Elsevier Ltd.
Figure 35.
Figure 35.
Comparison between in vitro vs in vivo effects of 17-AAG on Hsp90B. (A) Venn diagram of HS90B cross-linked peptide pairs from in vitro cross-linking versus in vivo cross-linking experiments. (B) Domain-level cross-link maps for Hsp90B, generated with XiNET, showing cross-links found by in vivo cross-linking, found both in vivo and in vitro, and those found only from in vitro cross-linking, respectively. (C) Comparison of the effects of 500 nM 17-AAG treatment on cells, or isolated HS90B, on the levels of the indicated Hsp90B cross-links. Cartoon representations of HS90B conformations (including dimerization, closing of the ATP binding pocket lid, and NTD-MD interaction) corresponding with selected cross-linked peptides are shown below the bar chart. Reproduced with permission from Chavez et al.. Copyright 2016 Elsevier Ltd.
Figure 36.
Figure 36.
Correlation between DNA topoisomerase A2 crosslink and activity levels. (A) Coomassie stained one-dimensional SDS–PAGE of drug-sensitive (S) and -resistant (R) full cell lysates and western blot for TOP2A. Quantitative measurements for TOP2A obtained by western blot (n=6) and global SILAC (n=6) are in excellent agreement and indicate similar expression levels of TOP2A in the sensitive and resistant cells. (B) High-resolution MS2 spectrum indicating the m/z values for the released peptide ions and the reporter ion with MS1 insert illustrating the 4+ precursor ion. (C) PIR mass relationship indicating the high mass accuracy measurement of the precursor ion and released peptides in A with a mass error of 1.1 p.p.m. (D) Extracted ion chromatograms for the MS1 signal from the precursor ions from the resistant cells (m/z 767.89495) and sensitive cells (m/z 774.912). Increased levels (log2(Resistant/Sensitive; R/S)=1.84) of this crosslinked peptide pair were measured in the MDR cell line. (E) The crosslink observed between K489 and K789 spans the DNA-binding gate mapped onto PDB structure 4FM9. (F) Western blot analysis of the immunoprecipitation of TOP2A with and without crosslinking from drug-sensitive (S) and -resistant (R) cell lines. The addition of crosslinking resulted in diminished TOP2A signal from the resistant sample. (G) TOP2A DNA decatentation activity is increased in nuclear extracts from the drug-resistant cell line (log2(R/S)=1.3). Error bars represent s.d. (0.33) from six replicate reactions from three independent nuclear extract preparations. (H) Western blot analysis of TOP2A from nuclear extracts from drug-sensitive (S) and -resistant (R) cell lines. Reproduced with permission from Chavez et al., 2015 . Copyright 2015 Macmillan Publishers Limited.
Figure 37.
Figure 37.
PTX-induced conformational change in the ATP synthase complex (CV). (A) Line graph illustrating relative cross-linked peptide pair and global protein abundance levels displayed as log2(PTX/DMSO) values on the y axis and PTX concentration on the x axis for CV subunits. Plotted cross-links are as follows: ATPA K427-ATPB K522 (light blue), ATPB K485-ATPA K506 (green), ATPB K485-K225 (orange), ATPB K124-ATPO K192 (yellow), ATPO K192-ATPB K124 (* indicates missed tryptic cleavage on the ATPB peptide GQKVLDSGAPIK124IPVGPETLGR, dark blue), ATPA protein levels (green dashed line), ATPB protein levels (dark blue dashed line), and ATPO protein levels (brown dashed line). (B) Ribbon structure of CV (PDB: 5ARA) illustrating the F1 region, which extends into the mitochondrial matrix, and the F0 region, embedded in the inner-mitochondrial membrane. The zoomed inset illustrates ATPA (dark blue), ATPB (gold), and ATPO (magenta), with cross-linked Lys shown as red space-filled residues. Reproduced with permission from Chavez et al., 2019 . Copyright 2019 The Authors.
Figure 38.
Figure 38.
Experimental overview of XL-MS in heart tissue. Hearts were excised from four mice (strain C57BL/6NCrl) minced into 1 mm3 cubes and cross-linked with the PIR cross-linker BDP-NHP. Two hearts were processed as whole heart protein extracts, while the other two were subjected to subcellular fractionation to isolate mitochondria. Protein was extracted with urea, digested with trypsin and cross-linked peptide pairs were enriched using strong cation exchange and avidin affinity chromatography. Reproduced with permission from Chavez et al., 2018. Copyright 2017 Elsevier Inc.
Figure 39.
Figure 39.
Cross-linking-derived model for sarcomere protein complexes. (A) Structural model of sarcomere protein interactions including the thick filament proteins: myosin motor (MYH6, red), myosin essential light chain (MYL3, teal blue), myosin regulatory light chain (MLRV, blue-violet), and the thin filament proteins: actin (ACTA green and red-violet), tropomyosin (yellow), and the three troponin subunits (TNNC1, light blue; TNNT2, blue; TNNI3, dark blue). The model utilizes structural information from structures PDB: 5H53, 5CJ1, 4XA4, 5CHX, 5CJ0, 1J1E, and 5JLH. The second MYH6 molecule is represented by a gray semi-transparent structure. Cross-linked sites are indicated by green space-filled residues, and links between residues are displayed as gray bars (Ca-Ca distance <42 Å) or yellow bars (Ca-Ca distance >42 Å). A total of 10 cross-links (2 MYH6-MLRV and 8 MYH6-MYL3) exceed 42 Å. These links are clustered around three flexible hinge regions indicated by numbered yellow circles in the MYH6 light chain binding domain. (B) Zoomed inset of a 90° rotation of the structure shown in (A). Calcium ions bound to TNNC1 are shown as magenta spheres. The yellow links between K165 of TNNI3 and K330 of ACTA and K43 of TNNC1 and K330 of ACTA exceed the possible cross-linkable distance and are not compatible with the calcium-saturated structure of troponin (PDB: 1J1E), and are instead indicative of the calcium-depleted state of troponin in which TNNI3 changes conformation to interact with ACTA, effectively blocking the myosin interaction site. (C) Cartoon diagram of the basic unit comprising the sarcomere. Thin filaments comprised of actin, tropomyosin, and tryponin are interlaced with thick filaments comprised of myosin and titin. The z-line proteins α-actinin and myozenin link thin filaments together while the thick filaments join at the M-band comprised primarily of myomesin. Reproduced with permission from Chavez et al., 2018. Copyright 2017 Elsevier Inc.
Figure 40.
Figure 40.
Cross-linking-derived model for respirasome supercomplex CI2CIII2CIV2. (A) CryoEM-derived structure of respirasome CICIII2CIV (PDB: 5GUP) with cross-links identifying interactions between CI (gold ribbon) and CIII (purple ribbon) (NDUA2 K13, K75, and K98 linked to QCR2 K250), CIII homodimer (QCR2 K159 linked to QCR2 K159), and CI and CIV (teal-blue ribbon) (COX5A K189 linked to NDUA9 K68) displayed. Cross-linked sites are shown as space-filled residues. Residues connected by red lines agree with the structure while residues connected by a yellow line exceed the maximum cross-linkable distance (42 Å). (B) Structure of a circular representation of the respirasome CI2CIII2CIV2, which agrees with all observed cross-linked sites. Reproduced with permission from Chavez et al., 2018. Copyright 2017 Elsevier Inc.

Similar articles

Cited by

References

    1. Mora C; Tittensor DP; Adl S; Simpson AGB; Worm B How Many Species Are There on Earth and in the Ocean? PLoS Biol 2011, 9, e1001127. - PMC - PubMed
    1. Ellis RJ Macromolecular Crowding: Obvious but Underappreciated. Trends in Biochemical Sciences 2001, 26, 597–604. - PubMed
    1. Stadmiller SS; Aguilar JS; Parnham S; Pielak GJ Protein–Peptide Binding Energetics under Crowded Conditions. J. Phys. Chem. B 2020, 124, 9297–9309. - PubMed
    1. Gruebele M; Pielak GJ Dynamical Spectroscopy and Microscopy of Proteins in Cells. Current Opinion in Structural Biology 2021, 70, 1–7. - PubMed
    1. Sali A; Glaeser R; Earnest T; Baumeister W From Words to Literature in Structural Proteomics. Nature 2003, 422, 216–225. - PubMed

Publication types

MeSH terms