. 2021 Aug 3;33(8):1592-1609.e7.
doi: 10.1016/j.cmet.2021.06.004. Epub 2021 Jul 6.

Individual-specific functional epigenomics reveals genetic determinants of adverse metabolic effects of glucocorticoids

Affiliations

Individual-specific functional epigenomics reveals genetic determinants of adverse metabolic effects of glucocorticoids

Wenxiang Hu et al. Cell Metab. .

Abstract

Glucocorticoids (GCs) are widely used as anti-inflammatory drugs, but their long-term use has severe metabolic side effects. Here, by treating multiple individual adipose stem cell-derived adipocytes and induced pluripotent stem cell-derived hepatocytes with the potent GC dexamethasone (Dex), we uncovered cell-type-specific and individual-specific GC-dependent transcriptomes and glucocorticoid receptor (GR) cistromes. Individual-specific GR binding could be traced to single-nucleotide polymorphisms (SNPs) that altered the binding motifs of GR or its cooperating factors. We also discovered another set of genetic variants that modulated Dex response through affecting chromatin accessibility or chromatin architecture. Several SNPs that altered Dex-regulated GR binding and gene expression controlled Dex-driven metabolic perturbations. Remarkably, these genetic variations were highly associated with increases in serum glucose, lipids, and body mass in subjects on GC therapy. Knowledge of the genetic variants that predispose individuals to metabolic side effects allows for a precision medicine approach to the use of clinically relevant GCs.

Keywords: adipocyte; gene regulation; genetic variation; glucocorticoid receptor; hepatocyte; precision medicine.


Conflict of interest statement

Declaration of interests M.A.L. is an advisory board member for Pfizer and consultant to Flare Therapeutics, Madrigal Pharmaceuticals, and Novartis. M.V.R. receives investigator-initiated research support from Servier. D.J.R. is an advisory board member for Alnylam, Novartis, Pfizer, and Verve and a co-founder of Staten Biotechnology. C.H.-P. is an advisory board member for Adaptive Biotechnology, is on the Data Monitoring Committee for Novartis, and has received honorarium from Amgen and Erytech. The remaining authors declare no competing interests.

Figures

Figure 1.
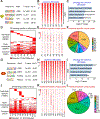
Figure 1.. Individual-specific Dex responsiveness in individual stem cell-derived adipocytes and HLCs.
(A and B) Scheme of the adipogenic (A) and hepatic (B) differentiation procedure and DMSO or Dex (1 μM) treatment. (C) Gene ontology for Dex-responsive genes in adipocytes from all eight individuals. (D) Heatmap of individual-specific responsive genes that are significantly regulated by Dex in the adipocytes from only one individual. The color bar indicates log2(fold change) in Dex vs DMSO. (E) mRNA expression of individual A4-specific upregulated gene PCSK1 and downregulated gene GPD2 in adipocytes from eight individuals, normalized to DMSO, as measured by RNA-seq. (F and G) Gene ontology for A2-specific Dex-responsive genes (F) and A8-specific Dex-responsive genes (G). (H) Gene ontology for Dex-responsive genes in HLCs from all eleven individuals. (I) Heatmap of individual-specific responsive genes that are significantly regulated by Dex in only one individual’s HLCs. The color bar indicates log2(fold change) in Dex vs DMSO. (J) mRNA expression of individual H7-specific upregulated gene APOC2 and H2-specific downregulated gene CPT1C in the HLCs of eleven individuals, normalized to DMSO, as measured by RNA-seq. (K and L) Gene ontology for H7-specific Dex-responsive genes (K) and H8-specific Dex-responsive genes (L). *P < 0.05, by Student’s t-test (E and J). See also Figures S1–S3.
Figure 2.
Figure 2.. Differential Dex-induced genomic binding of GR in individual stem cell-derived adipocytes and HLCs.
(A) Consensus motif logos for the top-scoring motif families found in GR binding regions in adipocytes treated with Dex. (B) Heatmap of common GR peaks that are detected similarly in adipocytes from all eight individuals. The color bar indicates the scale of normalized tag counts. (C) Gene ontology for the nearest genes of GR binding sites that are detected similarly in adipocytes from eight individuals. (D) Overall GR binding profile in adipocytes from eight individuals. (E) Heatmap of individual-specific unique peaks that are specifically unique in adipocytes from only one individual. (F) Proportion of individual-specific GR peaks that are specifically detected in adipocytes from only one individual. (G) Consensus motif logos for the top-scoring motif families found in GR binding regions in HLCs treated with Dex. (H) Heatmap of common GR peaks that are detected similarly in HLCs from all eleven individuals. The color bar indicates the scale of normalized tag counts. (I) Gene ontology for the nearest genes of GR binding sites that are detected similarly in HLCs from all eleven individuals. (J) Overall GR binding profile in HLCs from all eleven individuals. (K) Heatmap of individual-specific unique peaks that are specifically unique in HLCs from only one individual. (L) Proportion of individual-specific GR peaks that are specifically detected in HLCs from only one individual. See also Figures S4–S5.
Figure 3.
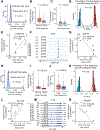
Figure 3.. Differential GR binding drives individual-specific Dex responses
(A and H) Dex-responsive genes are enriched in GR peaks in adipocytes (A) and HLCs (H) based on a random test. The percentage of Dex-responsive genes that have GR binding sites within 10 kb is indicated with a red arrow. (B and I) The Dex responses near strong (Top 500 peaks) and weak (Bottom 500 peaks) GR binding sites in adipocytes (B) and HLCs (I). (C and J) The GR binding intensities near high (Top 500 genes) and low (Bottom 500 genes) Dex-responsive genes in adipocytes (C) and HLCs (J). (D and K) The number of gene-peak pairs in which gene responses to Dex are tightly associated with the intensities of GR bindings within 200 kb in adipocytes (D) and HLCs (K). (E - G) Two example genes FAM214A (E) and ASF1B (G) whose responsiveness to Dex are positively or negatively associated with GR binding intensity in adipocytes. The GR-ChIP tracks at FAM214A locus were shown (F). (L - N) Two example genes SLC1A5 (L) and HEXIM2 (N) whose responsiveness to Dex are positively or negatively associated with GR binding intensity in HLCs. The GR-ChIP tracks at SLC1A5 locus were shown (M). The P values were calculated by permutation test (A and H), Student’s t-test (B, C, I and J) or R function cor.test (D, E, G, K, L and N). See also Figures S6.
Figure 4.
Figure 4.. Cell type-specific Dex responses and GR genomic binding.
(A) Heatmap demonstrating the Dex-responsive genes in at least half of the individual adipocytes or HLCs. The color bar indicates log2(fold change) in Dex vs DMSO. (B) Gene ontology for Dex-responsive genes observed in both adipocytes and HLCs. (C) Venn diagram demonstrating the GR genomic binding in at least half of the individual adipocytes and HLCs. (D and E) The percentage of adipocyte-specific Dex-responsive genes, HLCs-specific Dex-responsive genes or random genes that have nearby adipocyte-specific GR binding sites (D) or HLCs-specific GR binding sites (E). (F) One example gene ACACB that’s induced by Dex in adipocytes only have higher nearby GR binding intensity in adipocytes compared to that in HLCs. Boxplots show median as a horizontal line, interquartile range as a box. (G) One example gene ABCB11 that’s induced by Dex in HLCs only have higher nearby GR binding intensity in HLCs compared to that in adipocytes. Boxplots show median as a horizontal line, interquartile range as a box. (H) GR ChIP-seq tracks at ABCB11 locus in adipocytes and HLCs. (I-K) De novo motif analysis for common (I), adipocyte-specific (J) and HLC-specific (K) GR peaks. See also Figures S7.
Figure 5.
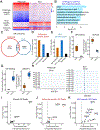
Figure 5.. Genetic variants determine GR function and Dex responses.
(A and I) Enrichment of genetic variants associated with metabolic disorders in common or specific GR peaks in adipocytes (A) and in HLCs (I). The number is - log10 (P), which is also reflected by color. (B) Visualization of an A5-specific absent peak region (yellow box) at LPAR1 locus across individual adipocytes. The black arrow indicates the position of rs10980797. (C) Scatter plot showing the LPAR1 gene is not responsive to Dex in only individual A5 adipocytes. (D) The putative effect of rs10980797 on CEBP motif. (E and F) GR (E) and CEBPβ (F) ChIP-qPCR for LPAR1, FKBP5, and INS2 in eight individual adipocytes (2 A/A, 5 A/G and 1 G/G). Data are expressed as mean ± SEM. (G and H) Differential GR binding near PPP1R3C locus (G) and Dex response of PPP1R3C (H) between different genotypes of rs10881935 across individual adipocytes. Data are expressed as mean ± SEM. (J) The putative effect of rs6026774 on GR motif. (K and L) Differential GR binding near LBP locus (K) and Dex response of LBP (L) between different genotypes of rs6026774 across individual HLCs. Data are expressed as mean ± SEM. (M) The activities of luciferase reporters with the different alleles for rs6026774 and control reporter PGL4.24 in hepG2 cell lines treated with DMSO or Dex. Data are expressed as mean ± SEM. (N) GR ChIP-qPCR for LBP, PDK4, and INS2 in HLCs (9 A/A and 2 G/G). Data are expressed as mean ± SEM. (O) mRNA expression of LBP was examined by qPCR in 17 individual HLCs. Blue dots represent repeated experiment of individuals H1-H11. Red dots represent new HLCs (4 A/G, 2 G/G). Data are expressed as mean ± SEM fold change due to Dex. (P and Q) Differential GR binding near CPT1A locus (P) and Dex response of CPT1A (Q) between different genotypes of rs2060982 across individual HLCs. Data are expressed as mean ± SEM. *P < 0.05, by Student’s t-test (M, N and O). See also Figures S8.
Figure 6.
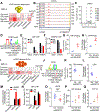
Figure 6.. Genetic variations modulate GR function through affecting chromatin accessibility and architecture.
(A) Diagram depicting SNPs modulate gene response to Dex by affecting chromatin accessibility. (B and C) rs55830753 affects ATAC-seq (left of B) signal and GR binding (right of B) near CYP3A5 and CYP3A7 locus and modulates their response to Dex (C). (D) Venn diagram demonstrating the numbers of H3K4me3-mediated loops in DMSO- or Dex-treated H11 HLCs. (E) Scatter plot revealing the genes whose promoter interaction score is 2 fold higher in Dex or DMSO group. Promoter interaction score represents the total PET number of each gene promoter. (F and G) The percentage of Dex-responsive genes with Dex-specific interactions (F) or DMSO-specific interactions (G). (H) mRNA expression of MAOA and MAOB in HLCs from eleven individuals, normalized to DMSO, as measured by RNA-seq. Data are expressed as mean ± SEM. (I) Visualization of promoter-enhancer interactions (Top) and GR binding (Bottom) at MAOA and MAOB locus in DMSO or Dex-treated H11 HLCs. The scale of Y-axis of ChIA-PET is a log scale. (J) Visualization of promoter-enhancer interactions (Top) and GR binding (Bottom) at FIBIN locus in five Dex-treated HLCs. Yellow box indicates genomic regions with H9-specifc promoter-enhancer loops and H9-specific genotypes. The scale of Y-axis of ChIA-PET is a log scale. (K) mRNA expression level of FIBIN in HLCs from five individuals, normalized to DMSO, as measured by RNA-seq. Data are expressed as mean ± SEM. (L) Diagram depicting the mechanisms of SNPs that modulate gene response to Dex by affecting the generation of loops. *P < 0.05, by Student’s t-test (H and K). See also Figures S9.
Figure 7.
Figure 7.. Genetic variants determine metabolic side effects of GC therapy.
(A) Percentage of pediatric individuals carrying each genotype of rs10980797 becoming hyperglycemic (>160 mg/dL) during treatment. 117 AA, 194 AG and 76 GG children with ALL who received chemotherapy with glucocorticoids. (B) The change of triglyceride level after Dex treatment (Continuation Week8 – Week7) in individuals with ALL carrying different genotypes at rs10881935. Boxplots show median as a horizontal line, interquartile range as a box. (C) Glucose production in hepatic organoids with different genotypes at rs6026774 treated with DMSO, Dex and Glucagon. 10 AA (red) and 7 AG or GG (blue) iPSC-derived hepatic organoids. Data are expressed as mean ± SEM. *P < 0.05 (Student’s t-test). (D) Percentage of pediatric individuals with ALL carrying each genotype of rs2060982 becoming hyperglycemic (>160 mg/dL). 112 AA, 173 AG and 102 GG. (E) The change of total cholesterol level (left) and LDL level (right) after Dex treatment (Continuation week8 – week7) in individuals with ALL carrying different genotypes at rs55830753. The P value was calculated by multiple logistic regression analysis (A, B, D and E). See also Figures S10.

Comment in

Similar articles

Cited by

References

    1. Bachmann PS, Gorman R, Papa RA, Bardell JE, Ford J, Kees UR, Marshall GM, and Lock RB (2007). Divergent mechanisms of glucocorticoid resistance in experimental models of pediatric acute lymphoblastic leukemia. Cancer Res 67, 4482–4490. - PubMed
    1. Barnes PJ (2011). Glucocorticosteroids: current and future directions. Br J Pharmacol 163, 29–43. - PMC - PubMed
    1. Behera V, Evans P, Face CJ, Hamagami N, Sankaranarayanan L, Keller CA, Giardine B, Tan K, Hardison RC, Shi J, et al. (2018). Exploiting genetic variation to uncover rules of transcription factor binding and chromatin accessibility. Nat Commun 9, 782. - PMC - PubMed
    1. Brenner LN, Mercader JM, Robertson CC, Cole J, Chen L, Jacobs SBR, Rich SS, and Florez JC (2020). Analysis of Glucocorticoid-Related Genes Reveal CCHCR1 as a New Candidate Gene for Type 2 Diabetes. J Endocr Soc 4, bvaa121. - PMC - PubMed
    1. Brotman DJ, Girod JP, Garcia MJ, Patel JV, Gupta M, Posch A, Saunders S, Lip GY, Worley S, and Reddy S. (2005). Effects of short-term glucocorticoids on cardiovascular biomarkers. J Clin Endocrinol Metab 90, 3202–3208. - PubMed

Publication types

MeSH terms