. 2021 Oct:192:114670.
doi: 10.1016/j.bcp.2021.114670. Epub 2021 Jul 4.

CARD9 mediates glucose-stimulated insulin secretion in pancreatic beta cells

Affiliations

CARD9 mediates glucose-stimulated insulin secretion in pancreatic beta cells

Suhadinie Gamage et al. Biochem Pharmacol. 2021 Oct.

Abstract

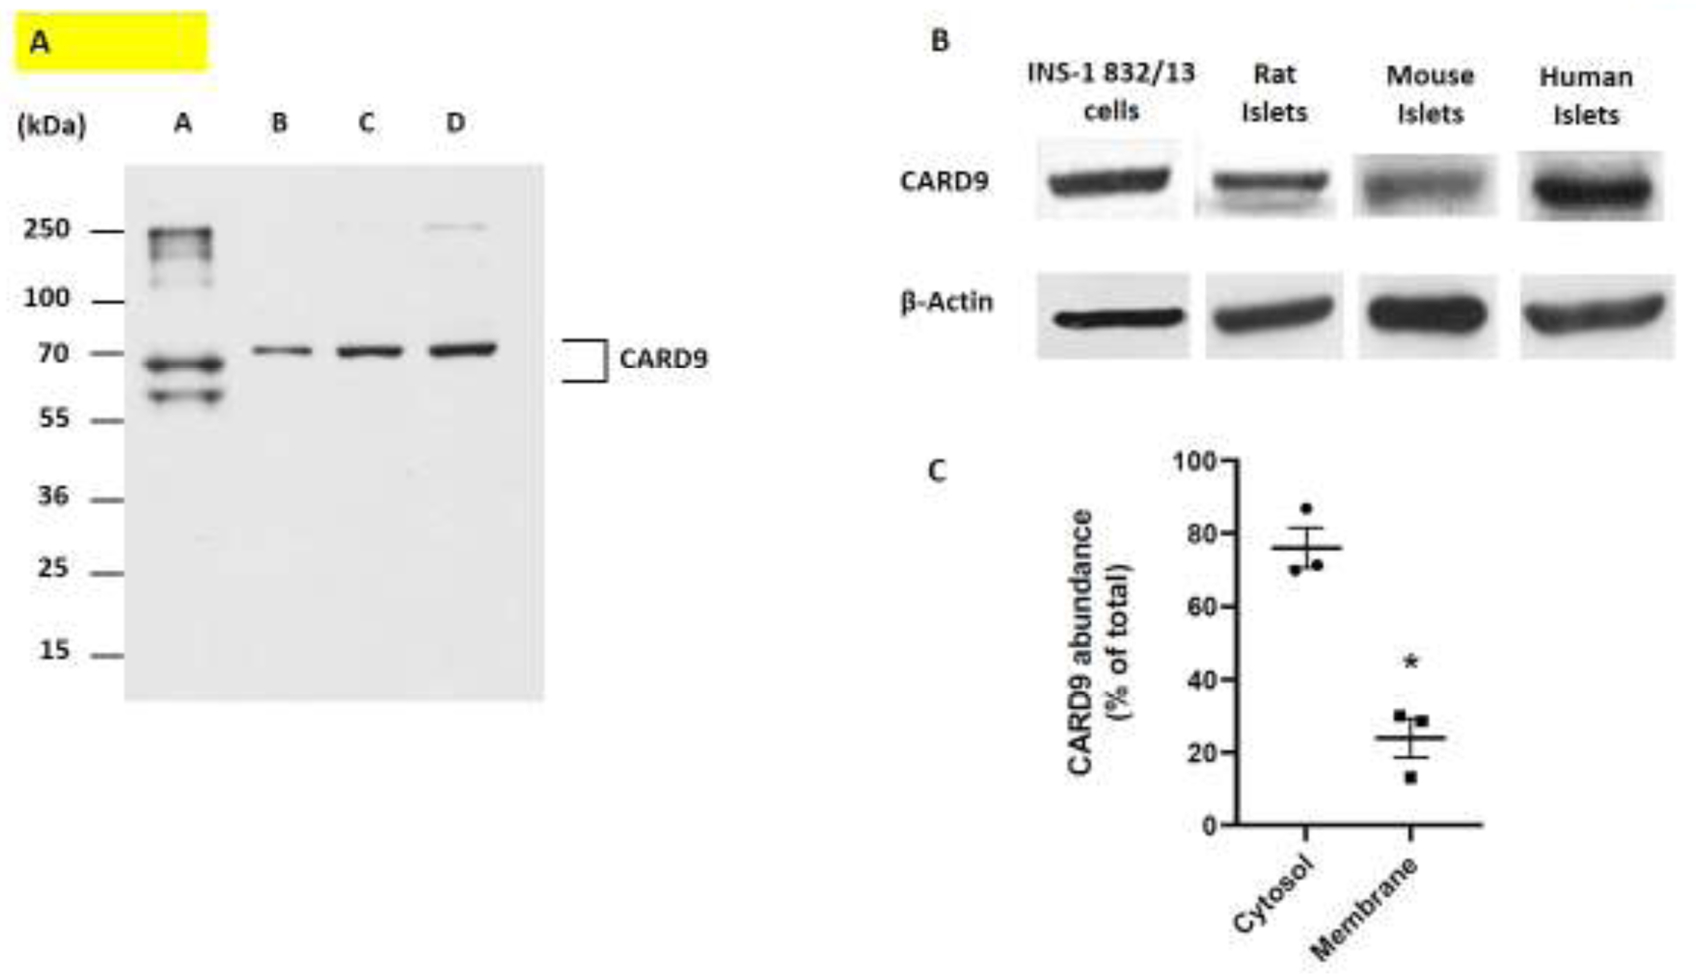
Caspase recruitment domain containing protein 9 (CARD9) plays key regulatory role(s) in innate and adaptive immune responses. Recent evidence implicates CARD9 in the onset of metabolic diseases including insulin resistance. However, potential contributory roles of CARD9 in glucose-stimulated insulin secretion (GSIS) remain unknown. Herein, we report that CARD9 is expressed in human islets, rat islets, mouse islets and clonal INS-1 832/13 cells. Subcellularly, CARD9 is predominantly cytosolic (~75%) in INS-1 832/13 cells. siRNA-mediated depletion of CARD9 expression significantly (~50%) suppressed GSIS in INS-1 832/13 cells. Interestingly, glucose-induced activation of Rac1, a small G-protein, which is a requisite for GSIS to occur, is unaffected in CARD9-si transfected cells, suggesting that CARD9-mediates GSIS in a Rac1-independent fashion. Furthermore, insulin secretion promoted by KCl or mastoparan (a global G protein activator), remained resistant to CARD9 depletion in INS-1 832/13 cells. In addition, pharmacological inhibition (BRD5529) of interaction between CARD9 and TRIM62, its ubiquitin ligase, exerted no significant effects on GSIS. Lastly, depletion of CARD9 prevented glucose-induced p38, not ERK1/2 phosphorylation in beta cells. Based on these observations, we propose that CARD9 might regulate GSIS via a Rac1-independent and p38-dependent signaling module.

Keywords: CARD9; Insulin secretion; Pancreatic beta cell; Rac1.


Conflict of interest statement

Conflict of Interests

The authors declare no conflict of interests

Figures

Figure 1:
Figure 1:. Evidence suggesting that CARD9 is expressed in pancreatic beta cells, and that it is predominantly cytosolic in distribution
Panel A: A representative western blot depicting the specificity of the CARD9 antibody employed in the current studies. (A) THP-1 cell lysate (positive control; 50 μg/lane), (B) 15 μg INS-1 832/13 cell lysate protein, (C) 30 μg INS-1 832/13 cell lysate protein and (D) 45 μg INS-1 832/13 cell lysate protein. Panel B: Western blot data demonstrating expression of CARD9 in lysates derived from INS-1 832/13 cells, rat islets, mouse islets and human islets. Corresponding actin levels are provided in this blot. Panel C: A graphical representation for relative abundance of CARD9 in the membrane and cytosolic fractions in INS-1 832/13 cells. Total membrane and cytosol fractions were isolated from INS-1 832/13 cells using the Mem-PER Plus Membrane Extraction kit, and relative abundance of CARD9 in these fractions was determined by western blotting. Intensity of the bands was quantified by densitometry. Data are means ± SEM from three independent experiments (*p<0.05 vs. cytosol).
Figure 2:
Figure 2:. Knockdown of CARD9 expression results in inhibition of GSIS in INS-1 832/13 cells.
Panel A: Lysates from Con-si or CARD9-si transfected INS-1 832/13 cells exposed to LG and HG conditions were probed for CARD9 by western blotting. These data indicated significant knockdown of endogenous expression in cells transfected with CARD9-si under both LG and HG conditions. β-Actin was used as loading control. A representative blot from three experiments is shown here. Panel B: Shows a graphical representation of the degree of CARD9 knockdown under our current experimental conditions. (Data are mean ± SEM from 3 independent experiments; Comparisons: *: significant vs. LG Con-si; #: significant vs. HG Con-si (*p<0.05). Panel C: Con-si or CARD9-si transfected INS-1 832/13 cells were exposed to LG or HG for 45 minutes and insulin secreted into the media was quantified using ELISA. Data are mean ± SEM from three independent experiments. Comparisons: a: significant vs. LG Con-si; b: significant compared with LG CARD9-si; c: significant vs. HG Con-si. (*p<0.05).
Figure 3:
Figure 3:. CARD9 knockdown elicits no significant effects on insulin secretion promoted by KCl in INS-1 832/13 cells
INS 832/13 cells were transfected with Con-si or CARD9-si and treated with LG or KCl (60mM; concentration of NaCl was reduced in the medium to maintain osmolality) for 60 min. Insulin secreted into the media was quantified using ELISA. Panel A: a representative western blot depicting the degree of CARD9 knockdown under conditions employed in these studies. β-Actin was used as loading control. Panel B: Shows a graphical representation of insulin secreted into the medium in INS-1 832/13 cells exposed to LG or KCl is shown herein. Data are mean ± SEM and is representative of two independent experiments. Comparisons: a: significant vs. with LG Con-si; b: significant vs. with LG CARD9-si (*p<0.05).
Figure 4:
Figure 4:. Depletion of CARD9 in INS-1 832/13 results in inhibition of both rapid and slow phases of GSIS as determined by a static phase secretion assay
INS-1 832/13 cells were transfected with either Con-si or CARD9-si (as above). Forty eight hours post transfection, the cells were exposed to LG or HG for 10 minutes (representing the rapid phase of insulin secretion) and the supernatant was completely removed after this incubation. The cells were immediately exposed to the same stimuli for an additional 30 minutes (representing the slow phase of insulin secretion) and the supernatant was removed following this incubation. Amount of insulin released into the media was quantified by ELISA. Panel A: Data from a representative experiment (n=4) demonstrating the regulatory roles of CARD9 in rapid (0–10 minutes) and slow (10–40 minutes) phases of GSIS in INS-1 832/13 cells. Data are mean ± SEM. Comparisons: a: significant vs. LG Con-si; b: significant compared with LG CARD9-si; c: significant vs. HG Con-si. (*p<0.05). Panel B depicts the percent inhibition of GSIS in INS-1 832/13 cells transfected with CARD9-si (indicated in Panel A). The degree of GSIS observed in INS-1 832/13 cells transfected with Con-si was taken as 100%. Data are mean ± SEM (n=4 independent experiments). Comparisons: *: significant vs. HG Con-si in the rapid phase of secretion; #: significant vs. HG Con-si in the slow phase of secretion (*,# p<0.05).
Figure 5:
Figure 5:. Mastoparan-induced insulin secretion is not affected by depletion of CARD9 expression in INS-1 832/13 cells
INS-1 832/13 cells were transfected with Con-si or CARD9-si and 48 hours post-transfection, the cells were treated with LG or Mas (30 μM) for 45 minutes. Insulin secreted into the media was quantified by ELISA. Panel A: A representative western blot showing the degree of CARD9 knockdown under conditions employed in these studies. β- Actin was used as loading control. Panel B: Graphical representation of insulin secretion in mastoparan-stimulated INS-1 832/13 cells (fold change over LG Con-si). Pooled data from 3 independent experiments is given here. Data are mean ± SEM. Comparisons: a: significant vs. with LG Con-si; b: significant vs. LG CARD9-si (*p<0.05).
Figure 6:
Figure 6:. Subcellular distribution and Rac1 activation are not altered in CARD9-depleted INS-1 832/13 cells following exposure to stimulatory glucose
Panel A: Total membrane and cytosol fractions were isolated from INS-1 832/13 cells exposed to either LG or HG for 45 minutes as described under Methods section. Relative abundance of CARD9 in these fractions was determined by western blotting. Purity of cytosolic and membrane fractions was assessed by determining relative abundance of GAPDH and E-Cadherin, respectively. These data suggest no significant alterations in the distribution of CARD9 between the cytosolic and membrane fractions under conditions conducive to GSIS. A representative blot from three independent experiments is shown here. Panel B: INS-1 832/13 cells transfected with Con-si or CARD9-si were exposed to LG or HG for 15 minutes, and the degree of Rac1 activation (GTP-bound conformation; Rac1-GTP) was determined by a pull-down assay as described under Methods. Abundance of total Rac1 in the cell lysates, and the degree of CARD9 knockdown obtained is also shown alongside Rac1 activation data. β-Actin was used as loading control. These data indicated no significant effects of CARD9 knockdown on glucose-induced Rac1 activation in INS-1 832/13 cells. A representative blot from three independent experiments is shown here. Panel C: Densitometric quantification of active Rac1 (Rac1-GTP) from studies depicted in Panel B is provided here. Data are expressed as mean ± SEM from three independent experiments. Comparisons: a: significant vs. LG Con-si; b: significant compared with LG CARD9-si (*p<0.05).
Figure 7:
Figure 7:. BRD5529, a known inhibitor of CARD9, exerts no significant effects on GSIS in INS-1 832/13 cells
Panel A: Structure of BRD5529. Panels B and C: GSIS was quantified in INS-1 832/13 cells incubated with BRD5529 either for 60 minutes (Panel B) or overnight (Panel C) as described under Methods. Data given in Panel B are from one experiment expressed as mean ± SEM (quadruplicate measurements). Data given in Panel C are representative of three independent experiments with comparable effects on insulin secretion. Comparisons: a: significant vs. LG Control; b: significant vs. LG BRD5529. (*p<0.05).
Figure 8:
Figure 8:. siRNA-mediated knockdown of CARD9 inhibits glucose-induced p38 phosphorylation, but not ERK1/2 phosphorylation in INS- 1832/13 cells
INS-1 832/13 cells transfected with either Con-si or CARD9-si followed by incubation with either LG or HG for 30 minutes. Cell lysates were prepared in RIPA lysis buffer containing protease and phosphatase inhibitors. Levels of phospho-ERK1/2 or phospho-p38 were determined by western blotting. The same blots were stripped and re-probed for total ERK1/2 and total p38. Panel A: shows a representative blot demonstrating the degree of knockdown of CARD9 in these experiments. β-Actin was used as loading control. Representative blots indicating the relative abundance of total and phospho-ERK1/2 and p38 are also shown here. Panel B: shows pooled data (n=3 independent experiments) on the degree of glucose-induced phosphorylation of ERK1 in INS-1 cells transfected with either Con-si or CARD9-si. Comparisons: a: significant vs. LG Con-si; b: significant compared with LG CARD9-si. (*p<0.05). Panel C: shows pooled data (n=3 independent experiments) on the degree of glucose-induced phosphorylation of ERK2 in INS-1 cells transfected with either Con-si or CARD9-si. Comparisons: a: significant vs. LG Con-si; b: significant compared with LG CARD9-si. (*p<0.05). Panel D: shows pooled data (n=5 independent experiments) on the degree of glucose-induced phosphorylation of p38 in INS-1 cells transfected with either Con-si or CARD9-si. Comparisons: a: significant vs. LG Con-si; b: significant compared with LG CARD9-si; c: significant vs. HG Con-si. (*p<0.05).

Similar articles

Cited by

References

    1. MacDonald MJ, Elusive proximal signals of beta-cells for insulin secretion, Diabetes 39(12) (1990) 1461–6. - PubMed
    1. Newgard CB, McGarry JD, Metabolic coupling factors in pancreatic beta-cell signal transduction, Annu Rev Biochem 64 (1995) 689–719. - PubMed
    1. Prentki M, Peyot ML, Masiello P, Madiraju SRM, Nutrient-Induced Metabolic Stress, Adaptation, Detoxification, and Toxicity in the Pancreatic β-Cell, Diabetes 69(3) (2020) 279–290. - PubMed
    1. Maechler P, Mitochondrial function and insulin secretion, Mol Cell Endocrinol 379(1–2) (2013) 12–8. - PubMed
    1. Tengholm A, Gylfe E, cAMP signalling in insulin and glucagon secretion, Diabetes Obes Metab 19Suppl 1 (2017) 42–53. - PubMed

Publication types