. 2021 Jul 22;184(15):4048-4063.e32.
doi: 10.1016/j.cell.2021.06.018. Epub 2021 Jul 6.

GABA-receptive microglia selectively sculpt developing inhibitory circuits

Affiliations

GABA-receptive microglia selectively sculpt developing inhibitory circuits

Emilia Favuzzi et al. Cell. .

Erratum in

  • GABA-receptive microglia selectively sculpt developing inhibitory circuits.
    Favuzzi E, Huang S, Saldi GA, Binan L, Ibrahim LA, Fernández-Otero M, Cao Y, Zeine A, Sefah A, Zheng K, Xu Q, Khlestova E, Farhi SL, Bonneau R, Datta SR, Stevens B, Fishell G. Favuzzi E, et al. Cell. 2021 Oct 28;184(22):5686. doi: 10.1016/j.cell.2021.10.009. Cell. 2021. PMID: 34715023 Free PMC article. No abstract available.

Abstract

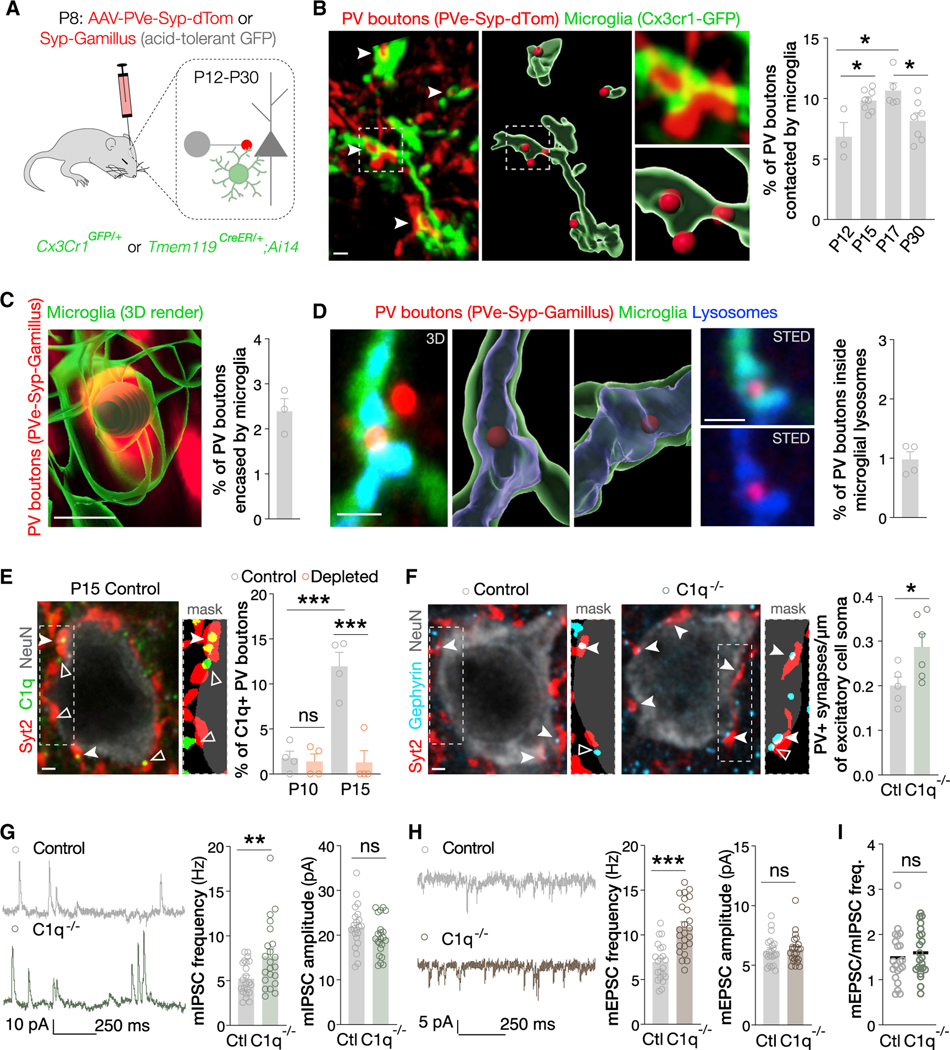
Microglia, the resident immune cells of the brain, have emerged as crucial regulators of synaptic refinement and brain wiring. However, whether the remodeling of distinct synapse types during development is mediated by specialized microglia is unknown. Here, we show that GABA-receptive microglia selectively interact with inhibitory cortical synapses during a critical window of mouse postnatal development. GABA initiates a transcriptional synapse remodeling program within these specialized microglia, which in turn sculpt inhibitory connectivity without impacting excitatory synapses. Ablation of GABAB receptors within microglia impairs this process and leads to behavioral abnormalities. These findings demonstrate that brain wiring relies on the selective communication between matched neuronal and glial cell types.

Keywords: cerebral cortex; development; glia-neuron interactions; inhibitory synapses; interneurons; microglia; neurodevelopmental disorders.


Conflict of interest statement

Declaration of interests B.S. serves on the SAB and is a minor shareholder of Annexon. G.F. is a founder of Regel. The other authors declare no competing interests.

Figures

Figure 1.
Figure 1.. Microglia depletion during cortical development alters inhibitory and excitatory synapse connectivity
(A) Schematic of microglia depletion experiment. (B) Image and density of Iba1+ microglia in control and depleted mice (n = 3–8). ***p < 0.001, Student’s t test (P4) and one-way ANOVA, Sidak’s multiple comparisons test (P8-P15). (C) Images, masks, and densityofSyt2+Gephyrin+ synapses made by PV cells onto excitatory neurons (NeuN) in P15control and depleted mice (n = 5). *p < 0.05, Student’s t test. (D) Schematic ofoptogenetics experiment, IPSCtraces, and IPSCamplitude (n = 16cellsfrom 4 controlsand n = 16cellsfrom 3 depleted mice). *p < 0.05, Mann-Whitney test. (E and F) Traces, frequency, and amplitude of mIPSCs (n = 22 cells from 3 control and n = 25 cells from 3 depleted mice) and mEPSCs (n = 25 cells from 3 control and n = 28 cells from 3 depleted mice). *p < 0.05, **p < 0.01, ns p > 0.05, Student’s t test. (G) mEPSC/mIPSC ratio; n = 22 cells from 3 control mice (Ctl) and n = 25 cells from 3 depleted (Dpl) mice. ns p > 0.05, Mann-Whitney test. (H) Schematic, images, masks, and density of VGlut2+Homer1+ synapses onto excitatory or PV cells in controls (n = 5–11) and depleted mice (n = 4–9) at P15. *p < 0.05, Student’s t test. (I) Schematic and legend for experiment in (J) and (K). (J) Images and density of Syt2+Gephyrin+ synapses made by PV cells onto excitatory neurons in P30 control and depleted mice (n = 6) after microglia repopulation. *p < 0.05, Student’s t test. (K) Density of VGlut2+Homer1+ synapses onto excitatory neurons in P30 control (n = 9) and depleted mice (n = 7) after microglia repopulation. *p < 0.05, Mann-Whitney test. Full and empty arrowheads indicate colocalization and boutons not meeting criteria. Scale bars, 1 μm except in (B) where it equals 100 μm. Data are mean ± SEM. See also Figure S1.
Figure 2.
Figure 2.. Microglia interact with inhibitory synapses during development
(A) Schematic of experiments in (B) to (D). (B) Images and 3D reconstruction of microglia processes (Cx3cr1GFP/+) contacting PV boutons (PVe-Syp-dTom: synaptophysin-tdTomato under the control of a PV-specific enhancer). Fraction of PV boutons contacted by microglia (n = 3–8 mice). *p < 0.05, one-way ANOVA, Holm-Sidak multiple comparisons test. (C) 3D reconstruction and fraction of PV boutons (PVe-Syp-Gamillus) encapsulated by microglia (Tmem119CreER/+;AI 14) at P15 (n = 3 mice). (D) Confocal image, 3D reconstruction, STED image and fraction of PV boutons (PVe-Syp-Gamillus) engulfed by microglial (Tmem119Cre/+;Ai14) lysosomes (CD68) at P15 (n = 4 mice). (E) Image, mask, and fraction of C1q+ PV boutons (Syt2) in control and depleted mice (n = 4). ns, p > 0.05; ***p < 0.001, one-way ANOVA, Holm-Sidak multiple comparisons test. (F) Images, masks, and density of Syt2+Gephyrin+ synapses made by PV cells onto excitatory neurons (NeuN) in P15 control (n = 5) and C1q−/− (n = 6) mice. *p < 0.05, Student’s t test. (G and H) Traces, frequency, and amplitude of mIPSCs (n = 22 cells from 3 control and n = 22 cells from 3 C1q−/− mice) and mEPSCs (n = 21 cells from 3 control and n = 24 cells from 3 C1q−/− mice). **p < 0.01, ***p < 0.001, ns p > 0.05, Student’s t test except for mEPSC amplitude where Mann-Whitney test was used. (I) mEPSC/mIPSC ratio (n = 21 cells from 3 control and n = 22 cells from 3 C1q−/− mice). ns, p > 0.05; Student’s t test. Scale bars, 1 μm. Full and empty arrowheads indicate colocalization and boutons not meeting criteria. Data are mean ± SEM. See also Figures S2 and S3.
Figure 3.
Figure 3.. GABA-receptive microglia preferentially interact with inhibitory versus excitatory synapses
(A) Schematic of in vivo imaging experiments and brain vasculature imaged through the cranial window. Scale bar, 500 μm. (B) Time-lapse images from Video S1 showing microglia contacting PV boutons. Scale bar, 10 μm. (C) Distribution of microglia contacting the indicated percentages of PV boutons over 20 min (n = 88 cells from 12 mice). (D) Duration of contacts between microglia interacting with a minority (n = 24 cells) or majority (n = 49 cells) of local PV boutons. **p < 0.01, Mann-Whitney test. (E) Images (left: single plane; right: 2-μm stack) of microglia (Cx3cr1GFP/+) expressing Gabbr1 and Gabbr2 mRNA at P15 (smFISH). Scale bars, 10 μm. (F) Fraction of microglia expressing Gabbr1, Gabbr2, and both mRNAs at P15 (n = 7) in layer 4 of the primary somatosensory cortex (S1). (G) 3D reconstruction and fraction of PV boutons (PVe-Syp-tdTom) contacted by Gabbr2+ and Gabbr2 microglia (Cx3cr1GFP/+) at P15 (n = 58 Gabbr2+ and 59 Gabbr2 cells from 4 mice). ***p < 0.001, Mann-Whitney test. Scale bar, 8 μm. (H) 3D reconstruction and fraction of VGlut2+ boutons contacted by Gabbr2+ and Gabbr2 microglia (Cx3cr1GFP/+) at P15 (n = 23 Gabbr2+ and 36 Gabbr2 cells from 4 mice). **p < 0.01, Student’s t test. Scale bar, 10 μm. Arrowheads indicate colocalization. Data are mean ± SEM. In (D), thick and thin lines are median and quartiles. See also Figures S2, S3, S4, S5 and Videos S1, S2, S3, and S4.
Figure 4.
Figure 4.. Removal of GABAB1Rs from microglia selectively impacts inhibitory connectivity
(A) 3D reconstruction and fraction of PV boutons (PVe-Syp-tdTom) contacted by microglia (Iba1)inP15 control (n = 7) and GABAb1RcKO (n = 5) mice. **p < 0.01, Student’s t test. Scale bar, 4 μm. (B) 3D reconstruction and fraction ofVGlut2+ boutons contacted by microglia (Iba1) in P15 control (n = 7) and GABAb1RcKO (n = 5) mice. ns, p > 0.05; Student’s t test. Scale bar, 4 μm. (C) Schematic of in vivo imaging experiments in (D)-(F) and brain vasculature imaged through the cranial window. Scale bar, 500 μm. (D) Time-lapse images showing cKO microglia contacting PV boutons. Scale bar, 20 μm. (E) Distribution of microglia contacting the indicated percentages of PV boutons over 20 min in cKO mice (n = 62 cells from 6 mice). Control is from Figure 3C. (F) Duration of contacts between microglia and PV boutons in cKO mice (n = 37 cells from 3 mice). Control is from Figure 3D. (G) Schematic of experiments in (H) to (L). (H) Images and density of Syt2+Gephyrin+ synapses made by PV cells onto excitatory neurons in P15 control (n = 8) and cKO (n = 6) mice. ***p < 0.001, Mann-Whitney test. Scale bar, 2 μm. (I) Images and density of VGlut2+Homer1+ synapses onto excitatory neurons in P15 control (n = 6) and cKO (n = 7) mice. ns p > 0.05, Student’s t test. Scale bar, 2 μm. (J and K) Representativetraces,frequency, and amplitude ofmIPSCsand mEPSCs (n = 13cellsfrom 3 control and n = 14cellsfrom 3 cKO mice) at P15. *p < 0.05; ns, p > 0.05, Student’s t test. (L) mEPSC/mIPSC ratio; n = 13 cells from 3 controls (Ctl) and n = 14 cells from 3 cKO mice (cKO). ns, * < 0.05; Student’s t test. cKO, Cx3cr1Cre/+;GABAB1Rfl/fl. Full and empty arrowheads indicate colocalization and boutons not meeting criteria. Insets in (H) and (I) show masks. Data are mean ± SEM. See also Figures S4 and S5.
Figure 5.
Figure 5.. Ablation of GABAB1Rs within microglia alters genes involved in synapse remodeling
(A) UMAP plots of WT microglia showing 5 clusters and scaled expression of representative enriched genes. (B) UMAP plots of WT and cKO integrated scRNA-seq dataset. (C) Same as (B), showing 8 mixed clusters and representative enriched genes. (D) Percentage of WT and cKO microglia composing each cluster. (E) Mixed cluster contributions to total differentially expressed genes (DEGs) between WT and cKO microglia. (F) Gene Ontology analysis of downregulated genes from cluster 4. (G) Violin plots of normalized log-expression values for representative genes significantly downregulated in cKO microglia from cluster 4. (H) Heatmap showing scaled expression of genes downregulated in cKO. (I) Cluster 4 subclusters and percentage of WT and cKO microglia. Representative downregulated genes are highlighted. See also Figure S6 and Tables S1 and S2.
Figure 6.
Figure 6.. The transcriptional changes observed in cKOs are restricted to GABA-receptive microglia
(A) Schematic of MERFISH experiment. (B) UMAP plots of WT control and cKO microglia in the MERFISH dataset. (C) Same as (B), showing 6 clusters. (D) Same as (B), showing scaled expression of Gabbr1 and Gabbr2. (E) Region imaged for MERFISH and cell maps on DAPI signal from a control slice. Scale bar, 100 μm. (F) Layer distribution of microglia. Data are mean ± SD between slices. (G) Split violin plots of normalized log-expression values for a representative pruning gene (C1qc) enriched in clusters 4 and 4GG control (ctl) cells. (H) Split violin plots of normalized log-expression values for representative genes enriched in GABA-receptive control (ctl) cells. (I) Volcano plot showing differentially expressed genes (DEGs) between control and cKO microglia for the MERFISH clusters. The negative log10-transformed p values are plotted against the log2 fold change. DEGs with an absolute log2 fold change higher than 0.25 and an adjusted p value <0.05 are depicted as opaque shapes with gene name, the rest is depicted with transparency. When close to the threshold, Gabbr-genes are also shown with opacity. Four data points with an adjusted p value >0.05 are outside the × axis limit. (J) Images, masks, and fraction of C1q+ PV synaptic terminals (Syt2) in P15 control and cKO mice (n = 5 each). *p < 0.05, Student’s t test. Scale bar, 1 μm. (K) Images, masks, and fraction of C1q+ VGlut2+ synaptic terminals in P15 control (n = 6) and cKO (n = 7) mice. ns, p > 0.05; Student’s t test. Scale bar, 1 μm. Data in (J) and (K) are mean ± SEM. Full and empty arrowheads indicate colocalization and boutons not meeting criteria. See also Table S2.
Figure 7.
Figure 7.. Loss of GABAB1Rs within microglia causes behavioral defects
(A) Illustration of behavioral syllables enriched in P30 WTs or cKOs. (B) Heatmap depicting the position of P30 WTs (n = 17) and cKOs (n = 29) during MoSeq. (C) Expression probability of syllable usage (left) and syllable speed (right) in P60 WT control (n = 9), cKO (n = 9), and Cre-Het control (n = 3) female mice. *p < 0.05,z test on bootstrapped syllable usage/speed distribution corrected for false discovery rate (FDR). Data are mean ± SEM. (D) Expression probability of syllable usage (left) and syllable speed (right) in P60 WT (n = 10), cKO (n = 5), and Cre-Het (n = 5) male mice. *p < 0.05, z test onbootstrapped syllable usage distribution corrected for FDR. Data are mean ± SEM. (E) Illustration of syllables enriched in P60 WTs or cKOs. (F) Heatmap depicting the position of P60 WTs (n = 19) and cKOs (n = 14) during MoSeq. (G) Transition graphs depicting syllables (nodes) and transition probabilities (edges) in P60 WT and cKO mice. Node size proportional to syllable usage, edges weighted by bigram probability. Numbers correspond to syllables in Figure S7C. (H) Transition graph depicting the difference in syllable usage and transition probability in WT and cKO mice. Low probability transitions were removed. cKO: Cx3cr1Cre/+;GABAB1Rfl/fl. Syllable labels were assigned by a human observer. In (C) and (D), only relevant or significant syllables are shown. See also Figure S7 and Video S5.

Comment in

Similar articles

Cited by

References

    1. American Psychiatric Association (2013). Diagnostic and Statistical Manual of Mental Disorders (DSM-5) (APA Publishing; ).
    1. Amezquita RA, Lun ATL, Becht E, Carey VJ, Carpp LN, Geistlinger L, Marini F, Rue-Albrecht K, Risso D, Soneson C, et al. (2020). Orchestrating single-cell analysis with Bioconductor. Nat. Methods 17, 137–145. - PMC - PubMed
    1. Amir AD, Davis KL, Tadmor MD, Simonds EF, Levine JH, Bendall SC, Shenfeld DK, Krishnaswamy S, Nolan GP, and Pe’er D. (2013). viSNE enables visualization of high dimensional single-cell data and reveals phenotypic heterogeneity of leukemia. Nat. Biotechnol 31, 545–552. - PMC - PubMed
    1. Badimon A, Strasburger HJ, Ayata P, Chen X, Nair A, Ikegami A, Hwang P, Chan AT, Graves SM, Uweru JO, et al. (2020). Negativefeedback control of neuronal activity by microglia. Nature 586, 417–423. - PMC - PubMed
    1. Bohlen CJ, Friedman BA, Dejanovic B, and Sheng M. (2019). Microglia in Brain Development, Homeostasis, and Neurodegeneration. Annu. Rev. Genet 53, 263–288. - PubMed

Publication types