

Compensatory hepatic adaptation accompanies permanent absence of intrahepatic biliary network due to YAP1 loss in liver progenitors
- PMID: 34233187
- PMCID: PMC8280534
- DOI: 10.1016/j.celrep.2021.109310
Compensatory hepatic adaptation accompanies permanent absence of intrahepatic biliary network due to YAP1 loss in liver progenitors
Abstract
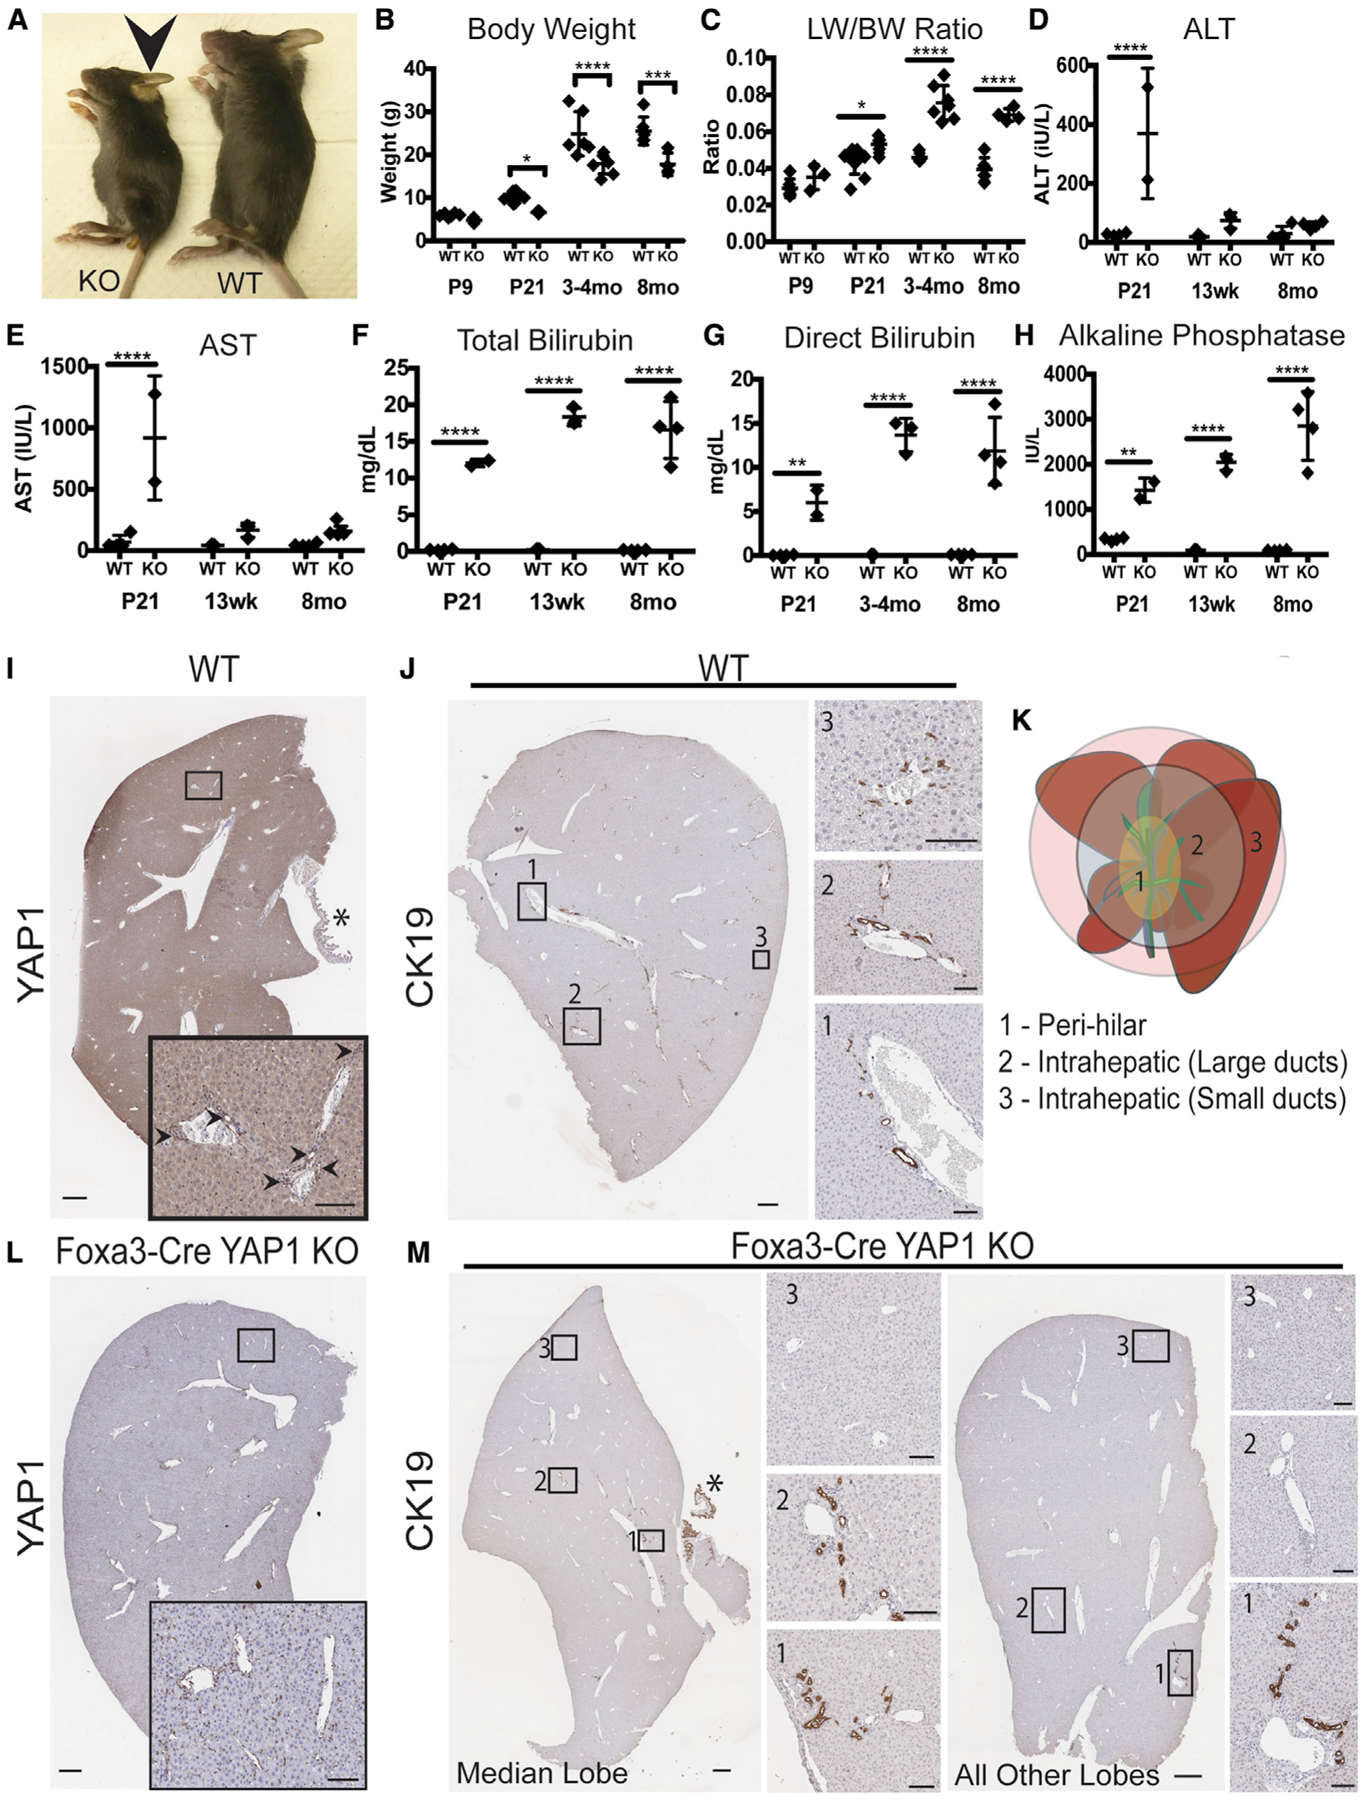
Yes-associated protein 1 (YAP1) regulates cell plasticity during liver injury, regeneration, and cancer, but its role in liver development is unknown. We detect YAP1 activity in biliary cells and in cells at the hepatobiliary bifurcation in single-cell RNA sequencing analysis of developing livers. Deletion of Yap1 in hepatoblasts does not impair Notch-driven SOX9+ ductal plate formation but does prevent the formation of the abutting second layer of SOX9+ ductal cells, blocking the formation of a patent intrahepatic biliary tree. Intriguingly, these mice survive for 8 months with severe cholestatic injury and without hepatocyte-to-biliary transdifferentiation. Ductular reaction in the perihilar region suggests extrahepatic biliary proliferation, likely seeking the missing intrahepatic biliary network. Long-term survival of these mice occurs through hepatocyte adaptation via reduced metabolic and synthetic function, including altered bile acid metabolism and transport. Overall, we show YAP1 as a key regulator of bile duct development while highlighting a profound adaptive capability of hepatocytes.
Keywords: 3D-tissue clearing and imaging; Hippo signaling; bile acid metabolism; bile duct development; intrahepatic bile duct; intravital microscopy; liver adaptation; liver development; liver regeneration.
Copyright © 2021 The Author(s). Published by Elsevier Inc. All rights reserved.
Conflict of interest statement
Declaration of interests The authors declare no competing interests.
Figures


Similar articles
-
Role of YAP1 Signaling in Biliary Development, Repair, and Disease.Semin Liver Dis. 2022 Feb;42(1):17-33. doi: 10.1055/s-0041-1742277. Epub 2022 Jan 24. Semin Liver Dis. 2022. PMID: 35073587 Free PMC article. Review.
-
STAT3 deficiency prevents hepatocarcinogenesis and promotes biliary proliferation in thioacetamide-induced liver injury.World J Gastroenterol. 2017 Oct 7;23(37):6833-6844. doi: 10.3748/wjg.v23.i37.6833. World J Gastroenterol. 2017. PMID: 29085226 Free PMC article.
-
Dysregulated Activation of Hippo-YAP1 Signaling Induces Oxidative Stress and Aberrant Development of Intrahepatic Biliary Cells in Biliary Atresia.Lab Invest. 2025 Feb;105(2):102199. doi: 10.1016/j.labinv.2024.102199. Epub 2024 Nov 22. Lab Invest. 2025. PMID: 39579985
-
NOTCH-YAP1/TEAD-DNMT1 Axis Drives Hepatocyte Reprogramming Into Intrahepatic Cholangiocarcinoma.Gastroenterology. 2022 Aug;163(2):449-465. doi: 10.1053/j.gastro.2022.05.007. Epub 2022 May 10. Gastroenterology. 2022. PMID: 35550144 Free PMC article.
-
Contribution of Resident Stem Cells to Liver and Biliary Tree Regeneration in Human Diseases.Int J Mol Sci. 2018 Sep 25;19(10):2917. doi: 10.3390/ijms19102917. Int J Mol Sci. 2018. PMID: 30257529 Free PMC article. Review.
Cited by
-
Nuclear ubiquitination permits Hippo-YAP signal for liver development and tumorigenesis.Nat Chem Biol. 2025 May 16. doi: 10.1038/s41589-025-01901-8. Online ahead of print. Nat Chem Biol. 2025. PMID: 40379800
-
LiverClear: A versatile protocol for mouse liver tissue clearing.STAR Protoc. 2022 Feb 15;3(1):101178. doi: 10.1016/j.xpro.2022.101178. eCollection 2022 Mar 18. STAR Protoc. 2022. PMID: 35243370 Free PMC article.
-
Hippo-Yap/Taz signalling in zebrafish regeneration.NPJ Regen Med. 2022 Jan 27;7(1):9. doi: 10.1038/s41536-022-00209-8. NPJ Regen Med. 2022. PMID: 35087046 Free PMC article. Review.
-
Nuclear miR-150 enhances hepatic lipid accumulation by targeting RNA transcripts overlapping the PLIN2 promoter.iScience. 2023 Sep 7;26(10):107837. doi: 10.1016/j.isci.2023.107837. eCollection 2023 Oct 20. iScience. 2023. PMID: 37736048 Free PMC article.
-
Wnt-β-catenin in hepatobiliary homeostasis, injury, and repair.Hepatology. 2023 Dec 1;78(6):1907-1921. doi: 10.1097/HEP.0000000000000495. Epub 2023 May 30. Hepatology. 2023. PMID: 37246413 Free PMC article. Review.
References
-
- Alvaro D, Mancino MG, Glaser S, Gaudio E, Marzioni M, Francis H, and Alpini G (2007). Proliferating cholangiocytes: a neuroendocrine compartment in the diseased liver. Gastroenterology 132, 415–431. - PubMed
Publication types
MeSH terms
Substances
Grants and funding
LinkOut - more resources
Full Text Sources
Medical
Molecular Biology Databases
Research Materials
