. 2021 Jul 6;36(1):109339.
doi: 10.1016/j.celrep.2021.109339.

Splicing factor SRSF1 is indispensable for regulatory T cell homeostasis and function

Affiliations

Splicing factor SRSF1 is indispensable for regulatory T cell homeostasis and function

Takayuki Katsuyama et al. Cell Rep. .

Abstract

The ability of regulatory T (Treg) cells to control the immune response and limit the development of autoimmune diseases is determined by distinct molecular processes, which are not fully understood. We show here that serine/arginine-rich splicing factor 1 (SRSF1), which is decreased in T cells from patients with systemic lupus erythematosus, is necessary for the homeostasis and proper function of Treg cells, because its conditional absence in these cells leads to profound autoimmunity and organ inflammation by elevating the glycolytic metabolism and mTORC1 activity and the production of proinflammatory cytokines. Our data reveal a molecular mechanism that controls Treg cell plasticity and offer insights into the pathogenesis of autoimmune disease.

Keywords: SRSF1; T cells; Treg; autoimmunity; cytokines; immune homeostasis; immune regulation; inflammation; mTOR pathway; splicing factor.


Conflict of interest statement

Declaration of interests The authors declare no competing interests.

Figures

Figure 1.
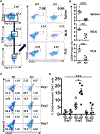
Figure 1.. Treg cell conditional Srsf1-KO mice spontaneously develop rapid fatal autoimmune disease
(A) Percent survival of WT (Foxp3YFP-CreSrsf1+/+), Treg Srsf1-HET (Foxp3YFP-CreSrsf1flox/+), and Treg Srsf1-KO (Foxp3YFP-CreSrsf1flox/flox) mice (n = 8–9 each). (B) Representative images of 3-week-old WT and Treg Srsf1-KO mice. (C) Graph shows body weight of WT and Treg Srsf1-KO mice (3–4 weeks old, age and sex matched, n = 7 each). (D) Representative images of spleen and peripheral lymph nodes (PLNs) from 3-week-old WT and KO mice. (E) Graphs show spleen weight/body weight (left, n = 7 each) and number of cells in PLNs (right, n = 4 each) (3–4 weeks old). (F) Serum was collected from WT and Treg Srsf1-KO mice (3–4 weeks old). Autoantibodies were measured by ELISA (n = 5 WT, n = 6 KO). (G) Representative images of hematoxylin and eosin staining of the lung and liver from 3- to 4-week-old WT and KO mice. Scale bars, 200 μM. (H) Cells from lungs were analyzed by flow cytometry. Plots (left) and graphs (right) show infiltrating T cells and Ly6G+CD11b+ neutrophils in lungs from WT and Treg Srsf1-KO mice (T cells: n = 7 WT, n = 8 KO; neutrophils: n = 3 each; 3–4 weeks old). *p < 0.05, **p < 0.005, and ***p < 0.0005, unpaired t test (C, E, F, and H); mean ± SEM.
Figure 2.
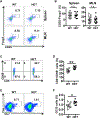
Figure 2.. Deletion of Srsf1 in Treg cells results in peripheral immune cell activation
Spleen cells were isolated from 3- to 4-week-old WT and Treg Srsf1-KO mice and analyzed by flow cytometry. (A) Plots show Thy1.2+TCRβ+ T cells gated on live cells from spleen. Graph on the right shows the percentage of T cells (n = 5 each). (B) Plots show CD62L and CD44 staining gated on live CD4 T cells in spleen and PLN from WT and KO mice. (C) Graphs show the percentage of naive (CD44lo CD62Lhi) and effector/effector memory (CD44hi CD62Llo) cells among CD4 T cells in spleen and PLN of WT and Treg Srsf1-KO (n = 5 each). (D) Spleen cells were stimulated with phorbol myristic acid (PMA) and ionomycin with monensin for 4 h. Plots show IFN-γ- and IL-4-producing CD4 T cells. (E) Graphs show the percentage of IFN-γ- and IL-4-producing CD4 T cells (IFN-γ: n = 7, IL-4: n = 6 each). (F) Plots show GL7+Fas+ germinal center (GC) B cells gated on live B cells in spleen from WT and KO mice. Graph shows the percentage of GC B cells in spleen (n = 5 WT, n = 6 KO). *p < 0.05 and ***p < 0.0005, unpaired t test (A, C, E, and F); mean ± SEM.
Figure 3.
Figure 3.. SRSF1 is essential for survival of Treg cells
(A) Plots show gating strategies and CD4+CD25+Foxp3+ Treg cells in spleen, MLN, and PLN from WT and Treg Srsf1-KO mice. (B) Graphs show frequencies of CD4+CD25+Foxp3+ Treg cells (spleen: n = 5 each; MLN and PLN: n = 4 each). (C) Naive CD4 T cells were isolated from pooled spleen and PLN cells from WT and Treg Srsf1-KO mice and cultured under Treg differentiation conditions. Cells were collected and analyzed by flow cytometry on days 1–3. Plots show 7AAD and Annexin V staining. (D) Graph shows the percentage of early apoptotic (7AADAnnexin V+) cells among CD4 T cells (n = 3–6). *p < 0.05, **p < 0.005, and ***p < 0.0005, unpaired t test (B) or one-way ANOVA with Tukey’s multiple comparisons test (D); mean ± SEM.
Figure 4.
Figure 4.. Srsf1-deficient Treg cells exhibit impaired phenotype and suppressive function
(A) Spleen cells were isolated from WT and T cell Srsf1-KO mice, and expression levels of Treg-associated molecules in CD4+CD25+Foxp3+ Treg cells were analyzed by flow cytometry. Dot plots (left) and histograms (right) show representative data of frequencies and mean fluorescence intensity (MFI) of markers in gated Treg cells. (B) Graphs show the percentage of CTLA4+, PD1+, and CD39+ cells gated on Treg cells and quantification of MFI of CD103, ICOS, GITR, LAG3, and Helios (n = 4–10 each). (C) Spleen cells from WT or T cell Srsf1-KO mice were isolated and conventional CD4 T (Tconv) cells and Treg cells (CD4+CD25+CD127lo) were sorted by flow cytometry. Tconv cells were labeled with carboxyfluorescein succinimidyl ester (CFSE) and co-cultured with Treg cells at increasing ratios for 7 days, and proliferation of Tconv cells was analyzed by flow cytometry. Representative plots are shown. (D) Graph shows proliferation of Tconv cells (n = 8 WT, n = 10 KO). (E) B6 mice were given 2.5% dextran sodium sulfate (DSS) in water to induce colitis for 8–10 days. One day before the initiation of DSS administration, PBS or flow-cytometry-sorted Treg cells (CD4+CD25+CD127lo) from WT or T cell Srsf1-KO mice were injected into B6 mice. Graph shows body weight of mice from five independent experiments (n = 6 each). (F) Representative image of colon after DSS administration for 8–10 days. Graph shows colon length of WT Treg and KO Treg group (n = 6 WT, n = 5 KO). (G) Naive CD4 T cells were adoptive transferred into Rag1−/− mice to induce colitis together with PBS or sorted Treg cells (CD4+CD25+CD127lo) from WT or T cell Srsf1-KO mice. Graph shows time course of body weight of Rag1−/− recipient mice (n = 4–5 each). *p < 0.05; **p < 0.005; and n.s., no significant difference, two-way ANOVA test (D, E, and G) and unpaired t test (B and F); mean ± SEM.
Figure 5.
Figure 5.. Treg Srsf1-HET mice exhibit peripheral immune cell activation
(A) Plots show CD4+CD25+Foxp3+ Treg cells in spleen and MLN from WT and Treg Srsf1-HET (Foxp3YFP-creSrsf1flox/+) mice. (B) Graphs show frequencies of CD4+CD25+Foxp3+ Treg cells among CD4 T cells in spleen and MLN (spleen: n = 10 WT and n = 11 HET; MLN: n = 12 WT and n = 13 HET). (C) Plots show CD4+CD69+ cells in MLN from WT and Treg Srsf1-HET mice. (D) Graph shows the percentage of CD4+CD69+ cells among CD4 T cells in MLN from 36- to 52-week-old WT and Treg Srsf1-HET mice (n = 7 each). (E) Plots show GL7+Fas+ GC B cells gated on live B cells in spleen from WT and HET mice. (F) Graph shows the percentage of GC B cells (n = 8 each). *p < 0.05; **p < 0.005; and n.s., no significant difference, unpaired t test (B, D, and F); mean ± SEM.
Figure 6.
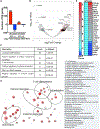
Figure 6.. Srsf1-deficient Treg cells display an aberrant transcriptomics profile
Total T cells were isolated from spleens of 8- to 10-week-old WT and T cell Srsf1-KO mice (n = 3 each). Natural Treg (nTreg) cells (CD4+CD25+CD127lo) were sorted by flow cytometry. nTreg cells were stimulated with anti-CD3, anti-CD28, and recombinant (r)IL-2 for 72 h. (A) RNA-sequencing data analysis shows differentially expressed (DE) genes with log2fold change (FC) differences at p < 0.05. (B) Volcano plot showing upregulated and downregulated genes in KO nTreg cells. (C) Table shows top pathways with gene counts identified by Gene Ontology (GO) term enrichment analysis of DE genes. (D) GO terms enrichment map shows clusters of top 50 pathways. The size of red circles indicates the number of genes within a pathway, and color represents p values relative to the other displayed terms. Outlines (added manually) indicate groups of similar GO terms. (E) Heatmap showing average expression of selected DE genes associated with T cell differentiation, cytokines, and chemokines.
Figure 7.
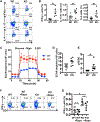
Figure 7.. Srsf1 deficiency leads to Treg cell plasticity with hyper-glycolytic metabolism and acquisition of an aberrant proinflammatory phenotype rescued by rapamycin
(A–H) Naive CD4 T cells were isolated from spleens of mice and cultured under Treg polarized condition for 72 h to generate induced Treg (iTreg) cells. (A) After 72 h, cells were stimulated with PMA and ionomycin with monensin, followed by surface and intracellular cytokine staining for flow cytometry. Plots show IL-17, IFN-γ, and IL-4 staining gated on CD4+CD25+Foxp3+ Treg cells. (B) Graphs show the percentage of cytokine-producing cells among CD4+CD25+Foxp3+ Treg cells (n = 5 each). (C) Glycolysis by induced Treg cells from WT and T cell Srsf1-KO mice was measured using extracellular acidification rate (ECAR) with injections glucose, oligomycin, and 2-Deoxyglucose (DG). Cells were counted for normalization. (D) Graph shows maximum glycolysis capacity calculated by subtracting the last measurement after 2-DG injection from the measurement before 2-DG injection (n = 6 each). (E) After 72-h polarization, additional stimulation with anti-CD3 (10 μg/mL) and anti-CD28 (10 μg/mL) for 5 min was performed. Total protein was immunoblotted for pS6 and total S6. Graph shows relative densitometry quantitation of pS6 and S6 (n = 7 each). (F) After 72-h polarization, iTreg cells were cultured for 4 h with PMA plus ionomycin with or without rapamycin (10 nM). Cells were collected, surface stained, fixed, and permeabilized for intracellular cytokine staining. Plots show IFN-γ intracellular staining gated on live Treg cells. (G) Graphs show average data from n = 4 mice in four independent experiments. *p < 0.05; and n.s., no significant difference, unpaired t test (B and E) or one-way ANOVA with Tukey’s correction (G); mean ± SEM.

Similar articles

Cited by

References

    1. Apostolidis SA, Rodríguez-Rodríguez N, Suárez-Fueyo A, Dioufa N, Ozcan E, Crispín JC, Tsokos MG, and Tsokos GC (2016). Phosphatase PP2A is requisite for the function of regulatory T cells. Nat. Immunol. 17, 556–564. - PMC - PubMed
    1. Battaglia M, Stabilini A, Migliavacca B, Horejs-Hoeck J, Kaupper T, and Roncarolo M-G (2006). Rapamycin promotes expansion of functional CD4+CD25+FOXP3+ regulatory T cells of both healthy subjects and type 1 diabetic patients. J. Immunol. 177, 8338–8347. - PubMed
    1. Bielli P, Bordi M, Di Biasio V, and Sette C (2014). Regulation of BCL-X splicing reveals a role for the polypyrimidine tract binding protein (PTBP1/hnRNP I) in alternative 5′ splice site selection. Nucleic Acids Res. 42, 12070–12081. - PMC - PubMed
    1. Chalfant CE, Rathman K, Pinkerman RL, Wood RE, Obeid LM, Ogretmen B, and Hannun YA (2002). De novo ceramide regulates the alternative splicing of caspase 9 and Bcl-x in A549 lung adenocarcinoma cells. Dependence on protein phosphatase-1. J. Biol. Chem. 277, 12587–12595. - PubMed
    1. Chapman NM, and Chi H (2015). mTOR Links Environmental Signals to T Cell Fate Decisions. Front. Immunol. 5, 686. - PMC - PubMed

Publication types