. 2021 Jul 7;13(15):19243-19259.
doi: 10.18632/aging.203243. Epub 2021 Jul 7.

Glioma stem cell-derived exosomal miR-944 reduces glioma growth and angiogenesis by inhibiting AKT/ERK signaling

Affiliations

Glioma stem cell-derived exosomal miR-944 reduces glioma growth and angiogenesis by inhibiting AKT/ERK signaling

Jianxin Jiang et al. Aging (Albany NY). .

Abstract

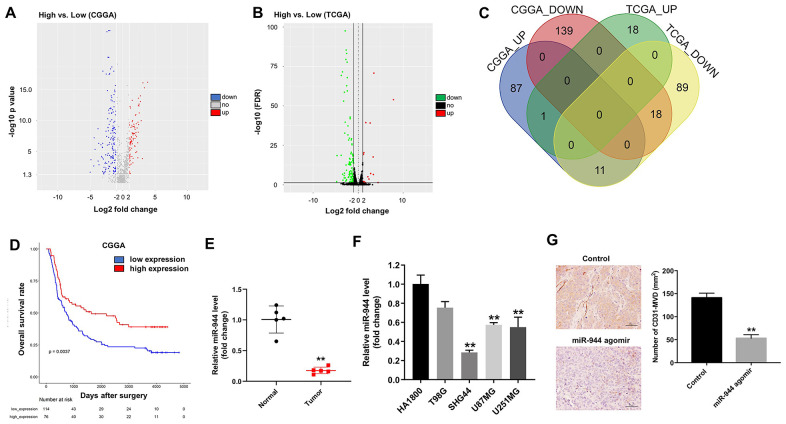
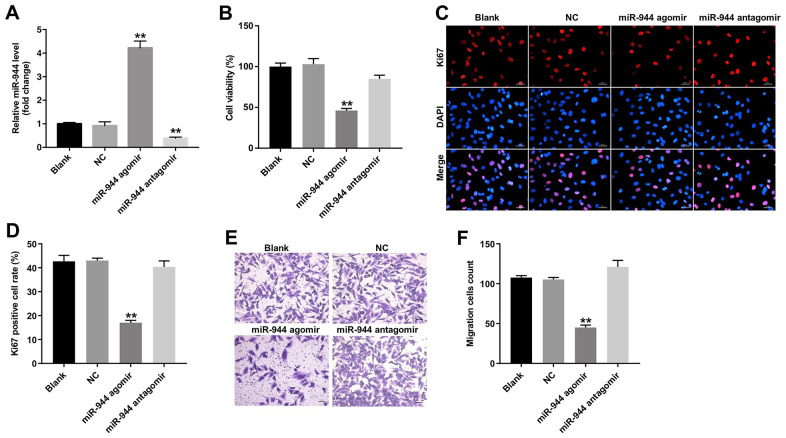
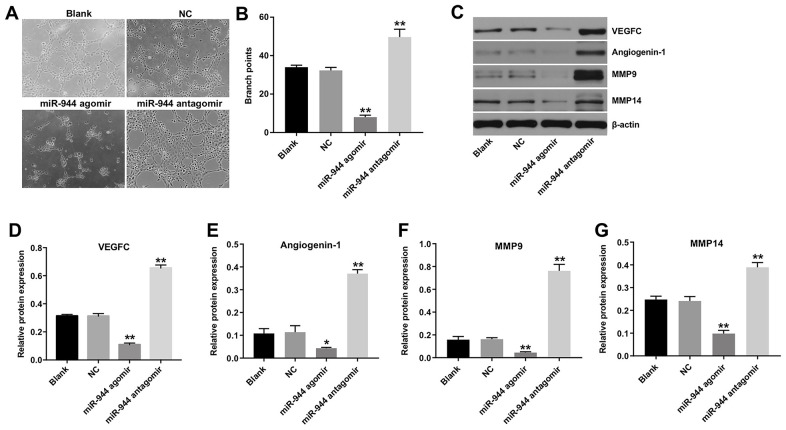
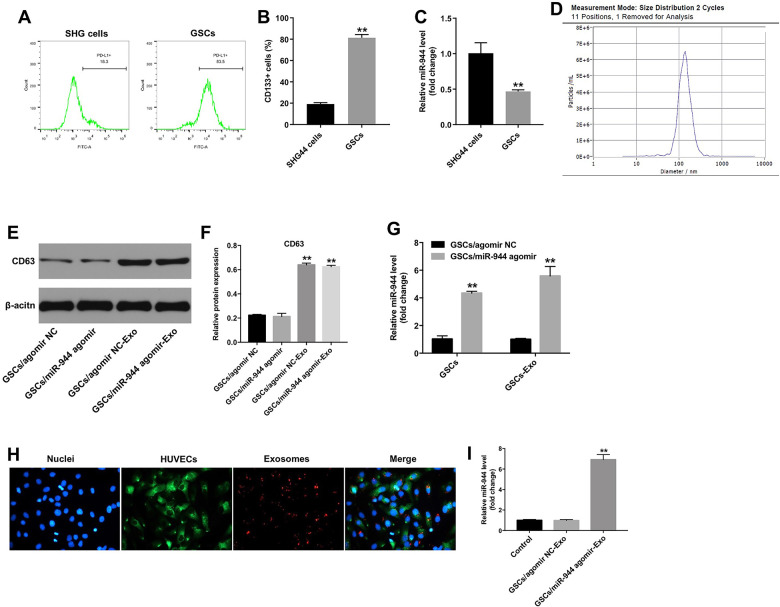
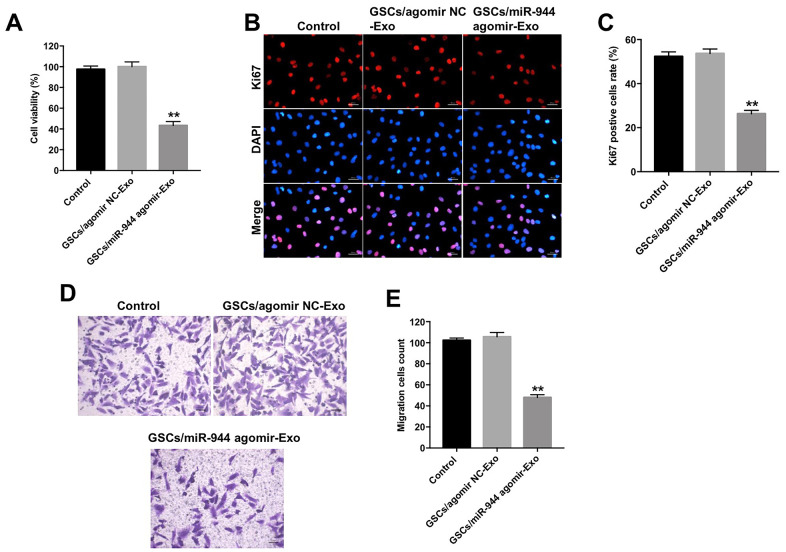
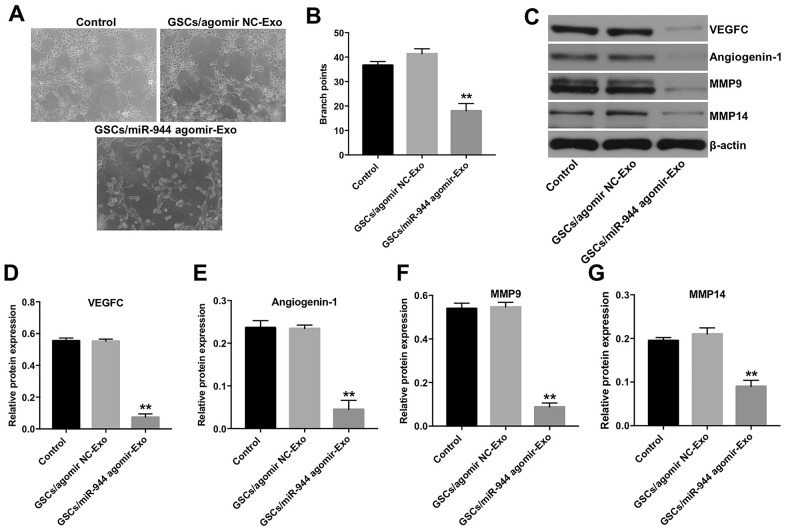
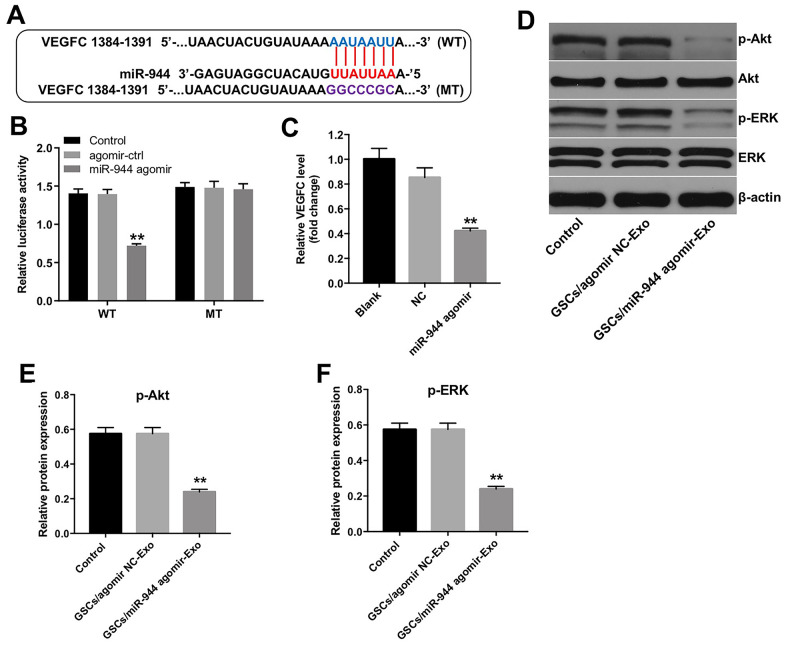
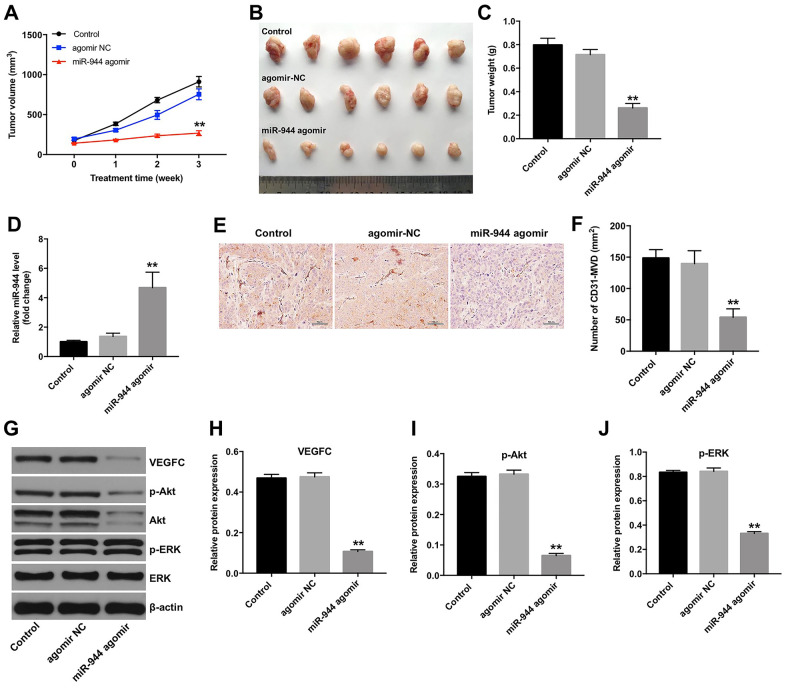
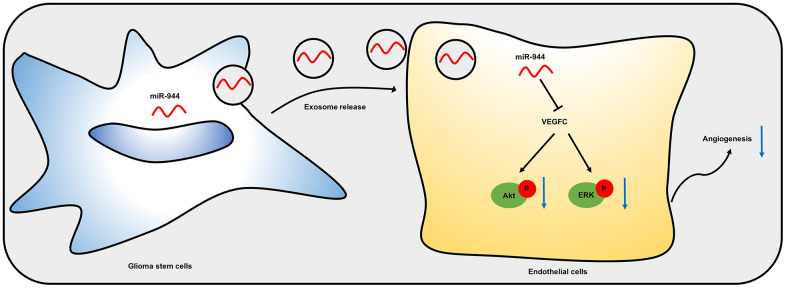
In this study, we investigated the regulatory role of exosomal microRNA-944 (miR-944) derived from glioma stem cells (GSCs) in glioma progression and angiogenesis. Bioinformatics analysis showed that miR-944 levels were significantly lower in high-grade gliomas (HGGs) than low-grade gliomas in the Chinese Glioma Genome Atlas and The Cancer Genome Atlas datasets. The overall survival rates were significantly shorter for glioma patients expressing low miR-944 levels than high miR-944 levels. GSC-derived exosomal miR-944 significantly decreased in vitro proliferation, migration, and tube formation by human umbilical vein endothelial cells (HUVECs). Targetscan and dual luciferase reporter assays demonstrated that miR-944 directly targets the 3'UTR of VEGFC. In vivo mouse studies demonstrated that injection of agomiR-944 directly into tumors 3 weeks after xenografting glioma cells significantly reduced tumor growth and angiogenesis. GSC-derived exosomal miR-944 significantly reduced VEGFC levels and suppressed activation of AKT/ERK signaling pathways in HUVECs and xenograft glioma cell tumors. These findings demonstrate that GSC-derived exosomal miR-944 inhibits glioma growth, progression, and angiogenesis by suppressing VEGFC expression and inhibiting the AKT/ERK signaling pathway.

Keywords: VEGFC; angiogenesis; exosome; glioma stem cells; microRNA-944.


Conflict of interest statement

CONFLICTS OF INTEREST: The authors declare that they have no conflicts of interest.

Figures

Figure 1
Figure 1
Identification of differentially expressed miRNAs in gliomas from CGGA and TCGA datasets. (A, B) Volcano plots show upregulated (red dots) and downregulated (blue dots) miRNAs in the glioma datasets from (A) CGGA and (B) TCGA databases. (C) Venn diagram shows the numbers of upregulated and downregulated miRNAs or DEMs that are common to both CGGA and TCGA datasets. (D) Kaplan-Meier survival curves show overall survival of glioma patients with low (n=114; blue line) or high (n=76; red line) miR-944 expression in the CGGA dataset. (E) RT-qPCR analysis shows miR-944 expression in glioma tissues and adjacent normal tissues. **P < 0.01 vs. Normal group. (F) RT-qPCR analysis shows miR-944 expression in HA1800 cells and human glioma cell lines, T98G, SHG44, U87MG, and U251MG. **P < 0.01 compared to the HA1800 group. (G) Immunohistochemical (IHC) staining results show CD31 staining of xenograft glioma cell tumor tissues derived from subcutaneous injections of SHG44 cells into nude mice. As shown, positive CD31 staining shows microvessel density in control, agomiR-944- or agomiR-NC-injected xenograft glioma cell tumors at 3 weeks. The tumors were directly injected with 50 nM agomiR-944 or agomiR-NC, twice every week for 3 weeks. **P < 0.01 vs. control group.
Figure 2
Figure 2
Overexpression of miR-944 inhibits proliferation and migration of HUVECs. (A) RT-qPCR analysis shows miR-944 expression in blank control, and agomiR-NC, agomiR-944, and antagomiR-944-transfected HUVECs. (B) CCK-8 assay results show viability of blank control, agomiR-NC-, agomiR-944-, and antagomiR-944-transfected HUVECs. (C, D) Immunofluorescence assay results demonstrate staining of blank control, and agomiR-NC-, agomiR-944-, and antagomiR-944-transfected HUVECs with anti-Ki67 antibody to determine the percentage of Ki67-positive HUVECs. Note: Ki67 is a proliferation marker. (E, F) Transwell migration assay results demonstrate the migration ability of blank control, and agomiR-NC-, agomiR-944-, and antagomiR-944-transfected HUVECs. **P < 0.01 vs. NC group. HUVECs, human umbilical vein endothelial cells; NC, negative control.
Figure 3
Figure 3
Overexpression of miR-944 inhibits angiogenesis of HUVECs. (A, B) Tube formation assay results show the number of branch points as an index of angiogenesis in blank control, and agomiR-NC-, agomiR-944-, and antagomiR-944-transfected HUVECs. (CG) Western blot analysis shows the relative expression levels of (C, D) VEGF, (C, E) angiogenin-1, (C, F) MMP9, and (C, G) MMP14 proteins in blank control, and agomiR-NC, agomiR-944, and antagomiR-944-transfected HUVECs. *P < 0.05, **P < 0.01 vs. NC group. NC, negative control; HUVECs, human umbilical vein endothelial cells.
Figure 4
Figure 4
Exosomes transport GSC-derived miR-944 to HUVECs. (A, B) Flow cytometry analysis shows isolation and enrichment of CD133+ GSCs from SHG44 cells. ** denotes P < 0.01 vs. SHG44 cell group. (C) RT-qPCR analysis shows miR-944 levels in SHG44 cells and CD133+ GSCs. **P < 0.01 vs. SHG44 cell group. (D) NTA results show mean diameter of exosomes isolated from the conditioned medium of agomiR-944-transfected GSCs. (E, F) Western blotting analysis shows CD63 levels in agomir-NC-transfected GSCs (GSC/agomiR-NC), agomiR-944-transfected GSCs (GSC/agomiR-944), GSC/agomir-NC-derived exosomes (GSC/agomiR-NC-Exo), and GSC/agomiR-944 agomir-derived exosomes (GSC/agomiR-944-Exo). **P < 0.01 vs. the GSC/agomiR-NC group. (G) RT-qPCR analysis shows miR-944 expression levels in GSC/agomiR-NC, GSC/agomiR-944, GSC/agomiR-NC-Exo, and GSC/agomiR-944-Exo. **P < 0.01 vs. the GSC/agomir-NC group. (H) Confocal microscopy images show exosomes and their uptake into HUVECs. Exosomes are stained with PKH67 (red color); HUVECs are stained with phalloidin-FITC (green color); nuclei are stained with DAPI (blue color). (I) RT-qPCR analysis shows miR-944 levels in HUVECs co-cultured with GSC/agomiR-NC-Exo or GSC/agomiR-944-Exo. **P < 0.01 vs. the GSC/agomir-NC-exo group. GSCs, glioma stem cells; HUVECs, human umbilical vein endothelial cells.
Figure 5
Figure 5
Exosomal miR-944 derived from GSCs suppresses proliferation and migration of HUVECs. (A) CCK-8 assay results show viability of HUVECs co-cultured with GSCs/agomiR-NC-Exo and GSCs/agomiR-944-Exo for 24 h. (B, C) Immunofluorescence assay results show the proliferation status of HUVECs co-cultured with GSCs/ agomiR-NC-Exo and GSCs/agomiR-944-Exo for 24 h based on Ki-67 staining. (D, E) Transwell assay results show the migration ability of HUVECs co-cultured with GSCs/agomiR-NC-Exo and GSCs/agomiR-944-Exo for 24 h. **P < 0.01 vs. the GSCs/agomiR-NC-exo group. GSCs, glioma stem cells; HUVECs, human umbilical vein endothelial cells.
Figure 6
Figure 6
Exosomal miR-944 derived from GSCs suppresses angiogenesis of HUVECs. (A, B) Tube formation assay results show the number of branch points as an index of angiogenesis in HUVECs co-cultured with GSC/agomiR-NC-Exo and GSC/agomiR-944-Exo for 24 h. (CG) Western blot analysis shows levels of (C, D) VEGF, (C, E) angiogenin-1, (C, F) MMP9, and (C, G) MMP14 in HUVECs co-cultured with GSC/agomiR-NC-Exo and GSC/agomiR-944-Exo for 24 h. β-actin was used as an internal control. **P < 0.01 vs. the GSC/agomiR-NC-Exo group. GSCs, glioma stem cells; HUVECs, human umbilical vein endothelial cells.
Figure 7
Figure 7
Exosomal miR-944 derived from GSCs suppresses angiogenesis of HUVECs by targeting VEGFC. (A) Targetscan analysis results show miR-944 binding sites in the 3’UTR of VEGFC. The mutated miR-944 binding site in the 3’UTR of VEGFC is also shown. (B) Dual luciferase reporter assay results show relative luciferase activity in HUVECs co-transfected with agomiR-NC or agomiR-944 plus luciferase vector with VEGFC-3’UTR-WT or VEGFC-3’UTR-MUT. A blank control was also included. **P < 0.01 vs. the agomir-ctrl group. (C) RT-qPCR analysis shows VEGFC levels in HUVECs transfected with agomiR-NC or agomiR-944. **P < 0.01 vs. the agomiR-NC group. (DF) Western blot analysis shows expression levels of p-Akt, Akt, p-ERK, and ERK in HUVECs co-cultured with GSC/agomiR-NC-Exo and GSC/agomiR-944-Exo for 24 h. The relative expression levels of p-Akt and p-ERK in HUVECs were normalized to total Akt and total ERK levels, respectively. **P < 0.01 vs. the GSC/agomiR-NC-Exo group. NC, negative control; GSCs, glioma stem cells; HUVECs, human umbilical vein endothelial cells.
Figure 8
Figure 8
Overexpression of miR-944 inhibits in vivo xenograft glioma cell tumor growth and angiogenesis. (A) The line graph shows tumor volumes on weeks 1-3 in control, agomiR-NC, and agomiR-944 group nude mice. (B) The photographs show xenograft glioma cell tumors harvested at four weeks from control, agomiR-NC, and agomiR-944 group nude mice. (C) The histogram shows the weights of xenograft glioma cell tumors harvested at four weeks from control, agomiR-NC, and agomiR-944 group nude mice. (D) RT-qPCR analysis shows miR-944 levels in the xenograft glioma cell tumor tissues harvested from nude mice belonging to the control, agomiR-NC, and agomiR-944 groups. (E, F) IHC staining results show CD31-stained xenograft glioma cell tumor tissues harvested from nude mice belonging to the control, agomiR-NC, and agomiR-944 groups. Microvessel density (MVD) was analyzed based on CD31+ve staining. (GJ) Western blot analysis shows the levels of VEGFC, p-Akt, Akt, p-ERK, and ERK proteins in the xenograft glioma cell tumor tissues harvested from control, agomiR-NC, and agomiR-944 groups. VEGFC, p-Akt, and p-ERK levels were normalized to β-actin, Akt and ERK levels, respectively. **P < 0.01 vs. the agomiR-NC group; NC, negative control; MVD, microvessel density; IHC, immunohistochemistry.
Figure 9
Figure 9
A schematic model shows mechanistic role of miR-944 in glioma angiogenesis. Exosomal miR-944 derived from GSCs reduces angiogenesis of HUVECs by inhibiting VEGFC expression and suppressing the activation of Akt/ERK signaling pathways.

Similar articles

Cited by

References

    1. Jin J, Zhang S, Hu Y, Zhang Y, Guo C, Feng F. SP1 induced lncRNA CASC11 accelerates the glioma tumorigenesis through targeting FOXK1 via sponging miR-498. Biomed Pharmacother. 2019; 116:108968. 10.1016/j.biopha.2019.108968 - DOI - PubMed
    1. Chang Y, Wu Q, Tian T, Li L, Guo X, Feng Z, Zhou J, Zhang L, Zhou S, Feng G, Han F, Yang J, Huang F. The influence of SRPK1 on glioma apoptosis, metastasis, and angiogenesis through the PI3K/Akt signaling pathway under normoxia. Tumour Biol. 2015; 36:6083–93. 10.1007/s13277-015-3289-2 - DOI - PubMed
    1. Chen X, Yang F, Zhang T, Wang W, Xi W, Li Y, Zhang D, Huo Y, Zhang J, Yang A, Wang T. MiR-9 promotes tumorigenesis and angiogenesis and is activated by MYC and OCT4 in human glioma. J Exp Clin Cancer Res. 2019; 38:99. 10.1186/s13046-019-1078-2 - DOI - PMC - PubMed
    1. Liu S, Liu H, Deng M, Wang H. MiR-182 promotes glioma progression by targeting FBXW7. J Neurol Sci. 2020; 411:116689. 10.1016/j.jns.2020.116689 - DOI - PubMed
    1. Malzkorn B, Reifenberger G. Practical implications of integrated glioma classification according to the World Health Organization classification of tumors of the central nervous system 2016. Curr Opin Oncol. 2016; 28:494–501. 10.1097/CCO.0000000000000327 - DOI - PubMed

Publication types

MeSH terms