. 2021 Nov 1;106(11):2990-2994.
doi: 10.3324/haematol.2021.278692.

Aurora A kinase as a target for therapy in TCF3-HLF rearranged acute lymphoblastic leukemia

Affiliations

Aurora A kinase as a target for therapy in TCF3-HLF rearranged acute lymphoblastic leukemia

Jessica Leonard et al. Haematologica. .
No abstract available


Figures

Figure 1.
Figure 1.
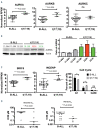
Sensitivity of TCF3-HLF ALL to AURKA inhibition. (A) Expression levels of AUK kinases within TCF3-HLF acute lymphoblastic leukemia (ALL) samples from RNA sequencing (RNA-seq) analysis. RPKM (reads per kilo base per million mapped reads) levels of AURKA, AURKB and AURKC were compared between t(17;19) and remaining B-cell acute lymphoblastic leukemia (B-ALL) samples by two-tailed student’s t-test. (B) Protein expression of AURKA in ALL. Protein extract from three primary B-ALL xenograft samples (11-064, TCF3-PBX1; 11-504, KMT2A-rearranged; 12-225, BCR-ABL1) were compared to three t(17;19) TCF3-HLF ALL xenograft samples by immunoblot (green denotes type 1 fusions, while red denotes type 2 fusions). Cell lysate was extracted and separated by standard SDS-PAGE. Protein was then transferred to PVDF membranes and immunoblotted using anti-AURKA or anti-actin. Three independent blots for each sample were quantified and AURK level for each sample was normalized to actin. Comparison of the level of AURK to each sample was normalized to the level of AURK in 11-064. Green column indicates type 1 samples, red column indicates type 2. ANOVA ***P=0.0033. (C) Expression from RNA-seq analysis comparing RPKM levels of BIRC5 and INCENP between t(17;19) and remaining ALL samples by two-tailed student’s t-test. Graphic representation of asynchronous populations within the cell cycle. Cells were fixed in 70% methanol, then stained with propidium iodide (PI), and analyzed for DNA content by flow cytometry. Comparison of the percentage of cells in G1, S and G2/M were performed from three B-ALL xenografted samples compared to three TCF3-HLF ALL samples using two-tailed student’s t-test. (D) Half maximal inhibitory concentration (IC50) comparison of alisertib and YM155 between t(17;19) and remaining ALL samples by two-tailed student’s t-test.
Figure 2.
Figure 2.
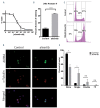
Alisertib effects on TCF3-HLF HAL01 acute lymphoblastic leukemia cells. (A) Dose-response to varying concentrations of alisertib. Cells were exposed to alisertib for 3 days then assessed for viability with MTS. Viability was normalized to untreated cells. All data points were performed in triplicate. (B) Assessment of apoptosis with annexin V staining. Cells were exposed to 100 nM alisertib (IC90) for 24 hours, then assessed for annexin V staining using Guava Nexin within the population of cells. All data points were performed in triplicate and compared by unpaired student’s t-test (****P<0.0001). (C) G2/M cell cycle arrest after exposure to alisertib. HAL01 cells were incubated with 100 nM alisertib for 24 hours, fixed with 70% methanol and stained with propidium iodide (PI), then analyzed by flow cytometry for PI intensity. (D) Immunocytochemical fluorescence of AURKA within an asynchronous population of cells. HAL01 cells were exposed to 100 nM alisertib for 24 hours in culture, then fixed with 4% paraformaldehyde, permeabilized with triton X-100 and stained with rabbit anti- AURKA, mouse anti-a-tubulin, secondary anti-rabbit FITC, secondary anti-mouse Texas Red, and DAPI. (E) Quantification of cells with spindle poles. Within an asynchronous population, the number of nuclei with 0 (none), 1 (single), 2 (double), or more (>2) spindle poles were counted. Each population was compared by an unpaired student’s t-test (*P<0.05).
Figure 3.
Figure 3.
In vivo response of TCF3-HLF acute lymphoblastic leukemia xenografts. Kaplan-Meier plots for event-free-survival (EFS) comparing control to drug treated cohorts of five separate TCF3-HLF acute lymphoblastic leukemia (ALL) samples. Cohorts of five animals were injected with 1x10⁶ leukemia cells per animal by tail vein. Within the first week there was some attrition due to animal loss in samples 3.316, 3.332, and 3.310 (where n= the number of animals per cohort). One week after injection cohorts of four to five individuals began treatment with vehicle (control), dasatinib (40 mg/kg/day), venetoclax (25 mg/kg/day), combination of dasatinib (40 mg/kg/day) and venetoclax (25 mg/kg/day) (das/ven), or alisertib (30 mg/kg/day) by oral gavage for 5 days each week. Animals were monitored weekly for peripheral blood chimerism for human CD45 and murine CD45 by flow cytometry and daily well-being. An event was defined as peripheral blood chimerism ≥10% or if the animal became moribund. The top row represents type 1 TCF3-HLF rearrangements, while the bottom row represents type 2 rearrangements. Statistical comparison performed by log-rank test (*P<0.05; **P<0.01).

References

    1. Gu Z, Churchman ML, Roberts KG, et al. . PAX5-driven subtypes of B-progenitor acute lymphoblastic leukemia. Nat Genet. 2019; 51(2):296-307. - PMC - PubMed
    1. Glover JM, Loriaux M, Tyner JW, Druker BJ, Chang BH. In vitro sensitivity to dasatinib in lymphoblasts from a patient with t(17;19)(q22;p13) gene rearrangement pre-B acute lymphoblastic leukemia. Pediatr Blood Cancer. 2012;59(3):576-579. - PMC - PubMed
    1. Fischer U, Forster M, Rinaldi A, et al. . Genomics and drug profiling of fatal TCF3-HLF-positive acute lymphoblastic leukemia identifies recurrent mutation patterns and therapeutic options. Nat Genet. 2015;47(9):1020-1029. - PMC - PubMed
    1. Frismantas V, Dobay MP, Rinaldi A, et al. . Ex vivo drug response profiling detects recurrent sensitivity patterns in drug-resistant acute lymphoblastic leukemia. Blood. 2017;129(11):e26-e37. - PMC - PubMed
    1. Panagopoulos I, Micci F, Thorsen J, et al. . A novel TCF3-HLF fusion transcript in acute lymphoblastic leukemia with a t(17;19)(q22;p13). Cancer Genet. 2012;205(12):669-672. - PubMed

Publication types

MeSH terms

Substances