

Predicting the pathological grade of breast phyllodes tumors: a nomogram based on clinical and magnetic resonance imaging features
- PMID: 34233487
- PMCID: PMC8764923
- DOI: 10.1259/bjr.20210342
Predicting the pathological grade of breast phyllodes tumors: a nomogram based on clinical and magnetic resonance imaging features
Abstract
Objective: To explore the potential factors related to the pathological grade of breast phyllodes tumors (PTs) and to establish a nomogram to improve their differentiation ability.
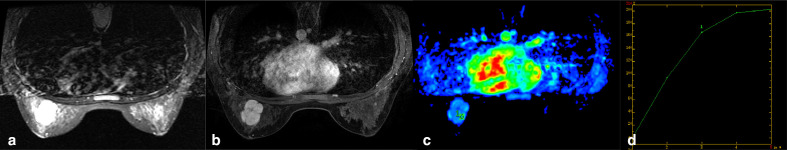
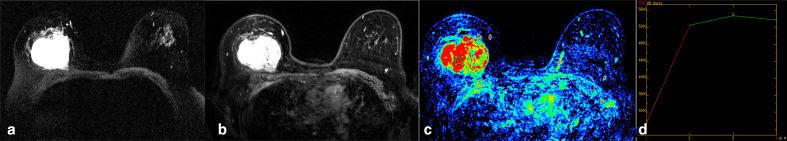
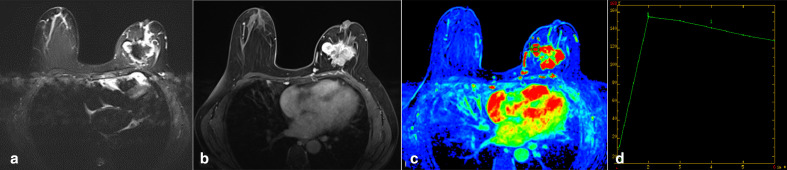
Methods: Patients with PTs diagnosed by post-operative pathology who underwent pretreatment magnetic resonance imaging (MRI) from January 2015 to June 2020 were retrospectively reviewed. Traditional clinical features and MRI features evaluated according to the fifth BI-RADS were analyzed by statistical methods and introduced to a stepwise multivariate logistic regression analysis to develop a prediction model. Then, a nomogram was developed to graphically predict the probability of non-benign (borderline/malignant) PTs.
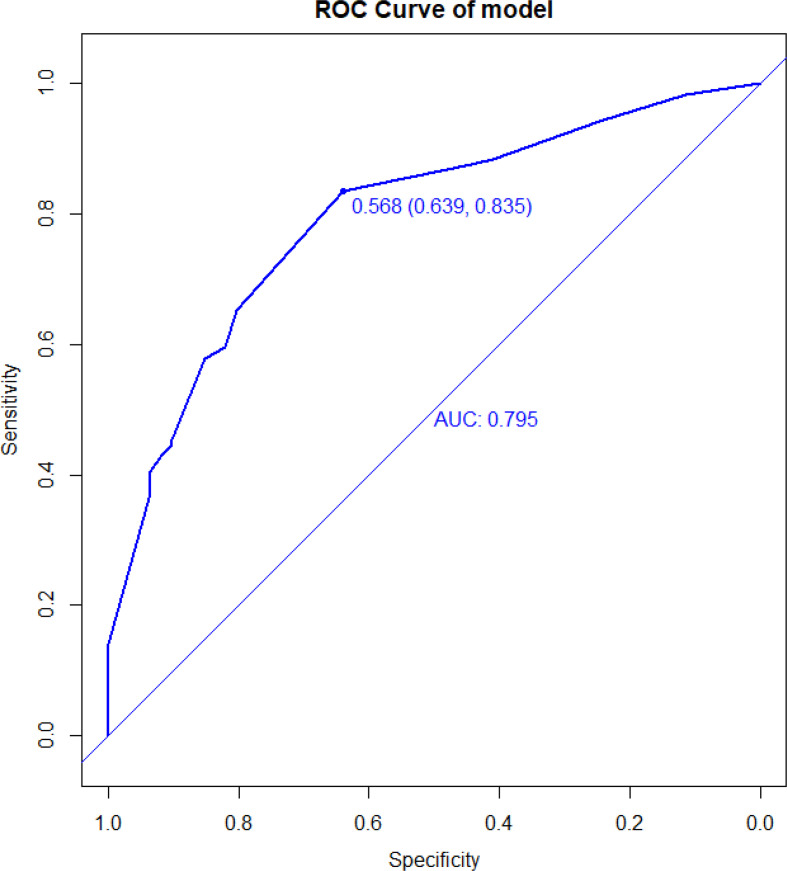
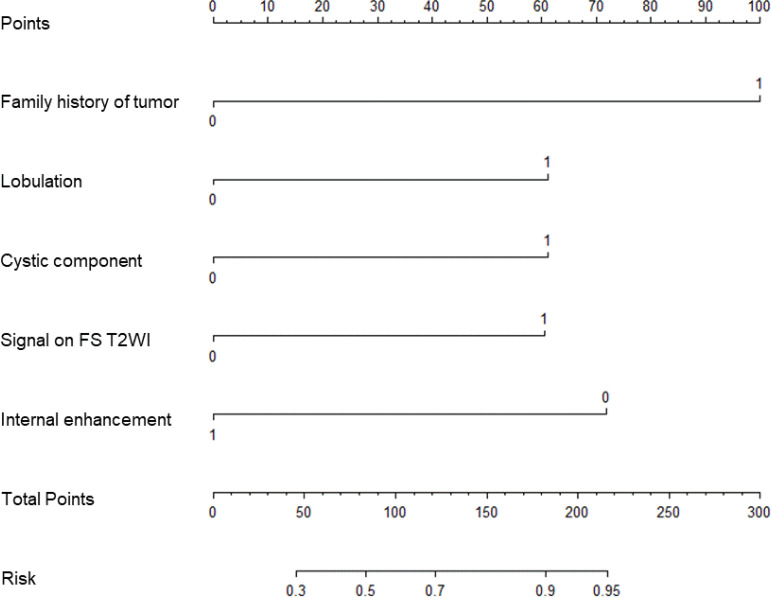
Results: Finally, 61 benign, 73 borderline and 48 malignant PTs were identified in 182 patients. Family history of tumor, diameter, lobulation, cystic component, signal on fat saturated T2 weighted imaging (FS T2WI), BI-RADS category and time-signal intensity curve (TIC) patterns were found to be significantly different between benign and non-benign PTs. The nomogram was finally developed based on five risk factors: family history of tumor, lobulation, cystic component, signal on FS T2WI and internal enhancement. The AUC of the nomogram was 0.795 (95% CI: 0.639, 0.835).
Conclusion: Family history of tumor, lobulation, cystic components, signals on FS T2WI and internal enhancement are independent predictors of non-benign PTs. The prediction nomogram developed based on these features can be used as a supplemental tool to pre-operatively differentiate PTs grades.
Advances in knowledge: More sample size and characteristics were used to explore the factors related to the pathological grade of PTs and establish a predictive nomogram for the first time.
Figures
Similar articles
-
Can whole-tumor apparent diffusion coefficient histogram analysis be helpful to evaluate breast phyllode tumor grades?Eur J Radiol. 2019 May;114:25-31. doi: 10.1016/j.ejrad.2019.02.035. Epub 2019 Feb 27. Eur J Radiol. 2019. PMID: 31005172
-
Value of conventional magnetic resonance imaging texture analysis in the differential diagnosis of benign and borderline/malignant phyllodes tumors of the breast.Cancer Imaging. 2021 Mar 12;21(1):29. doi: 10.1186/s40644-021-00398-3. Cancer Imaging. 2021. PMID: 33712070 Free PMC article.
-
Pretreatment Multiparametric MRI-Based Radiomics Analysis for the Diagnosis of Breast Phyllodes Tumors.J Magn Reson Imaging. 2023 Feb;57(2):633-645. doi: 10.1002/jmri.28286. Epub 2022 Jun 3. J Magn Reson Imaging. 2023. PMID: 35657093
-
A retrospective review of phyllodes tumors of the breast from a single institution.Breast Dis. 2021;40(S1):S63-S70. doi: 10.3233/BD-219009. Breast Dis. 2021. PMID: 34092583 Review.
-
Local Recurrence of Benign, Borderline, and Malignant Phyllodes Tumors of the Breast: A Systematic Review and Meta-analysis.Ann Surg Oncol. 2019 May;26(5):1263-1275. doi: 10.1245/s10434-018-07134-5. Epub 2019 Jan 7. Ann Surg Oncol. 2019. PMID: 30617873
Cited by
-
Differentiation between Phyllodes Tumors and Fibroadenomas through Breast Ultrasound: Deep-Learning Model Outperforms Ultrasound Physicians.Sensors (Basel). 2023 May 26;23(11):5099. doi: 10.3390/s23115099. Sensors (Basel). 2023. PMID: 37299826 Free PMC article.
-
Expression of amine oxidase-related proteins in breast phyllodes tumor.Histol Histopathol. 2025 Jan;40(1):39-47. doi: 10.14670/HH-18-773. Epub 2024 Jun 4. Histol Histopathol. 2025. PMID: 38887035
-
Editorial for "Pretreatment Multiparametric MRI-Based Radiomics Analysis for the Diagnosis of Breast Phyllodes Tumors".J Magn Reson Imaging. 2023 Feb;57(2):646-647. doi: 10.1002/jmri.28285. Epub 2022 Jun 5. J Magn Reson Imaging. 2023. PMID: 35661474 Free PMC article. No abstract available.
-
An Update on the General Features of Breast Cancer in Male Patients-A Literature Review.Diagnostics (Basel). 2022 Jun 26;12(7):1554. doi: 10.3390/diagnostics12071554. Diagnostics (Basel). 2022. PMID: 35885460 Free PMC article. Review.
-
Prognostic factors of breast phyllodes tumors.Histol Histopathol. 2023 Aug;38(8):865-878. doi: 10.14670/HH-18-600. Epub 2023 Feb 27. Histol Histopathol. 2023. PMID: 36866915 Review.
References
-
- Lakhani SE, Schnitt SJ, Tan PH, van de Vijver MJ. editors.World Health Organization Classification of Tumours of the Breast. IARC Press: Lyon; 2012.
MeSH terms
LinkOut - more resources
Full Text Sources
Medical
