

The empirical formula for calculating the incident air Kerma in intraoral radiographic imaging
- PMID: 34233497
- PMCID: PMC8611282
- DOI: 10.1259/dmfr.20210117
The empirical formula for calculating the incident air Kerma in intraoral radiographic imaging
Abstract
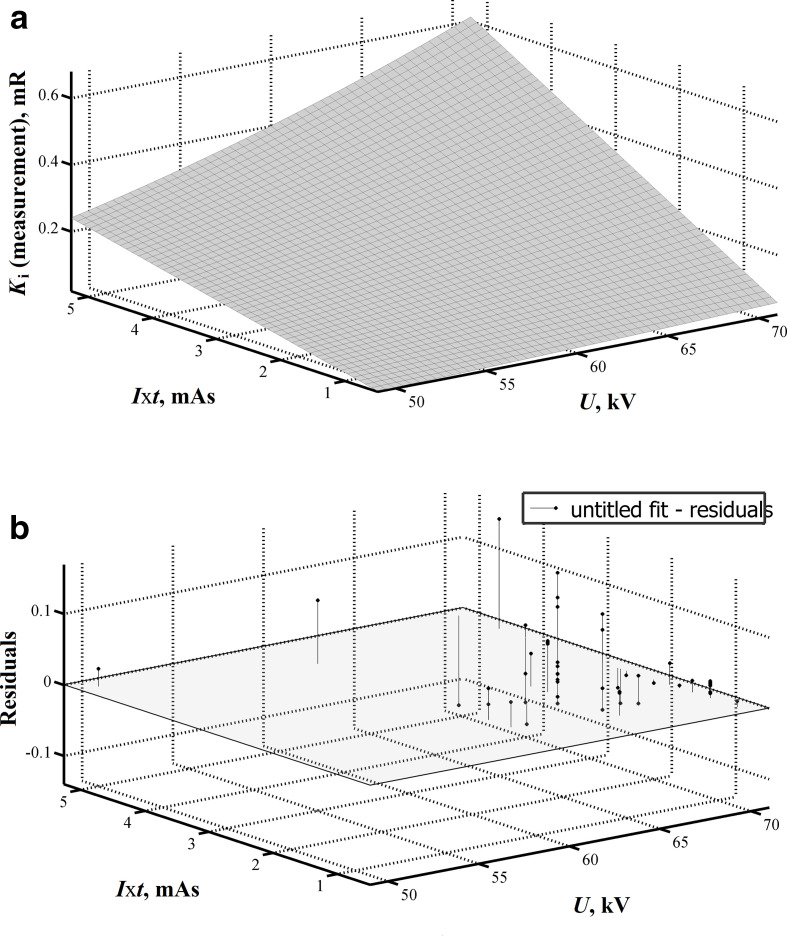
Objectives: The aim of this paper is to determine the empirical formula for calculating the incident air kerma (Ki), used as a patient dose descriptor in the intraoral radiographic imaging.
Methods: The data for the formula were collected during the regular annual inspection of intraoral dental X-ray units in 2018, 2019 and early 2020. The measurement data of 50 X-ray units were processed to develop the formula. Exposure factors for imaging molars of the upper jaw of an average patient in a clinical setting were used in the measurement. The formula validity was statistically evaluated using coefficient of correlation, standard error of the fitted function and the mean relative percentage deviation.
Results: The measurement values of the radiation doses and calculated values obtained by using the final formula showed good agreement - the mean relative percentage deviation values less than ±15%.
Conclusions: Although there are differences in X-ray units, voltages, manufacturers and device architectures (single-phase and high-frequency), the measurement data comply well with computed ones in all cases.
Keywords: Air kerma; Dental x-ray; Intraoral; Ionising Radiation.
Figures

Similar articles
-
Evaluation of stray radiation to the operator for five hand-held dental X-ray devices.Dentomaxillofac Radiol. 2019 Jul;48(5):20180301. doi: 10.1259/dmfr.20180301. Epub 2019 Feb 12. Dentomaxillofac Radiol. 2019. PMID: 30694078 Free PMC article.
-
Patient radiation doses in intraoral and panoramic X-ray examinations in Sudan.Phys Med. 2018 Feb;46:148-152. doi: 10.1016/j.ejmp.2018.01.017. Epub 2018 Feb 7. Phys Med. 2018. PMID: 29519401
-
INTRAORAL DENTAL X-RAY RADIOGRAPHY IN BOSNIA AND HERZEGOVINA: STUDY FOR REVISING DIAGNOSTIC REFERENCE LEVEL VALUE.Radiat Prot Dosimetry. 2020 Aug 3;190(1):90-99. doi: 10.1093/rpd/ncaa081. Radiat Prot Dosimetry. 2020. PMID: 32744623
-
Panoramic radiography in dental diagnostics.Swed Dent J Suppl. 1996;119:1-26. Swed Dent J Suppl. 1996. PMID: 8971997 Review.
-
Review of reconstruction of radiation incident air kerma by measurement of absorbed dose in tooth enamel with EPR.Radiat Prot Dosimetry. 2012 Mar;149(1):71-8. doi: 10.1093/rpd/ncr446. Epub 2011 Nov 28. Radiat Prot Dosimetry. 2012. PMID: 22128353 Review.
References
-
- United Nations Scientific Committee on the Effects of Atomic Radiation .Sources and effect of ionizing radiation. UNSCEAR 2008 Report, Vol. 1. New York: United Nations; 2008. http://www.unscear.org/docs/reports/2008/09-86753_Report_2008_Annex_A.pdf.
-
- Commission E. Radiation protection No. 180. Medical radiation exposure of the european population. 2014. Available from: https://ec.europa.eu/energy/content/rp-180-medical-radiation-exposure-eu....
-
- Košutić D, Božović P. Distribution of X ray units in Serbia. XXVII symposium DZZ SCG, Vrnjačka Banja, Serbia. In: In Proc. XXVII Symposium DZZ SCG, Vrnjačka Banja, Serbia; 2013. pp. 197–200.
-
- Mirkov Z. Quality control in dental radiology in Serbia: preliminary results. Rad Conference Proceedings 2017; 2: 95–8.
-
- Bushberg JT, Seibert JA, Leidholdt EM, Boone JM. The essential physics for medical imaging (2nd edn). Philadelphia, USA: Lippincott Williams & Wilkins Publisher; 2002.
