. 2021 Jul 7;21(1):784.
doi: 10.1186/s12885-021-08344-z.

MCM6 indicates adverse tumor features and poor outcomes and promotes G1/S cell cycle progression in neuroblastoma

Affiliations

MCM6 indicates adverse tumor features and poor outcomes and promotes G1/S cell cycle progression in neuroblastoma

Yaoyao Gu et al. BMC Cancer. .

Abstract

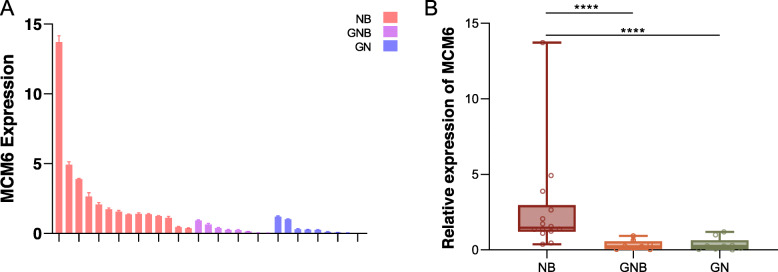
Background: Minichromosome maintenance complex component 6 (MCM6), as an important replication permission factor, is involved in the pathogenesis of various tumors. Here we studied the expression of MCM6 in neuroblastoma and its influence on tumor characteristics and prognosis.

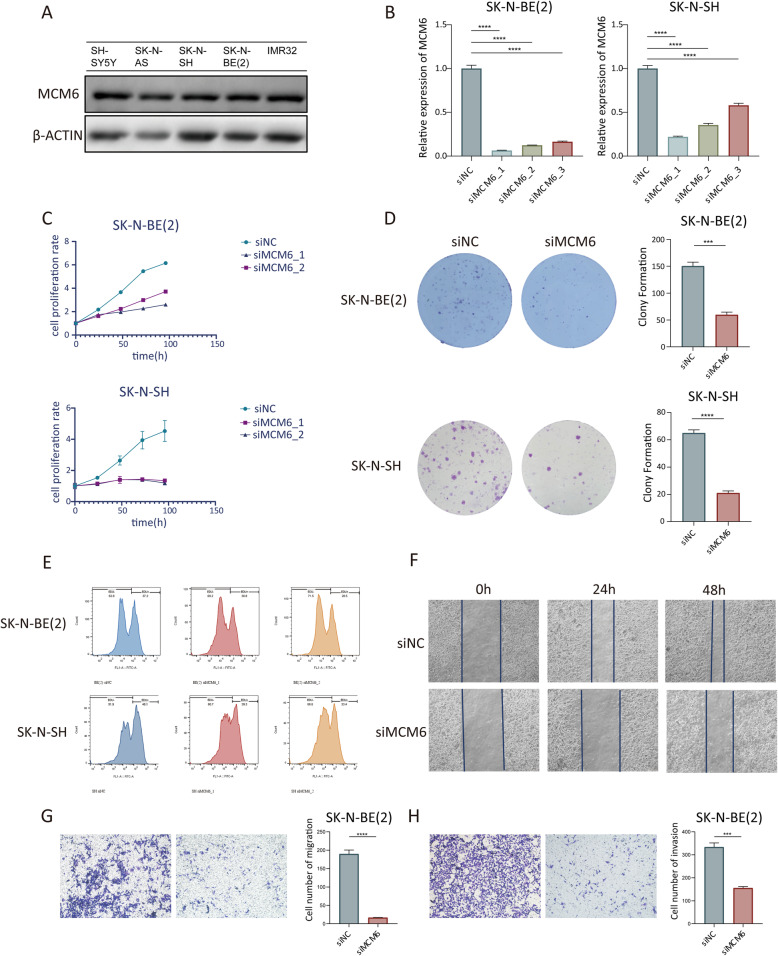
Methods: Publicly available datasets were used to explore the influence of the differential expression of MCM6 on neuroblastoma tumor stage, risk and prognosis. In cell experiments, human neuroblastoma cell lines SK-N-SH and SK-N-BE [ (2)] were utilized to verify the ability of MCM6 to promote cell proliferation, migration and invasion. We further explored the possible molecular mechanism of MCM6 affecting the phenotype of neuroblastoma cells by mutual verification of RNA-seq and western blotting, and flow cytometry to inquire about its potential specific roles in the cell cycle.

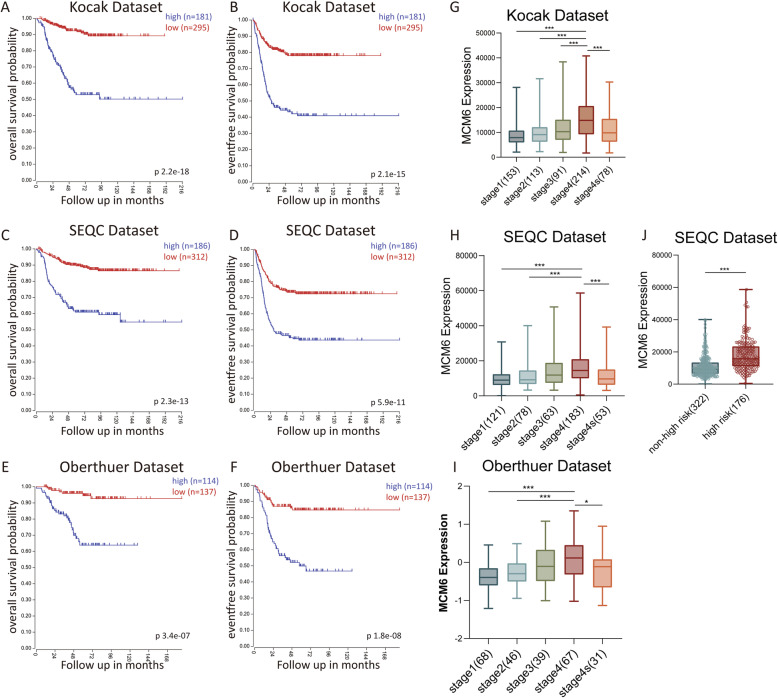
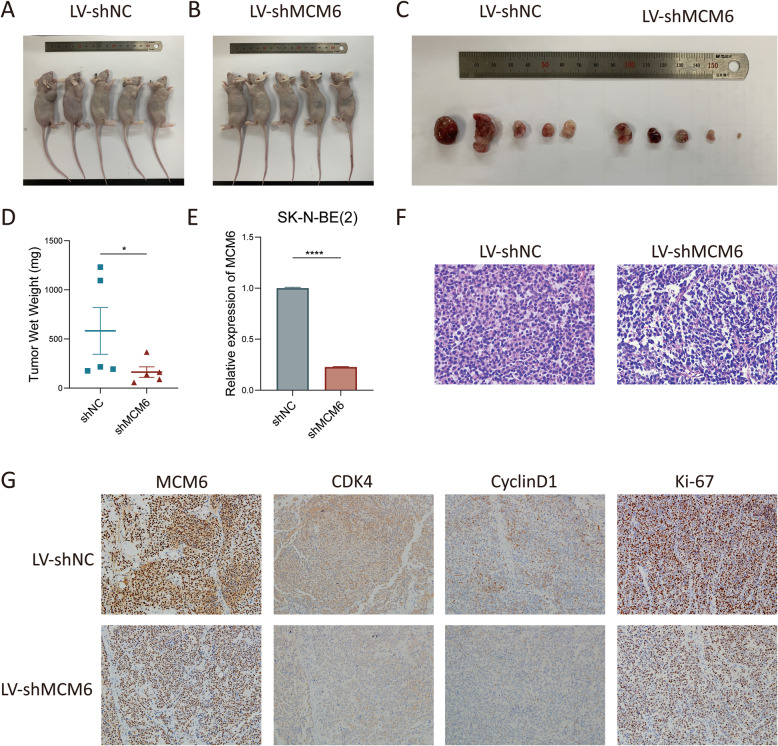
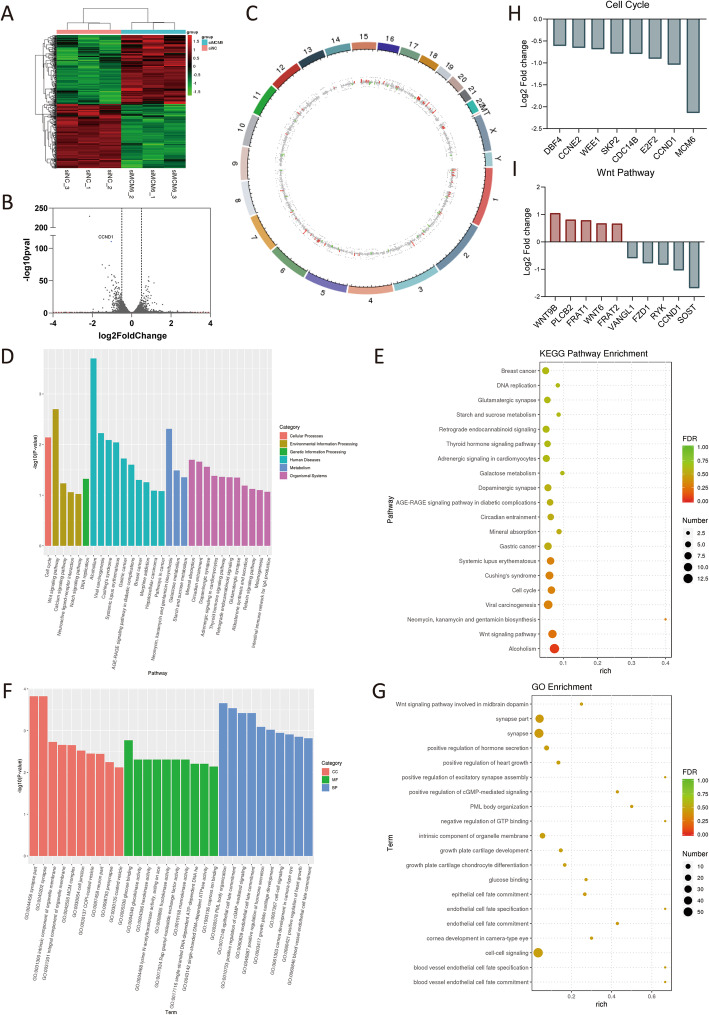
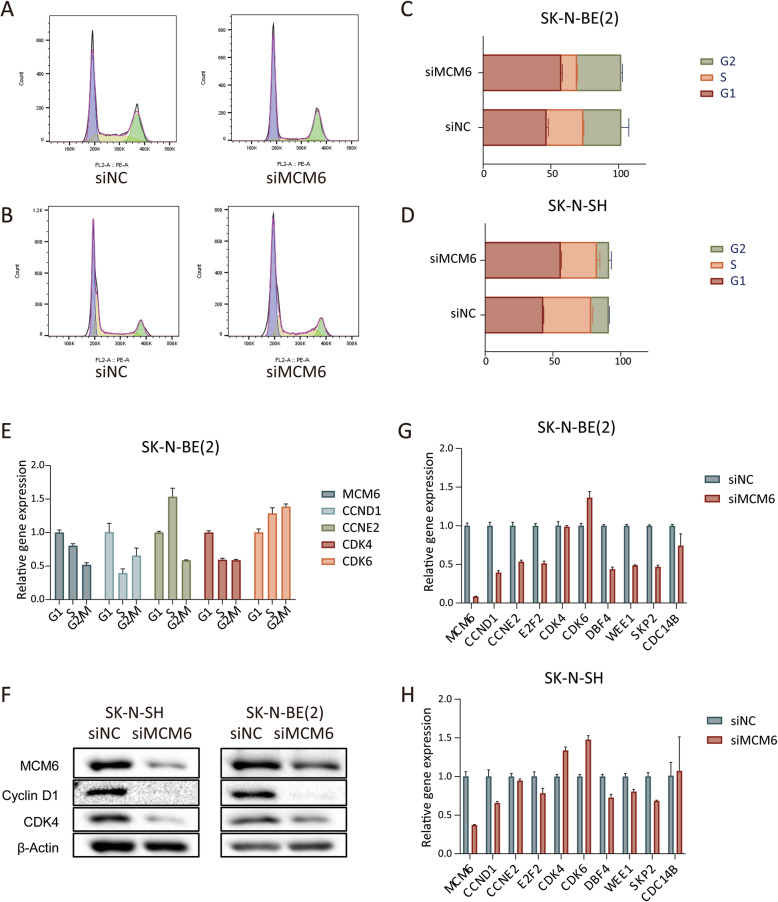
Results: Through multiple datasets mining, we found that high expression of MCM6 was positively correlated with elevated tumor stage, high risk and poor prognosis in neuroblastoma. At the cellular level, neuroblastoma cell proliferation, migration and invasion were significantly inhibited after MCM6 was interfered by siRNA. Mutual verification of RNA-seq and western blotting suggested that the downstream cell cycle-related genes were differentially expressed after MCM6 interference. Flow cytometric analysis revealed that neuroblastoma cells were blocked in G1/S phase after MCM6 interference.

Conclusion: MCM6 is considered to be the driving force of G1/S cell cycle progression, and it is also a prognostic marker and a potential novel therapeutic target in neuroblastoma.

Keywords: Cell cycle; MCM6; Neuroblastoma.


Conflict of interest statement

The authors declare that they have no competing interests.

Figures

Fig. 1
Fig. 1
MCM6 mRNA expression in 31 clinical samples. (A) The histogram shows the relative expression level of MCM6 mRNA for each sample. (B) The samples are divided into 3 categories according to Shimada pathology classification. The mRNA expression of MCM6 in neuroblastoma is significantly higher than that of ganglioeuroblastoma and ganglioneuroma. The value is displayed as the mean ± SEM and statistical significance is expressed as **** p < 0.0001. NB, neurobastoma; GNB, ganglioeuroblastoma; GN, ganglioneuroma
Fig. 2
Fig. 2
The prognostic value of MCM6 in three validated clinical neuroblastoma datasets and the value of tumor INSS staging and risk classification. (A-B) Kaplan-Meier analysis of OS and EFS based on the MCM6 expression in Kocak dataset, and the log-rank test P value is displayed (n = 476, 173 patients without survival information were not included in the analysis); (C-D) Kaplan-Meier analysis of OS and EFS based on the MCM6 expression in SEQC dataset, and the log-rank test P value is displayed (n = 498); (E-F) Kaplan-Meier analysis of OS and EFS based on the MCM6 expression in Oberthuer dataset, and the log-rank test P value is displayed (n = 251); (G-I) The box plot shows the expression level of MCM6 in the above three public datasets in different INSS stages (stage 1, 2, 3, 4, 4 s); (J) The box plot shows the expression level of MCM6 in the high-risk group and low-risk group of neuroblastoma in the SEQC data set. Since the risk classification data were not included in the Kocak and Oberthuer datasets, no relevant analysis was performed. The value is displayed as the mean ± SEM and statistical significance is expressed as* p < 0.05, *** p < 0.001
Fig. 3
Fig. 3
Functional experiment of MCM6 in neuroblastoma cells. (A) Western blotting verified the protein expression of MCM6 in 5 neuroblastoma cell lines; (B) Interference efficiency of 3 small interfering RNAs with different sequences on MCM6, detected by qRT-PCR; The in vitro proliferation function of MCM6 was measured by CCK-8 (C), colony formation (D) and flow cytometry EdU labeling detection (E). The wound healing experiment (F) and the Transwell migration and invasion experiment (G-H) verified the migration (G) and invasion (H) activities of MCM6 on neuroblastoma cells in vitro. EdU, 5-Ethynyl − 2′- deoxyuridine
Fig. 4
Fig. 4
MCM6 knockdown inhibited the growth of neuroblastoma in vivo. (A-B) BLAB/c nude mice were sacrificed 45 days after subcutaneous injection and the tumor was dissected. (D) The wet weight of tumors formed by MCM6 knockdown cells were significantly smaller than that of the control (p < 0.05). (E) The knockdown efficiency of the lentivirus tool on MCM6 in SK-N-BE [2] cells reached more than 75% (p < 0.0001). (F) H&E staining of subcutaneous tumors in BALB/c nude mice (× 400). (G) Immunohistochemical staining of subcutaneous tumors in BALB/c nude mice on target of MCM6, CDK4, CyclinD1 and Ki-67 separately (× 200). The value is displayed as the mean ± SEM and statistical significance is expressed as *p < 0.05, **** p < 0.0001
Fig. 5
Fig. 5
MCM6 activates pathways related to cell cycle regulation. (A) Cluster heat map of 6 samples. We used the R language Pheatmap software package to perform two-way clustering analysis on the union of different genes and samples of all comparison groups, clustering according to the expression level of the same gene in different samples and the expression pattern of different genes in the same sample, using the Euclidean method calculate the distance, the longest distance method of hierarchical clustering (complete Linkage) for clustering. In the figure, genes are represented horizontally, and each column is a sample. Red represents high expressed genes and green represents low expressed genes. (B) The volcanic map was drawn according to the gene distribution, gene expression fold change and significance results. On the left was the down-regulated gene of siMCM6 group relative to siNC group, and on the right was the up-regulated gene. The two vertical dotted lines were the threshold of 1.5 times fold change of gene expression difference, and the horizonal dotted line is the threshold of p value =0.05. (C) Genome circle diagram. We used the R language Circlize package to mark the differentially expressed RNA on the genome according to the genome information and the results of RNA differential expression analysis. The outermost circle is the chromosome band, from the outside to the inside are the differential expression analysis results of different differential analysis. Red and green are the histograms of the log2FoldChange values ​​of the up-regulated and down-regulated genes, and the gray is the scatter plot of the log2FoldChange values ​​of the undifferentially expressed genes. (D-E) The GO enrichment analysis results of differentially expressed genes. GO classification is carried out based on MF, BP and CC, and the top 10 GOs with the smallest p value, as well as the most significant enrichment in each GO classification term were selected to entry for display (D). The enrichment degree is measured by Rich factor, FDR value and the number of genes enriched to this GO Term. Among them, Rich factor refers to the ratio of the number of differential genes enriched in the GO Term to the number of annotated genes. The greater the Rich factor, the greater the degree of enrichment. FDR generally ranges from 0 to 1, the closer to 0, the more significant the enrichment. Select the top 20 GO Term entries with the smallest FDR value, that is, the most significant enrichment, for display (E). (F-G) The KEGG enrichment analysis results of differentially expressed genes. Select the top 20 pathways with the smallest p value for display (F). The degree of enrichment is measured by Rich factor, FDR value and the number of genes enriched on this pathway. As well as GO enrichment analysis, we selected the top 20 KEGG pathways with the smallest FDR value namely the most significant enrichment, for display (G). (H) Differentially expressed genes of the enriched cell cycle pathways and their differential expression levels. (I) Differentially expressed genes of the enriched Wnt pathways and their differential expression levels. GO, Gene Ontology; KEGG, Kyoto Encyclopedia of Genes and Genomes; FDR, p value correction; MF, molecular function; BP, biological process; CC, cell component
Fig. 6
Fig. 6
MCM6 can regulate the cell cycle of neuroblastoma at both the cell and protein level. (A-D) Cell cycle analysis was performed on neuroblastoma cell lines using flow cytometry. After MCM6 silenced, SK-N-BE [2] and SK-N-SH cells both showed an increase in G1 phase components and a decrease in S phase components. (E) The expression of cell cycle regulated genes in different cell cycle phases of SK-N-BE [2] cells. (F) Verify the expression of cell cycle regulation related proteins by WB. The expression of CDK4 and CyclinD1 was down-regulated after MCM6 silence. (G-H) According to the cell cycle regulation pathway enriched by RNA-seq, the relevant genes on the pathway were verified by qPCR. The value is displayed as the mean ± SEM and statistical significance is expressed as **** p < 0.0001

Similar articles

Cited by

References

    1. Matthay KK, Maris JM, Schleiermacher G, Nakagawara A, Mackall CL, Diller L, Weiss WA. Neuroblastoma. Nat Rev Dis Primers. 2016;2(1):16078. doi: 10.1038/nrdp.2016.78. - DOI - PubMed
    1. Brodeur GM, Iyer R, Croucher JL, Zhuang T, Higashi M, Kolla V. Therapeutic targets for neuroblastomas. Expert Opin Ther Targets. 2014;18(3):277–292. doi: 10.1517/14728222.2014.867946. - DOI - PMC - PubMed
    1. Jones DTW, Banito A, Grunewald TGP, Haber M, Jager N, Kool M, Milde T, Molenaar JJ, Nabbi A, Pugh TJ, Schleiermacher G, Smith MA, Westermann F, Pfister SM. Molecular characteristics and therapeutic vulnerabilities across paediatric solid tumours. Nat Rev Cancer. 2019;19(8):420–438. doi: 10.1038/s41568-019-0169-x. - DOI - PubMed
    1. Perwein T, Lackner H, Sovinz P, Benesch M, Schmidt S, Schwinger W, Urban C. Survival and late effects in children with stage 4 neuroblastoma. Pediatr Blood Cancer. 2011;57(4):629–635. doi: 10.1002/pbc.23036. - DOI - PubMed
    1. Basta NO, Halliday GC, Makin G, Birch J, Feltbower R, Bown N, Elliott M, Moreno L, Barone G, Pearson AD, James PW, Tweddle DA, McNally RJ. Factors associated with recurrence and survival length following relapse in patients with neuroblastoma. Br J Cancer. 2016;115(9):1048–1057. doi: 10.1038/bjc.2016.302. - DOI - PMC - PubMed

Substances