

Cross-sectional study of changes in physical activity behavior during the COVID-19 pandemic among US adults
- PMID: 34233691
- PMCID: PMC8261396
- DOI: 10.1186/s12966-021-01161-4
Cross-sectional study of changes in physical activity behavior during the COVID-19 pandemic among US adults
Abstract
Background: Physical activity (PA) provides numerous health benefits relevant to the COVID-19 pandemic. However, concerns exist that PA levels may have decreased during the pandemic thus exacerbating health disparities. This study aims to determine changes in and locations for PA and reasons for decreased PA during the pandemic.
Methods: Reported percentage of changes in and locations for PA and reasons for decreased PA were examined in 3829 US adults who completed the 2020 SummerStyles survey.
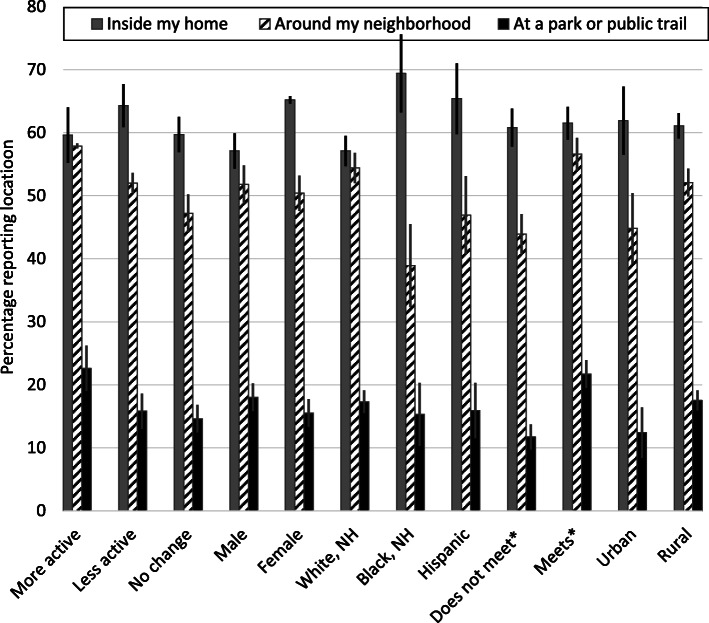
Results: Overall, 30% reported less PA, and 50% reported no change or no activity during the pandemic; percentages varied across subgroups. Adults who were non-Hispanic Black (Black) or Hispanic (vs. non-Hispanic White, (White)) reported less PA. Fewer Black adults (vs. White) reported doing most PA in their neighborhood. Concern about exposure to the virus (39%) was the most common reason adults were less active.
Conclusions: In June 2020, nearly one-third of US adults reported decreased PA; 20% reported increased PA. Decreased activity was higher among Black and Hispanic compared to White adults; these two groups have experienced disproportionate COVID-19 impacts. Continued efforts are needed to ensure everyone has access to supports that allow them to participate in PA while still following guidance to prevent COVID-19 transmission.
Keywords: Environment; Epidemiology; Health disparities.
Conflict of interest statement
The authors declare that they have no competing interests.
Figures
References
-
- World Health Organization . Coronavirus disease 2019 (COVID-19) situation report–51. Geneva, Switzerland. 2020.
-
- Centers for Disease Control and Prevention . CDC COVID Data Tracker. 2020.
-
- Centers for Disease Control and Prevention . People with Certain Medical Conditions 2020. 2021. - PubMed
-
- Hales CM, Carroll MD, Fryar CD, Ogden CL. Prevalence of obesity and severe obesity among adults: United States, 2017-2018. NCHS Data Brief. 2020;360:1–8. - PubMed
MeSH terms
LinkOut - more resources
Full Text Sources
Medical
