. 2021 Jul 7;7(28):eabf4408.
doi: 10.1126/sciadv.abf4408. Print 2021 Jul.

The site of breast cancer metastases dictates their clonal composition and reversible transcriptomic profile

Affiliations

The site of breast cancer metastases dictates their clonal composition and reversible transcriptomic profile

Jean Berthelet et al. Sci Adv. .

Abstract

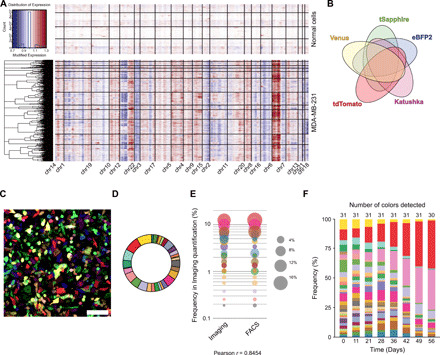
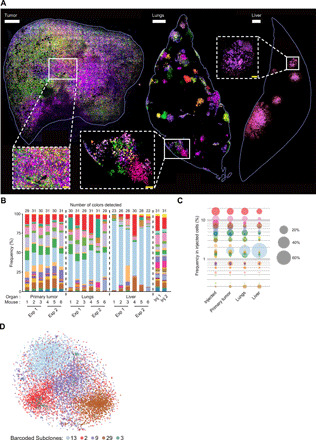
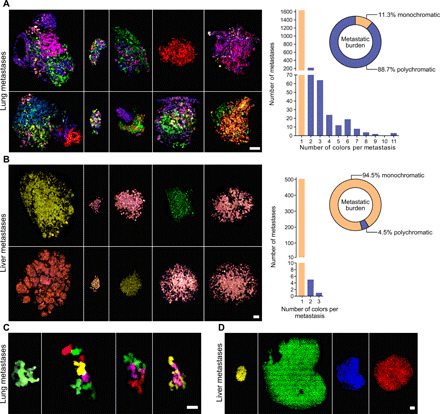
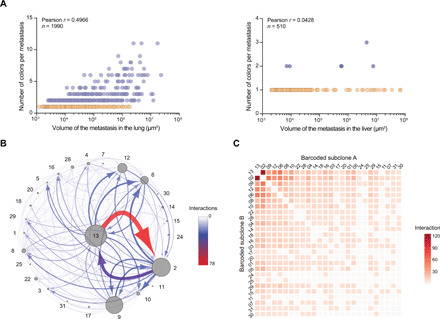
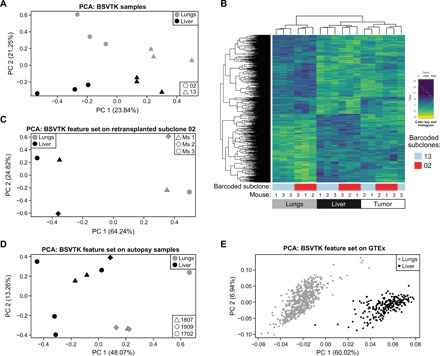
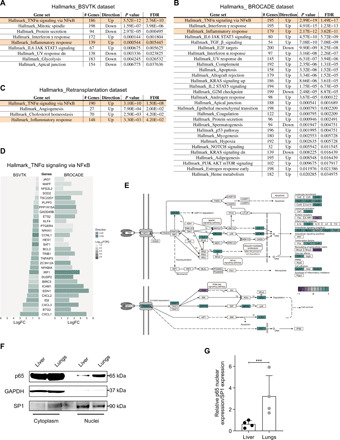
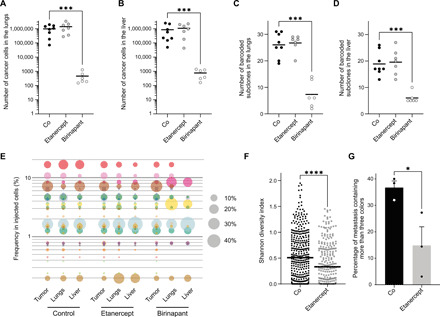
Intratumoral heterogeneity is a driver of breast cancer progression, but the nature of the clonal interactive network involved in this process remains unclear. Here, we optimized the use of optical barcoding to visualize and characterize 31 cancer subclones in vivo. By mapping the clonal composition of thousands of metastases in two clinically relevant sites, the lungs and liver, we found that metastases were highly polyclonal in lungs but not in the liver. Furthermore, the transcriptome of the subclones varied according to their metastatic niche. We also identified a reversible niche-driven signature that was conserved in lung and liver metastases collected during patient autopsies. Among this signature, we found that the tumor necrosis factor-α pathway was up-regulated in lung compared to liver metastases, and inhibition of this pathway affected metastasis diversity. These results highlight that the cellular and molecular heterogeneity observed in metastases is largely dictated by the tumor microenvironment.


Figures

Fig. 1
Fig. 1. Heterogeneity of MDA-MB-231 cells highlighted by optical barcoding.
(A) Analysis of CNVs inferred from single-cell RNA-seq analysis from normal human mammary cells [top (66)] and MDA-MB-231 cells (bottom). Individual cells are represented on the y axis and the different genomic regions along the x axis. (B) Venn diagram representing the 31 possible combinations generated by expression of five fluorescent tags: eBFP2, tSapphire, Venus, tdTomato, and Katushka. (C) Representative confocal image of BSVTK-labeled cells. Scale bar, 100 μm. (D) Example of a pie chart representing the percentage [detected by fluorescence-activated cell sorting (FACS)] of each color-coded population in MDA-MB-231 cells transduced with optical barcodes for 48 hours. (E) Comparison between the quantification of each color-coded population obtained by either imaging or FACS. Each dot represents a subpopulation of cells with a given color. The size of the dot corresponds to the percentage of cells carrying this color within a population, analyzed by confocal imaging or FACS. (F) FACS analysis of the same population of cells maintained in 2D culture for 56 days. The frequency of each barcoded subclone is indicated on the y axis and the number of days on the x axis. The total number of barcoded subclones detected is indicated at the top.
Fig. 2
Fig. 2. Visualization and quantification of metastatic burden at single-cell resolution in whole organs.
(A) Representative images obtained by confocal imaging of the primary tumor (left), the lungs (middle), and the liver (right). Insets, magnified images. The white bars represent 500 μm and the yellow bars 100 μm. (B) Stacked histogram indicating the frequency (%) of each color-coded subclone detected in the primary tumors and lung and liver metastases of six different recipient mice. These results summarize two independent experiments (Exp 1 and Exp 2), with the cell population analyzed at the time of injection on both occasions (Inj 1 and Inj 2). Organs were harvested at metastatic end point and digested before quantification using flow cytometry. (C) Average subclonal frequency in the injected population, the primary tumor, and the lung and liver metastases from the six mice shown in (B). Each dot represents a color-coded subclone, and the size of the dot represents the frequency of the subclone. The y axis represents the frequency of each subclone, ranked according to their frequency in the injected population (D) t-distributed stochastic neighbor embedding (t-SNE) (perplexity = 50) of 10,418 single cells from five barcoded subclones (subclone 13, 3224 cells; 2, 2712 cells; 9, 2566 cells; 29, 1778 cells; 3, 140 cells) representing a feature set (table S1) that was derived through a differential expression analysis between the dominant subclone 13 and the minor subclone 29.
Fig. 3
Fig. 3. Analysis of the intrametastatic heterogeneity of lung and liver metastases.
(A and B) Representative confocal images (left) and color quantification (right) for metastases detected in the lungs (A) or the liver (B) of mice engrafted with BSVTK MDA-MB-231 cells. Left: Scale bars, 100 μm. Right: Bar graph represents the number of metastases containing one (yellow bars) or multiple (blue bars) colors; pie charts represent the proportion of total metastatic burden associated with monochromatic (yellow) or polychromatic (blue) metastases. (C and D) Representative confocal images of some of the largest metastases detected in the lungs (C) and the liver (D) of mice engrafted with cancer cells from the BSVTK-barcoded PDX-0066. Scale bars, 20 μm (C) and 200 μm (D).
Fig. 4
Fig. 4. Mapping clonal interactions within metastases.
(A) Correlation between the number of colors detected per metastasis and the volume of the metastases in the lungs (left) and liver (right). Each dot represents a metastasis. Monochromatic metastases are represented in orange and polychromatic metastases in blue. The number of metastases included in this dataset (from six mice) and the Pearson correlation coefficient are indicated in the figure. (B) Interactome map summarizing the frequency of colocalization events between barcoded subclones within lung metastases. Each subclone is represented by a dot and a number. The size of each dot correlates with the total volume occupied by the corresponding subclone in the dataset analyzed by confocal imaging. Arrows linking two dots indicate that the corresponding two barcoded subclones are colocalized within individual metastases, with the thickness and the color of the line (as indicated in the scale) reflecting the number of times that this colocalization event was detected across all metastases, and the arrows pointing from the dominant to the minor subclone. (C) Heatmap representing the number of colocalization events between all the barcoded subclones detected in lungs. The number of times two subclones were colocalized was quantified from the imaging dataset, and the values are represented in this heatmap.
Fig. 5
Fig. 5. Impact of the tumor microenvironment on the transcriptomic landscape of metastatic subclones.
(A) PCA plot demonstrating the transcriptomic differences between subclones 2 (round) and 13 (triangle) depending on the organs (lungs in gray and liver in black) from which they were isolated. (B) Heatmap of the differentially expressed genes in barcoded subclones 2 (red) and 13 (blue) between lung and liver metastases, in three mice. The expression level of these genes (referred to as BSVTK feature set) was also depicted in primary tumors from matching animals. (C) PCA plot showing the separation of lung and liver metastases based on genes of the BSVTK feature set, from three second-generation mice (Ms 1, Ms 2, and Ms 3), generated by mammary fat pad retransplantation of cells from subclone 2 that were isolated from lung metastasis of first-generation mice. (D) PCA plot representing the analysis of differentially expressed genes from the BSVTK feature set in lung (gray) and liver (black) metastases collected at autopsy from three patients with metastatic breast cancer (patients 1807, 1909, and 1702). These data were subset to the differentially expressed genes in the BSVTK feature set, demonstrating the ability of this feature set to distinguish between lung and liver samples. (E) PCA plot representing the analysis of the differentially expressed genes from the BSVTK feature set in GTEx normal lung (gray) and liver (black) tissue. This subset of the BSVTK feature set enabled the separation of these normal tissues by organ.
Fig. 6
Fig. 6. Enrichment analyses of the molecular signatures associated with transcriptomic changes in different metastatic sites.
(A to C) Competitive gene set enrichment tests were performed using the hallmark gene set collection for lung versus liver comparison in the BSVTK feature set (A), autopsy dataset (B), and retransplantation dataset (C). The results were filtered by P value and false discovery rate (FDR) (<0.05), where the number of genes and the directionality in the gene set are also presented (“up” means up-regulated in the lungs and “down” means down-regulated in the lungs). Highlighted gene sets were common to all three datasets. (D) The absolute log fold changes (logFC) were plotted for genes present in the TNFα-related hallmark gene set that were differentially expressed between lungs and liver and common to both the BSVTK and BROCADE autopsy datasets. The opacity indicates the log10(FDR) for each gene, and the color represents the directionality of the log(FC) in the differential expression analysis between lungs and liver. (E) Representation of the KEGG’s TNFα signaling pathway illustrating the up- and down-regulated genes between lungs (green) and liver (purple). This was produced using the Pathview Bioconductor package (https://bioconductor.org/packages/release/bioc/html/pathview.html). p, phosphate; u, ubiquitin. (F) Western blots showing the level of p65 in the cytoplasm and nuclei of lung and liver metastases from a mouse with a MDA-MB-231 tumor (representative of four experiments). Glyceraldehyde phosphate dehydrogenase (GAPDH) was used as a loading control for the cytoplasm fraction and specificity protein 1 (SP1) for the nucleus fraction. (G) Relative quantification of the p65 protein level in the nuclei of lung and liver metastases from four individual mice normalized to SP1 expression. Means ± SD are shown, paired t test, ***P = 0.0008.
Fig. 7
Fig. 7. Effect of etanercept and birinapant treatments on the survival and heterogeneity of metastases.
Mice with BSVTK-labeled MDA-MB-231 tumors were treated with saline (Co), etanercept (10 mg/kg) three times weekly, or birinapant (30 mg/kg) three times weekly, after resection of the primary tumors. Number of cells detected by flow cytometry in (A) lungs and (B) liver of mice treated with saline, etanercept, or birinapant. Number of colors detected by flow cytometry in (C) lungs and (D) liver. For (A) to (D), each dot represents a mouse. Mann-Whitney test, ***P = 0.0007. (E) Bubble plot indicating the frequency of the barcoded subclones (ranked according to their frequency in the injected cells). Each dot is a barcoded subclone, and its size correlates to its frequency, determined by flow cytometry. (A to E) The number of mice is n = 8 for the control, 7 for the etanercept, and 6 for the birinapant. (F) Shannon diversity indexes of individual lung metastases, quantified by imaging. Each dot is a metastasis in the control (n = 3 mice, three sections per lung, 388 metastases) or etanercept (n = 3 mice, three sections per lung, 312 metastases) group. (G) Percentage of metastases containing more than three colors in the control or etanercept group. Each dot represents an average of the percentages obtained for an individual mouse (n = 3 mice, three sections per lung). Error bars represent SEM. (F and G) Unpaired t test. ****P < 0.0001 and *P = 0.0418.

References

    1. Dagogo-Jack I., Shaw A. T., Tumour heterogeneity and resistance to cancer therapies. Nat. Rev. Clin. Oncol. 15, 81–94 (2018). - PubMed
    1. Wang Y., Waters J., Leung M. L., Unruh A., Roh W., Shi X., Chen K., Scheet P., Vattathil S., Liang H., Multani A., Zhang H., Zhao R., Michor F., Meric-Bernstam F., Navin N. E., Clonal evolution in breast cancer revealed by single nucleus genome sequencing. Nature 512, 155–160 (2014). - PMC - PubMed
    1. Kim C., Gao R., Sei E., Brandt R., Hartman J., Hatschek T., Crosetto N., Foukakis T., Navin N. E., Chemoresistance evolution in triple-negative breast cancer delineated by single-cell sequencing. Cell 173, 879–893.e13 (2018). - PMC - PubMed
    1. Casasent A. K., Schalck A., Gao R., Sei E., Long A., Pangburn W., Casasent T., Meric-Bernstam F., Edgerton M. E., Navin N. E., Multiclonal invasion in breast tumors identified by topographic single cell sequencing. Cell 172, 205–217.e12 (2018). - PMC - PubMed
    1. Hu Z., Li Z., Ma Z., Curtis C., Multi-cancer analysis of clonality and the timing of systemic spread in paired primary tumors and metastases. Nat. Genet. 52, 701–708 (2020). - PMC - PubMed

Publication types