. 2021 Sep 1;81(17):4417-4430.
doi: 10.1158/0008-5472.CAN-20-2153. Epub 2021 Jul 7.

Metabolic Enzyme DLST Promotes Tumor Aggression and Reveals a Vulnerability to OXPHOS Inhibition in High-Risk Neuroblastoma

Affiliations

Metabolic Enzyme DLST Promotes Tumor Aggression and Reveals a Vulnerability to OXPHOS Inhibition in High-Risk Neuroblastoma

Nicole M Anderson et al. Cancer Res. .

Abstract

High-risk neuroblastoma remains therapeutically challenging to treat, and the mechanisms promoting disease aggression are poorly understood. Here, we show that elevated expression of dihydrolipoamide S-succinyltransferase (DLST) predicts poor treatment outcome and aggressive disease in patients with neuroblastoma. DLST is an E2 component of the α-ketoglutarate (αKG) dehydrogenase complex, which governs the entry of glutamine into the tricarboxylic acid cycle (TCA) for oxidative decarboxylation. During this irreversible step, αKG is converted into succinyl-CoA, producing NADH for oxidative phosphorylation (OXPHOS). Utilizing a zebrafish model of MYCN-driven neuroblastoma, we demonstrate that even modest increases in DLST expression promote tumor aggression, while monoallelic dlst loss impedes disease initiation and progression. DLST depletion in human MYCN-amplified neuroblastoma cells minimally affected glutamine anaplerosis and did not alter TCA cycle metabolites other than αKG. However, DLST loss significantly suppressed NADH production and impaired OXPHOS, leading to growth arrest and apoptosis of neuroblastoma cells. In addition, multiple inhibitors targeting the electron transport chain, including the potent IACS-010759 that is currently in clinical testing for other cancers, efficiently reduced neuroblastoma proliferation in vitro. IACS-010759 also suppressed tumor growth in zebrafish and mouse xenograft models of high-risk neuroblastoma. Together, these results demonstrate that DLST promotes neuroblastoma aggression and unveils OXPHOS as an essential contributor to high-risk neuroblastoma. SIGNIFICANCE: These findings demonstrate a novel role for DLST in neuroblastoma aggression and identify the OXPHOS inhibitor IACS-010759 as a potential therapeutic strategy for this deadly disease.


Figures

Figure 1.
Figure 1.
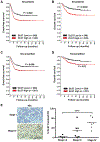
High DLST expression predicts poor outcomes and tumor aggression in patients with neuroblastoma. A–D, Kaplan–Meier survival curves illustrate a negative association between high DLST expression and poor event-free and overall survival: total cohort (A and B, median; low vs. high DLST expression, n = 249) and a nonamplified subcohort (C and D, median; n = 200 or 201) of patients with neuroblastoma. All data were analyzed for a public database in the R2: genomics analysis and visualization platform (GEO: GSE62564). A–D, Statistical significance was determined by survival analysis and calculated with the log-rank test. E, Immunohistochemical analyses of primary neuroblastoma patient samples show significantly increased DLST protein levels in advanced stage IV tumors (n = 4–7). Scale bar, 50 μm. Statistical significance: ***, P < 0.0001; calculated with an unpaired t test unless otherwise stated.
Figure 2.
Figure 2.
DLST overexpression promotes MYCN-driven tumor aggression in zebrafish. A, Rates of tumor induction show that DLST overexpression accelerates neuroblastoma onset (MYCN_TT vs. DLST_OE;MYCN_TT, n = 38-46; P = 0.015). Overexpression of DLST alone (DLST_OE) was insufficient to induce neuroblastoma development. Statistical analysis was performed by the log-rank Mantel-Cox test. B, Quantification of EGFP fluorescent intensity revealed increased tumor burden in 6-wpf DLST_OE;MYCN_TT transgenic fish, compared with MYCN_TT fish (left; n = 11-14). Overlay of brightfield and EGFP images of two MYCN_TT and DLST_OE;MYCN_TT fish (right). White arrow indicates tumors distant from the interrenal gland (IRG) in DLST_OE;MYCN_TT fish. Scale bar, 1 mm. C–E, DLST overexpression in the MYCN_TT fish increases the incidence of metastasis. C, Sagittal sections of DLST_OE;MYCN_TT fish at 6-wpf were immunostained with TH antibody and hematoxylin counterstain. E, sclera of the eyes, S, spleen; HK, hind kidney. D, Magnified views of TH-stained sections (bottom panels) or hematoxylin and eosin–stained adjacent sections (top panels). The black box with the 1° label indicates the IRG (site of the primary tumor). Scale bar, 1mm(C); 100 μm (D). Black arrows indicate tumor cells at distant sites: sclera of the eyes, spleen, and hind kidney. Insets in the right two panels are a close-up view of tumor cells in the hind kidney. E, The number of metastatic sites per fish (MYCN_TT vs. DLST_OE;MYCN_TT, n = 4–6). F, Western blotting analysis of tumor cells demonstrated approximately two-fold higher DLST levels in DLST_OE;MYCN_TT fish versus MYCN_TT fish (n=4). Data are presented as mean ± SEM, unless otherwise stated. Statistical significance: *, P < 0.02; **, P=0.0014.
Figure 3.
Figure 3.
Heterozygous loss of dlst delays neuroblastoma onset, reduces disease aggression, and induces apoptotic cell death at the IRG of MYCN fish. A, Rates of tumor induction indicate that heterozygous-loss of dlst delays MYCN-driven neuroblastoma onset (MYCN_TT vs. MYCN_TT;dlst±: P < 0.005). Statistical analysis was performed by the log-rank Mantel–Cox test. Neuroblastoma developed in a 6-wpf MYCN_TT fish (top), while no tumor developed in its sibling MYCN_TT; dlst± fish (bottom). Scale bar, 1 mm. B, Western blotting confirmed a 50% reduction of DLST protein levels in tumor cells from MYCN_TT; dlst±fish, compared with those from their MYCN_TT siblings (n = 4). C, Quantification of EGFP fluorescent intensity revealed no alteration in tumor burden in 10-wpf MYCN_TT;dlst± transgenic fish, compared with MYCN_TT fish (n = 11–14). D, The number of metastatic sites per fish (MYCN_TT vs. MYCN_TT; dlst±; n = 6–7). E and F, Heterozygous loss of dlst results in apoptosis at the IRG of the 3-wpf fish. Green, sagittal sections of MYCN_TT and MYCN_TT; dlst±fish at 3-wpf: tumor cells; red, activated caspase-3 (AC3+); blue, DAPI (left). White arrowheads indicate AC3+ cells and dotted lines the boundary of the hind kidney (HK). Percentage of AC3+ among the total number of EGFP+ sympathetic neuroblasts at the IRG of 3-wpf MYCN_TT and MYCN_TT; dlst±fish (right; n=9–10). Scale bar, 50 μmol/L. Statistical significance: *, P ≤ 0.05; **, P≤0.01.
Figure 4.
Figure 4.
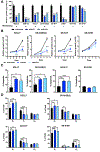
DLST depletion by RNAi slows growth, alters cell cycle, and increases apoptosis of human MYCN-amplified neuroblastoma cells. A, Relative growth rates of a panel of human neuroblastoma cell lines upon DLST depletion: MYCN-amplified BE(2)-C, SK-N-DZ, KELLY, and SK-N-BE(2), and nonamplified SK-N-FI, SHEP, SK-N-SH, and SK-N-AS (n = 4). B, The growth kinetics of human neuroblastoma cells were analyzed after transducing with either shScramble or two shRNA hairpins targeting DLST: MYCN-amplified cell lines KELLY and SK-N-BE(2), and nonamplified cell lines SK-N-FI and SK-N-SH (n = 4). C, Apoptosis was induced by shDLST in MYCN-amplified cell lines: KELLY, SK-N-BE(2), and SK-N-FI, but not in nonamplified SK-N-SH. Annexin V and PI staining was performed on cells isolated at 5 days postinfection (n = 4). D, DLST inactivation induces cell-cycle alterations in KELLY, SK-N-BE(2), SK-N-FI, and SK-N-SH cell lines (n = 4). At 5 days postinfection, neuroblastoma cells were fixed and then stained with PI for flow cytometry analysis. Statistical significance: *,P ≤ 0.05; **, P ≤ 0.01; ***, P ≤ 0.001;, **** P ≤ 0.0001.
Figure 5.
Figure 5.
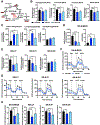
DLST inactivation disrupts the TCA cycle and OXPHOS. A, Schematic of the TCA cycle indicating the location of DLST and a carbon fate map illustrating the distribution of metabolites derived from [μL-13C]glutamine. Red-filled circles indicate 13-C atoms and empty circles indicate other carbon sources. B, Uniformly labeled [(μL)-13C] glutamine M+4/5 distribution of TCA-cycle intermediates in SK-N-BE(2) after DLST depletion at 3.5-days post-infection (n = 3). C, Total intracellular αKG increases and L-2-HG accumulates in SK-N-BE(2) upon DLST depletion (n = 3). D and E, Intracellular NADH decreases upon DLST depletion in SK-N-BE(2), KELLY, and SK-N-FI (n=4–5). F and G, Relative oxygen consumption rate (OCR) normalized to protein abundance in SK-N-BE(2), KELLY, SK-N-FI, and SK-N-SH after DLST inactivation (n = 12). H, Upon DLST depletion, the basal extracellular acidification rate (ECAR) dropped significantly in SK-N-BE(2), KELLY, and SK-N-FI (n=8–12). All experiments were performed 3.5 days before any evidence of cellular toxicity. Statistical significance: *, P ≤ 0.05; **, P ≤ 0.01; ***, P ≤ 0.001;, **** P ≤ 0.0001.
Figure 6.
Figure 6.
Human neuroblastoma cells are sensitive to inhibitors of the ETC complex I. A, Dose–response curves and their IC50s for a panel of human neuroblastoma cell lines treated with IACS for 5 days (n=6). IC50s were calculated with log(inhibitor) versus normal response. B, The relative OCR for the cell line KELLY after 24 hours of IACS treatment (n = 12). C, IACS induced a dose-dependent induction of apoptosis in KELLY, SK-N-BE(2), SK-N-DZ, SK-N-FI, and SK-N-SH after 5 days of treatment by Annexin V and PI staining (n=4–5). D, DMKG and IACS show striking synergy upon 48-hour treatment in KELLY, SK-N-BE(2), SK-N-DZ, and SK-N-FI, but not in SK-N-SH cells (n = 6). Statistical significance: *, P ≤ 0.05; **, P ≤ 0.01; ***, P ≤ 0.001; ****, P ≤ 0.0001.
Figure 7.
Figure 7.
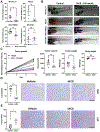
OXPHOS inhibition by IACS slows the growth of MYCN-amplified neuroblastoma xenografts. A and B, Zebrafish xenografts (MYCN_TT or human MYCN-amplified neuroblastoma cells) demonstrate sensitivity to 100 nmol/L of IACS (96 hours, MYCN_TT; 72 hours, KELLY, SK-N-BE(2), and SK-N-SH; n = 3–8; scale bar, 0.5 mm). C, Normalized tumor growth of subcutaneous KELLY xenografts in Balb/c nude mice treated with either vehicle or IACS by oral gavage (n = 6–7). Treatment was initiated once tumors reached approximately 100 mm3. Final tumor volume and weight of KELLY xenografts after 11 days of IACS treatment (n = 6–7). Final body weight of mice after 11 days of treatment: vehicle versus IACS (n=4–5). D and E, IACS treatment leads to a decrease in proliferative cells as indicated by pH3 staining and a cell-cycle arrest as determined by an increase of p21 staining per field of view (FOV; n = 7). Scale bars, 100 μm. Statistical significance: *, P ≤ 0.05; **, P ≤ 0.01;***, P ≤ 0.001; ns, nonsignificant.

References

    1. Brodeur GM. Neuroblastoma: biological insights into a clinical enigma. Nat Rev Cancer 2003;3:203–16. - PubMed
    1. Maris JM. Recent advances in neuroblastoma. N Engl J Med 2010;362:2202–21. - PMC - PubMed
    1. Pinto NR, Applebaum MA, Volchenboum SL, Matthay KK, London WB, Ambros PF, et al. Advances in risk classification and treatment strategies for neuroblastoma. J Clin Oncol 2015;33:3008–17. - PMC - PubMed
    1. Park JR, Bagatell R, London WB, Maris JM, Cohn SL, Mattay KM, et al. Children’s Oncology Group’s 2013 blueprint for research: Neuroblastoma. Pediatr Blood Cancer 2013;60:985–93. - PubMed
    1. Maris JM, Hogarty MD, Bagatell R, Cohn SL. Neuroblastoma seminar. Lancet 2007;369:2106–20. - PubMed

Publication types

MeSH terms