. 2021 Jul 7;13(601):eabc3911.
doi: 10.1126/scitranslmed.abc3911.

Down-regulation of A20 promotes immune escape of lung adenocarcinomas

Affiliations

Down-regulation of A20 promotes immune escape of lung adenocarcinomas

Kristina Breitenecker et al. Sci Transl Med. .

Abstract

Inflammation is a well-known driver of lung tumorigenesis. One strategy by which tumor cells escape tight homeostatic control is by decreasing the expression of the potent anti-inflammatory protein tumor necrosis factor alpha-induced protein 3 (TNFAIP3), also known as A20. We observed that tumor cell intrinsic loss of A20 markedly enhanced lung tumorigenesis and was associated with reduced CD8+ T cell-mediated immune surveillance in patients with lung cancer and in mouse models. In mice, we observed that this effect was completely dependent on increased cellular sensitivity to interferon-γ (IFN-γ) signaling by aberrant activation of TANK-binding kinase 1 (TBK1) and increased downstream expression and activation of signal transducer and activator of transcription 1 (STAT1). Interrupting this autocrine feed forward loop by knocking out IFN-α/β receptor completely restored infiltration of cytotoxic T cells and rescued loss of A20 depending tumorigenesis. Downstream of STAT1, programmed death ligand 1 (PD-L1) was highly expressed in A20 knockout lung tumors. Accordingly, immune checkpoint blockade (ICB) treatment was highly efficient in mice harboring A20-deficient lung tumors. Furthermore, an A20 loss-of-function gene expression signature positively correlated with survival of melanoma patients treated with anti-programmed cell death protein 1. Together, we have identified A20 as a master immune checkpoint regulating the TBK1-STAT1-PD-L1 axis that may be exploited to improve ICB therapy in patients with lung adenocarcinoma.


Conflict of interest statement

Competing Interests

The authors declare no competing interests

Figures
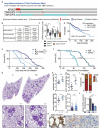
Figure 1
Figure 1. A20 is a tumor suppressor in K-RAS driven lung tumorigenesis.
(A) Oncoprint of LUAD depicting patients harboring K-RAS mutations, as well as mutations and deletions of TNFAIP3 and (B) quantitation of patients harboring alterations in these genes. Data were derived from the TCGA PanCancer Atlas. (C) Relative A20 mRNA expression in K-RAS mutant, EGFR mutant and K-RAS wildtype/EGFR wildtype LUAD biopsies compared to adjacent healthy lung tissue of the same individuals. Data was retrieved from the Gene Expression Omnibus (GSE75037) and analyzed using student’s t test, Box plot with min to max whiskers, n=35 for K-RASmut, 20 for EGFRmut and 21 for K-RASwt/EGFRwt. AU, arbitrary units. (D) Kaplan Meier plot showing overall survival of patients with LUAD stratified by high (n=258) and low (n=462) A20 expression. Univariate cox regression test was used for statistical analysis. (E) Survival analysis of K-rasG12D (K, n=42), K-rasG12D:A20ΔLep/ΔLep (KA, n=28) and K-rasG12D:A20ΔLep/+ [KA (het) n=48] mice and (F) of K-rasG12D:p53ΔLep/ΔLep (KP, n=24) versus K-rasG12D:p53ΔLep/ΔLep:A20ΔLep/ΔLep (KPA, n=16) mice following intranasal inhalation with Ad.CMV-Cre. Statistical analysis was performed using the Log rank test. (G) Representative pictures of H&E stained sections from tumor bearing lungs 10 weeks following Ad.CMV-Cre inhalation of K and KA mice, including higher magnification of indicated areas, Scale bars, 1 mm (top) and 250 μm (bottom). (H) Graphs depict lung to body weight rations, tumor area versus healthy lung area and tumor number per analyzed section in K and KA mice (n=8 per group), as well as the area of all tumors found in analyzed sections (n=227 for K and n=292 for KA mice). Data was analyzed using student’s t test. (I) Graph indicates the percentage of stage I, stage II and stage III tumors, respectively, in K versus KA mice (n=4 sections per group). (J) A20 mRNA expression in tumor free wildtype lungs (wt) compared to tumor bearing lungs of K and KA mice, 10 weeks post Ad.CMV-Cre inhalation. Data was analyzed by Oneway ANOVA, n=4 per group. (K) Representative images of stainings for A20 in the healthy parenchyma and in the tumors of lungs of KP mice and KPA mice. *p<0.05, **p<0.01, ***p<0.001. Graphs in (H) & (J) depict means ± SD.
Figure 2
Figure 2. Loss of A20 alters tumor immune cell infiltration.
(A) Representative images of immunohistochemical stainings for Ki67 and cleaved Caspase 3 (CC3) in lung tumors of K-rasG12D (K) and K-rasG12D:A20ΔLep/ΔLep (KA) mice and of (B) K-rasG12D:p53ΔLep/ΔLep (KP) and K-rasG12D:p53ΔLep/ΔLep:A20ΔLep/ΔLep (KPA) mice. Percentage of positively stained cells in at least eight individual tumors per mouse was evaluated using TissueGnostics software, n= 5 to 7 mice per group, scale bars, 50 μm.(C) Volumes as measured with a caliper of engrafted tumor-derived from A20-expressing versus A20-deficient 368T1 cells in NSG mice, monitored over 4 weeks. The graph at the right depicts the weight of the individual tumors after 4 weeks (n=16 per group). (D) Flow cytometric analysis of cell suspensions derived from tumor bearing lungs of KP versus KPA mice (n= 4 per group). Statistical analysis was performed using the student’s t test. Graphs represent means ± SD. *p<0.05, **p<0.01, ***p<0.001.
Figure 3
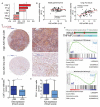
Figure 3. A20 expression positively correlates with cytotoxic T cell infiltration in LUAD patients.
(A) The abundance of indicated immune cell-types in LUAD biopsies was evaluated by CIBERSORT and correlated with respective A20 mRNA expression values. Data was derived from GSE75037. The graph depicts the Pearson correlation coefficient for different cell-types, dotted lines indicate significance levels < 0.05 (*) and < 0.001 (***), respectively. (B) Graphs depict mRNA expression values for A20 versus immune cytolytic activity as calculated by the mean of GZMA and PRF1 expression, in healthy lung parenchyma (left panel) and in LUAD biopsies of the same cohort (right panel). Data were derived from GSE75037. (C) Images from LUAD biopsies spotted on a tissue micro array and following immunohistochemical staining for A20 (brown color) and CD8 (red color). The displayed pictures are representative for samples with high versus low A20 expression. Scale bars: 1 mm (left panel) and 200 μm (right panel). n=84. (D) Graph depicts scoring for CD8+ T cell infiltrates in LUAD biopsies exhibiting an A20 Hirsch score (percentage of positive tumor cells x staining intensity) equal and above to 200 (n=57) versus below 200 (n=27). Box plot with min to max whiskers, and data was analyzed using the student’s t test. *p<0.05 (E) Scoring of PD-L1 expression of tumor cells in LUAD biopsies stratified by A20 Hirsch score. *p<0.05 (F) Gene set enrichment analysis of expression data derived from TCGA PanCancer Atlas and for LUAD patients harboring K-RAS mutations, discriminating between patients with no alterations in the TNFAIP3/A20 gene (WT; n=61) versus patients with shallow deletions of TNFAIP3 (HET, n=79). Gene sets were generated using the top 100 genes positively (CD8_high_100) or negatively (CD8_low_100) correlating with CD8 abundance in LUAD samples as evaluated by CIBERSORT analysis of GSE75037 dataset.
Figure 4
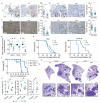
Figure 4. Increased tumorigenicity of A20 knockout LUAD depends on evasion of CD8+ T cells.
(A) Representative images and quantitation of immunohistochemical stainings for CD3 in tumors of K-rasG12D (K) versus K-rasG12D:A20ΔLep/ΔLep (KA) and (B) K-rasG12D:p53ΔLep/ΔLep (KP) versus K-rasG12D:p53ΔLep/ΔLep:A20ΔLep/ΔLep (KPA) mice (right panels). Data was analyzed using student’s t test and bars indicate means ± SD. *p<0.05, ***p<0.001. (C) Representative images of CD8 and granzyme B stainings (Gzmb) in lung tumors of KP and KPA mice, 10 weeks post tumor initiation. Graph depicts percentage of positive cells within the tumor for respective stainings, and more than 10 tumors were analyzed per lung (n=4 mice per group). Scale bars, 50 μm. (D) Quantitation of normalized mRNA expression levels for indicated genes from lysates of tumor bearing lungs of K-rasG12D:p53ΔLep/ΔLep (KP) and K-rasG12D:p53ΔLep/ΔLep:A20ΔLep/ΔLep (KPA) mice. n=4 per group. (E) Survival analysis of NSG mice (left panel, n=15 per group) and C57Bl/6 mice (right panel, n=9 per group) following orthotopic transplantation of KP and KPA tumor cells. Log rank test was used for statistical analysis. (F) Survival analysis of C57Bl/6 mice after orthotopic transplantation with KP and KPA cells, and antibody mediated CD8+ T cell depletion started one week post tumor cell engraftment. Isotype antibody was used as control. Data was analyzed by Log rank test. (n=6-8 mice per group). (G) Images of lungs from KP and KPA mice 10 weeks post Ad.SPC-Cre inhalation and following treatment with CD8 depleting antibodies versus isotype controls. Lower panel shows higher magnification of indicated sections, scale bar, 2 mm and 500 μm. (H) Graphs depict lung to body weight ratios, tumor numbers per analyzed sections and the percentage of tumor area to total lung area. n=5 per group. (A), (B), (C) & (H) Bars indicate means ± SD, and data was analyzed using student’s t test. *p<0.05, ***p<0.001.
Figure 5
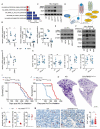
Figure 5. Autocrine IFN signaling enables aberrant growth of A20 knockout LUAD.
(A) Graph depicts the nominal p-value of all hallmark gene sets enriched in KPA tumors with a normalized enrichment score > 1 as compared to KP tumors. RNAseq data of macroscopically dissected lung tumors in K-rasG12D:p53ΔLep/ΔLep (KP) versus K-rasG12D:p53ΔLep/ΔLep:A20ΔLep/ΔLep (KPA) mice 10 weeks post Ad.Cre administration was used for the hallmark gene set enrichment analysis. (B) Stat1 mRNA expression in untreated wildtype (wt) and p65 deficient K-rasG12D:p53Δ/Δ (KP) and K-rasG12D:p53Δ/Δ:A20Δ/Δ (KPA) cells, and Pd-l1 and Ido mRNA fold increase upon 4 hours treatment with Ifnγ in KP and KPA cells, with and without p65 and Stat1 knockout. 28S expression was used for normalization, and fold levels were calculated to expression in untreated KP cells. (C) Western blots for indicated (phospho-) proteins using cell lysates of p65 expressing and deficient KP and KPA cells, respectively. Cells were stimulated with Ifnγ for 10 minutes. (D) Scheme illustrating the feed forward loop involving TBK1 activation, IFNβ expression and autocrine signaling via the IFNα receptor resulting in STAT1 expression for IFNγ mediated responses. (E) Western blot probing for indicated proteins in cell lysates of untreated KP and KPA cells, with and without p65 knockout, and (F) in amlexanox treated (48 hours) KP and KPA cells following 10 minutes Ifnγ treatment. (G) Relative Stat1 mRNA expression in wt and Ifnar1 deficient KP and KPA cells. (H) Quantitation by flow cytometry of indicated immune cells in lungs of C57Bl/6 mice, two weeks following orthotopic transplantation of KP and KPA cells, with and without Ifnar1 deletion (n=5-8 mice per group). (I) Kaplan Maier analysis of Ad.SPC-Cre inhaled K mice versus K mice with additional Ifnar deletion in tumor cells (K:IfnarΔLep/ΔLep) and (J) KA mice versus KA:IfnarΔLep/ΔLep,. n=13-19 mice per group. Log rank test was performed for statistical analysis. (K) H&E stained sections of lungs in KA and KA:IfnarΔLep/ΔLep mice, 10 weeks post Ad.SPC-Cre inhalation. Lower panel shows a higher magnification of indicated lung areas. (L) Graph depicts means ± SD of lung to body weight and tumor area to total lung area ratios, and tumor numbers per analyzed section, n≥5. (M) Representative CD3 immunohistochemical stainings and quantitation (means ± SD) for T cell infiltration in tumors of KA and KA:IfnarΔLep/ΔLep mice, 10 weeks after tumor initiation with Ad.SPC-Cre inhalation. (B), (G) & (L) were analyzed using student’s t test, (H) by One way ANOVA, bars indicate means ± SD.*p<0.05, **p<0.01, ***p<0.001.
Figure 6
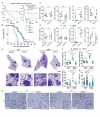
Figure 6. A20 deficiency sensitizes LUAD to anti-PD-L1 therapy.
(A) Overall survival (OS) and progression free survival (PFS) of melanoma patients treated with anti-PD-1 monotherapy stratified according to the A20 LOF signature score (high n=13, intermediate n=14, low n=14). Data was analyzed by Log rank test. (B) Kaplan Meier analysis of C57Bl/6 mice following orthotopic transplantation with indicated cell lines. Log rank test was performed for statistical analysis. (C) Quantitation of indicated immune cells in lungs of syngeneic recipients from orthotopic transplants of KP and KPA cells, with and without Pd-l1 knock-out, (D) or treated with anti-Pd-l1 antibody or isotype controls. Lungs were harvested two weeks post transplantation. (n=4-5 mice per group). Data was analyzed by One-way ANOVA. (E) H&E stained lung sections of KP and KPA mice treated with indicated antibodies over the experimental period of 10 weeks and (F) quantification of lung to body weight ratios, tumor numbers per section and tumor area to total lung area of these mice. Data was analyzed using One-way ANOVA. Experiment was performed together with the antibody mediated CD8 depletion in Fig. 4G–H, hence isotype control group is the same. (G) Representative CD3 immunohistochemical stainings and (H) quantification for infiltrating CD3 positive T cells in tumors of KP and KPA mice, 10 weeks after tumor initiation and treatment with anti-PD-L1 antibody or isotype controls. (B), (C), (D), (F) & (H) Graphs show means ± SD. *p<0.05, **p<0.01, ***p<0.001.

References

    1. Herbst RS, Morgensztern D, Boshoff C. The biology and management of non-small cell lung cancer. Nature. 2018;553:446–454. - PubMed
    1. Ott PA, Hodi FS, Kaufman HL, Wigginton JM, Wolchok JD. Combination immunotherapy: a road map. Journal for immunotherapy of cancer. 2017;5:16. - PMC - PubMed
    1. Prelaj A, Tay R, Ferrara R, Chaput N, Besse B, Califano R. Predictive biomarkers of response for immune checkpoint inhibitors in non-small-cell lung cancer. European journal of cancer (Oxford, England : 1990) 2019;106:144–159. - PubMed
    1. Borghaei H, Paz-Ares L, Horn L, Spigel DR, Steins M, Ready NE, Chow LQ, Vokes EE, Felip E, Holgado E, Barlesi F, et al. Nivolumab versus Docetaxel in Advanced Nonsquamous Non-Small-Cell Lung Cancer. The New England journal of medicine. 2015;373:1627–1639. - PMC - PubMed
    1. Garon EB, Rizvi NA, Hui R, Leighl N, Balmanoukian AS, Eder JP, Patnaik A, Aggarwal C, Gubens M, Horn L, Carcereny E, et al. Pembrolizumab for the treatment of non-small-cell lung cancer. The New England journal of medicine. 2015;372:2018–2028. - PubMed

Publication types

Substances