

Clock proteins regulate spatiotemporal organization of clock genes to control circadian rhythms
- PMID: 34234015
- PMCID: PMC8285898
- DOI: 10.1073/pnas.2019756118
Clock proteins regulate spatiotemporal organization of clock genes to control circadian rhythms
Abstract
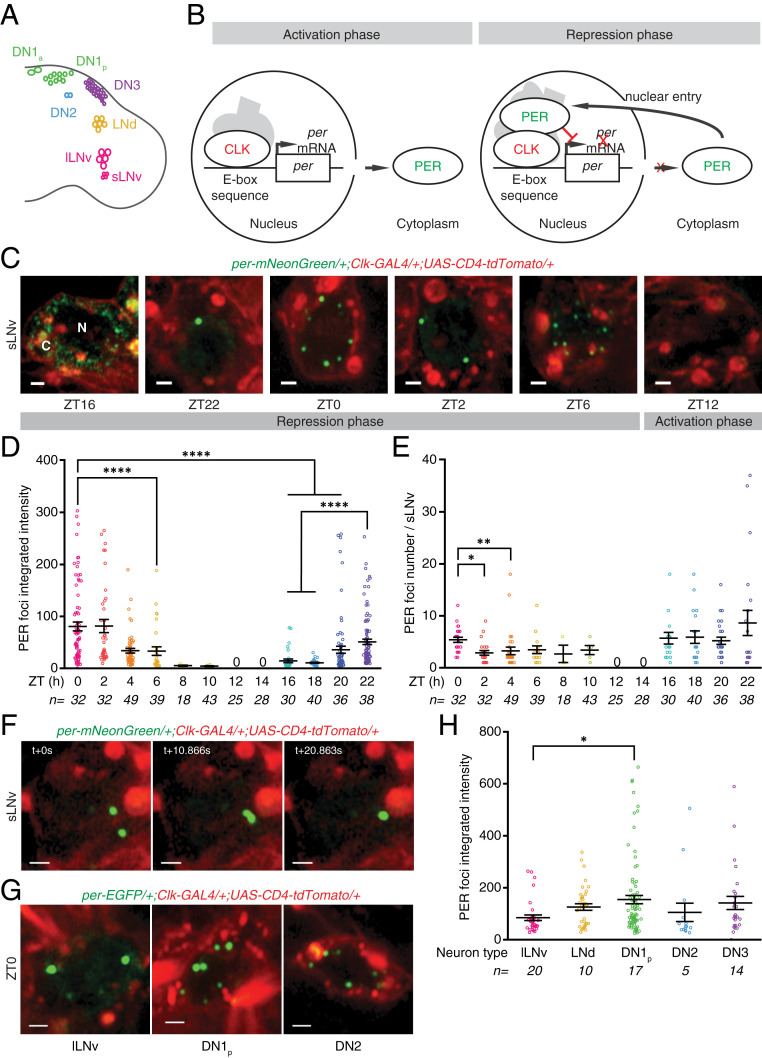
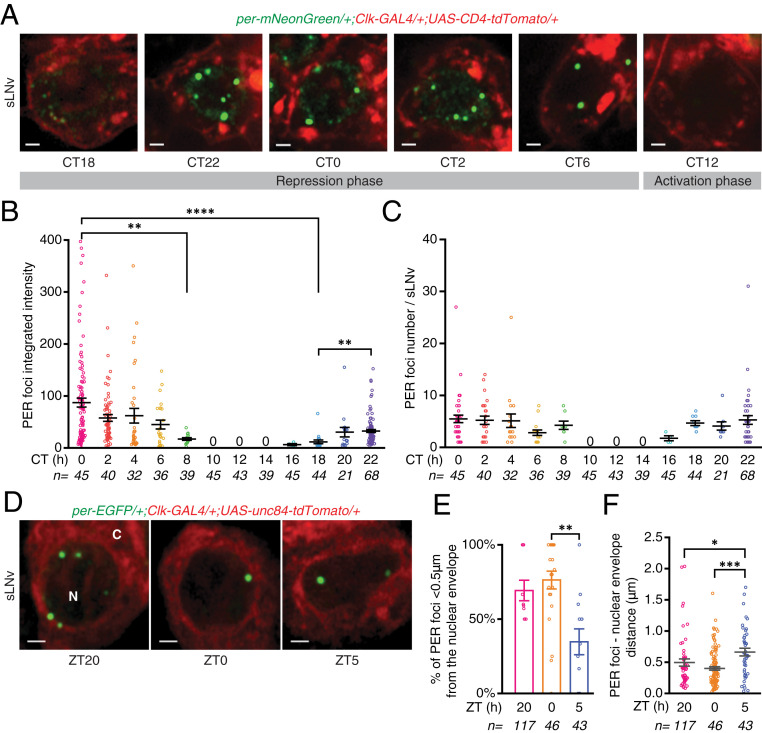
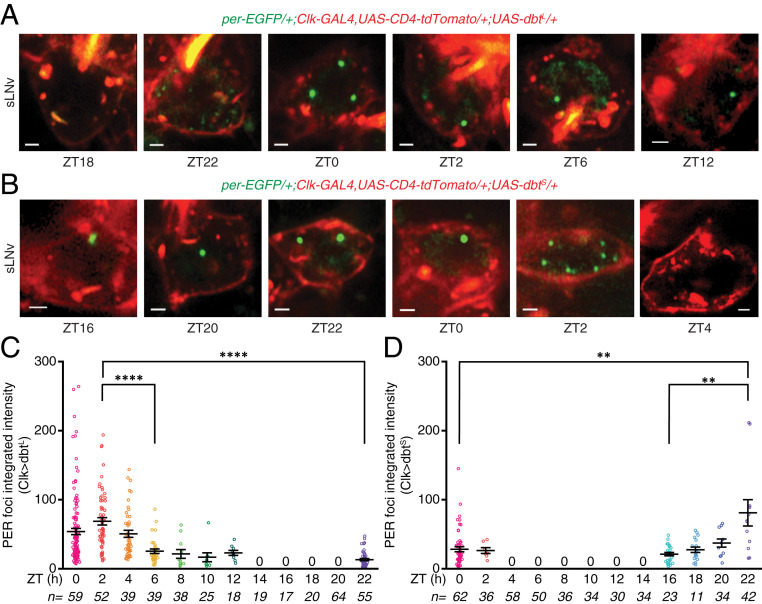
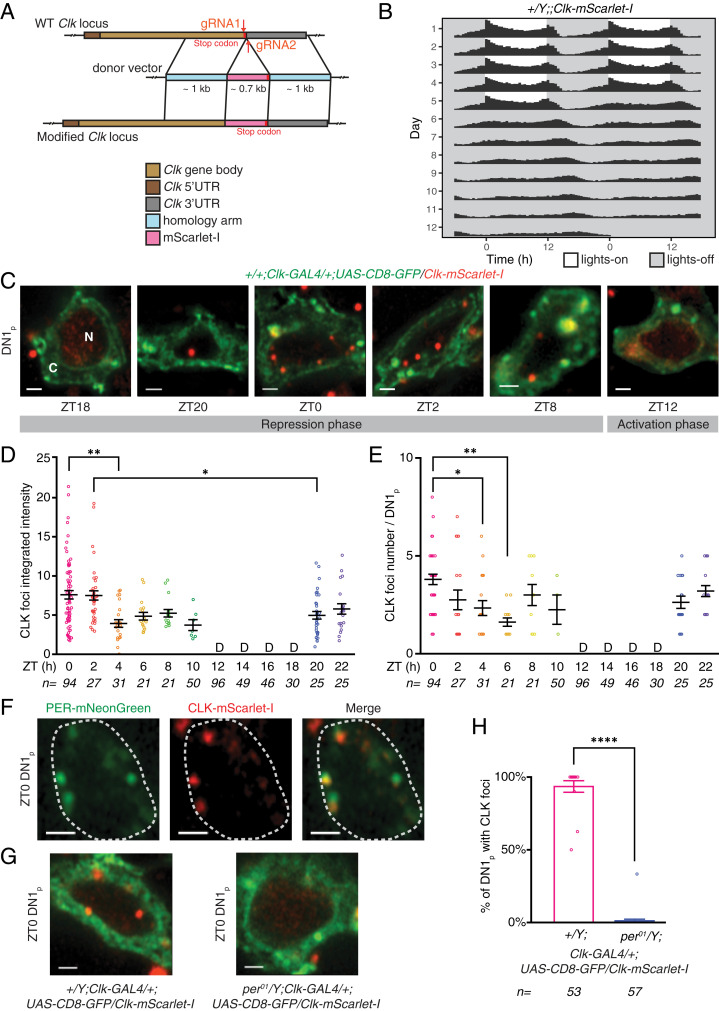
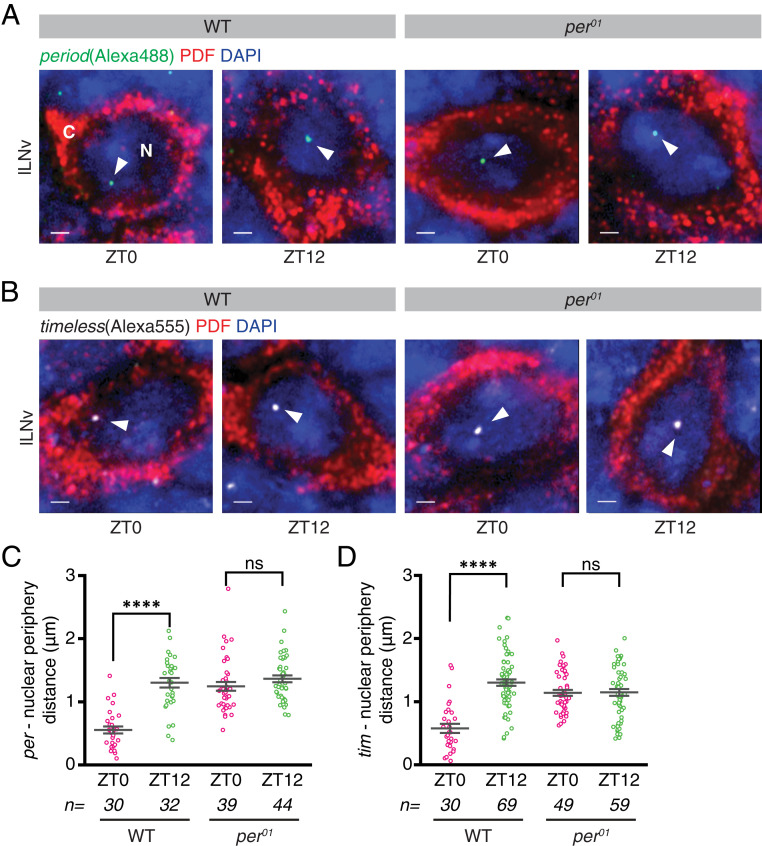
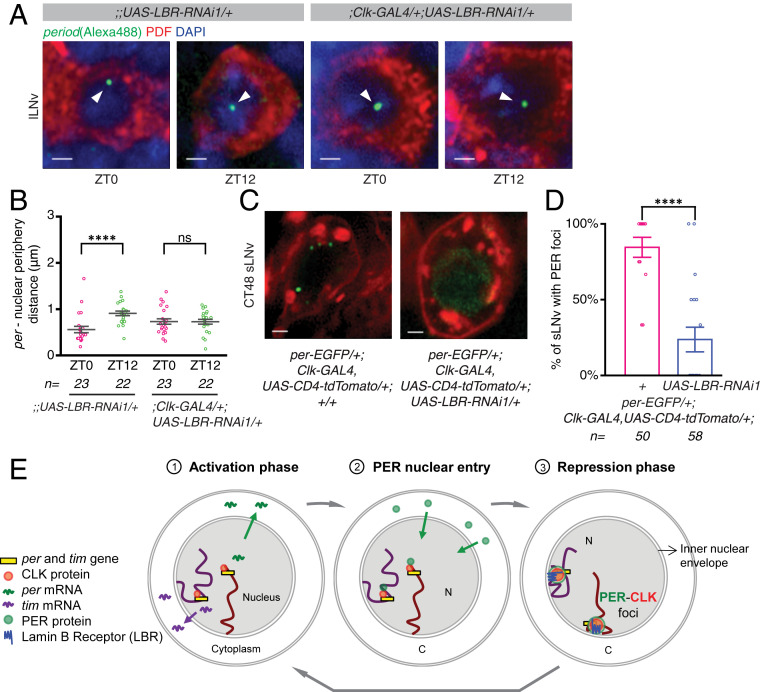
Circadian clocks regulate ∼24-h oscillations in gene expression, behavior, and physiology. While the genetic and molecular mechanisms of circadian rhythms are well characterized, what remains poorly understood are the intracellular dynamics of circadian clock components and how they affect circadian rhythms. Here, we elucidate how spatiotemporal organization and dynamics of core clock proteins and genes affect circadian rhythms in Drosophila clock neurons. Using high-resolution imaging and DNA-fluorescence in situ hybridization techniques, we demonstrate that Drosophila clock proteins (PERIOD and CLOCK) are organized into a few discrete foci at the nuclear envelope during the circadian repression phase and play an important role in the subnuclear localization of core clock genes to control circadian rhythms. Specifically, we show that core clock genes, period and timeless, are positioned close to the nuclear periphery by the PERIOD protein specifically during the repression phase, suggesting that subnuclear localization of core clock genes might play a key role in their rhythmic gene expression. Finally, we show that loss of Lamin B receptor, a nuclear envelope protein, leads to disruption of PER foci and per gene peripheral localization and results in circadian rhythm defects. These results demonstrate that clock proteins play a hitherto unexpected role in the subnuclear reorganization of core clock genes to control circadian rhythms, revealing how clocks function at the subcellular level. Our results further suggest that clock protein foci might regulate dynamic clustering and spatial reorganization of clock-regulated genes over the repression phase to control circadian rhythms in behavior and physiology.
Keywords: circadian rhythms; live imaging; nuclear organization.
Conflict of interest statement
The authors declare no competing interest.
Figures
Similar articles
-
Clock-dependent chromatin accessibility rhythms regulate circadian transcription.PLoS Genet. 2024 May 28;20(5):e1011278. doi: 10.1371/journal.pgen.1011278. eCollection 2024 May. PLoS Genet. 2024. PMID: 38805552 Free PMC article.
-
An ecdysone-responsive nuclear receptor regulates circadian rhythms in Drosophila.Nat Commun. 2014 Dec 16;5:5697. doi: 10.1038/ncomms6697. Nat Commun. 2014. PMID: 25511299 Free PMC article.
-
Spliceosome factors target timeless (tim) mRNA to control clock protein accumulation and circadian behavior in Drosophila.Elife. 2018 Dec 5;7:e39821. doi: 10.7554/eLife.39821. Elife. 2018. PMID: 30516472 Free PMC article.
-
Circadian Rhythms and Sleep in Drosophila melanogaster.Genetics. 2017 Apr;205(4):1373-1397. doi: 10.1534/genetics.115.185157. Genetics. 2017. PMID: 28360128 Free PMC article. Review.
-
The role of spatiotemporal organization and dynamics of clock complexes in circadian regulation.Curr Opin Cell Biol. 2022 Oct;78:102129. doi: 10.1016/j.ceb.2022.102129. Epub 2022 Sep 18. Curr Opin Cell Biol. 2022. PMID: 36126370 Free PMC article. Review.
Cited by
-
CLOCK and TIMELESS regulate rhythmic occupancy of the BRAHMA chromatin-remodeling protein at clock gene promoters.PLoS Genet. 2023 Feb 21;19(2):e1010649. doi: 10.1371/journal.pgen.1010649. eCollection 2023 Feb. PLoS Genet. 2023. PMID: 36809369 Free PMC article.
-
Mammalian circadian clock proteins form dynamic interacting microbodies distinct from phase separation.bioRxiv [Preprint]. 2023 Oct 23:2023.10.19.563153. doi: 10.1101/2023.10.19.563153. bioRxiv. 2023. Update in: Proc Natl Acad Sci U S A. 2023 Dec 26;120(52):e2318274120. doi: 10.1073/pnas.2318274120. PMID: 37961341 Free PMC article. Updated. Preprint.
-
Phosphorylation Promotes the Accumulation of PERIOD Protein Foci.Research (Wash D C). 2023 May 5;6:0139. doi: 10.34133/research.0139. eCollection 2023. Research (Wash D C). 2023. PMID: 37223461 Free PMC article.
-
PRD-2 mediates clock-regulated perinuclear localization of clock gene RNAs within the circadian cycle of Neurospora.Proc Natl Acad Sci U S A. 2022 Aug 2;119(31):e2203078119. doi: 10.1073/pnas.2203078119. Epub 2022 Jul 26. Proc Natl Acad Sci U S A. 2022. PMID: 35881801 Free PMC article.
-
Circadian regulation of physiology by disordered protein-protein interactions.Curr Opin Struct Biol. 2024 Feb;84:102743. doi: 10.1016/j.sbi.2023.102743. Epub 2023 Dec 13. Curr Opin Struct Biol. 2024. PMID: 38091925 Free PMC article. Review.
References
-
- Stanewsky R., et al. ., The cryb mutation identifies cryptochrome as a circadian photoreceptor in Drosophila. Cell 95, 681–692 (1998). - PubMed
-
- Wheeler D. A., Hamblen-Coyle M. J., Dushay M. S., Hall J. C., Behavior in light-dark cycles of Drosophila mutants that are arrhythmic, blind, or both. J. Biol. Rhythms 8, 67–94 (1993). - PubMed
-
- Hardin P. E., Hall J. C., Rosbash M., Feedback of the Drosophila period gene product on circadian cycling of its messenger RNA levels. Nature 343, 536–540 (1990). - PubMed
-
- Aronson B. D., Johnson K. A., Loros J. J., Dunlap J. C., Negative feedback defining a circadian clock: Autoregulation of the clock gene frequency. Science 263, 1578–1584 (1994). - PubMed
Publication types
MeSH terms
Substances
Grants and funding
LinkOut - more resources
Full Text Sources
Molecular Biology Databases
