. 2021 Jul 13;118(28):e2105732118.
doi: 10.1073/pnas.2105732118.

Pain and itch processing by subpopulations of molecularly diverse spinal and trigeminal projection neurons

Affiliations

Pain and itch processing by subpopulations of molecularly diverse spinal and trigeminal projection neurons

Racheli Wercberger et al. Proc Natl Acad Sci U S A. .

Abstract

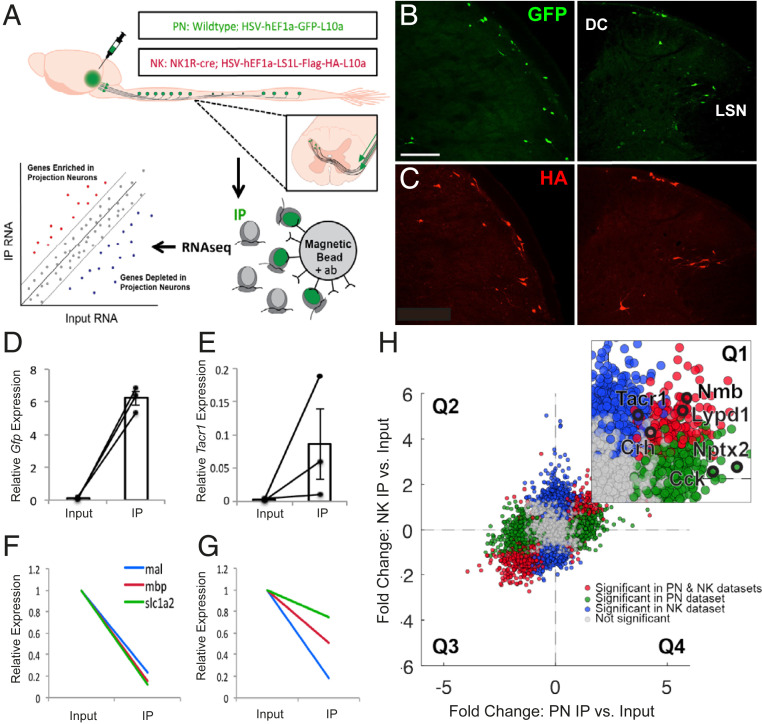
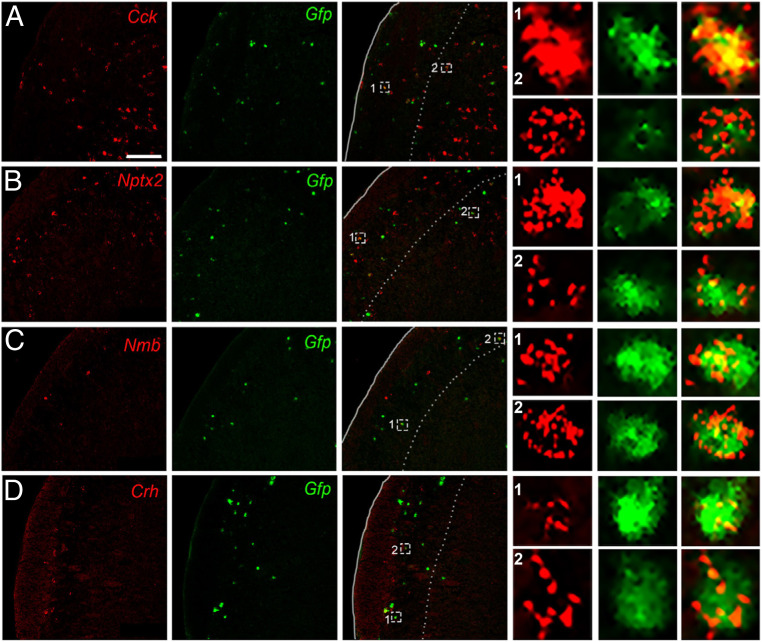
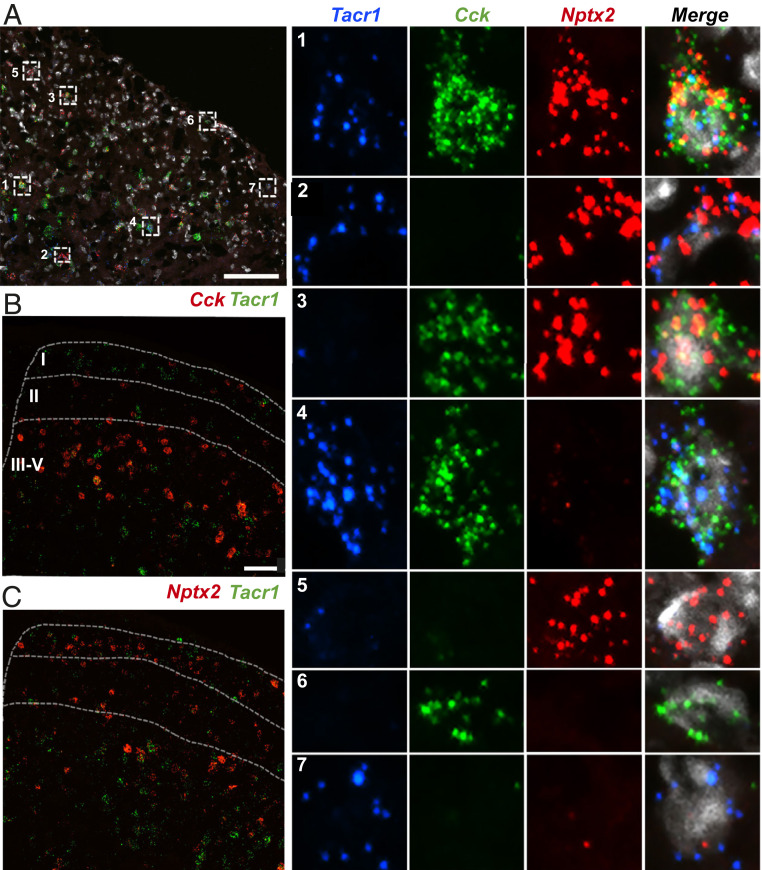
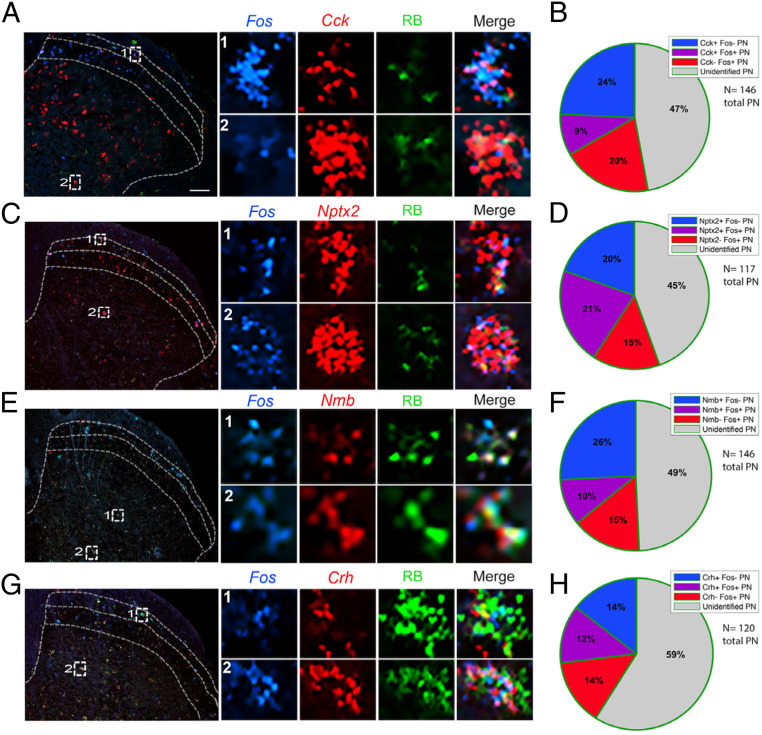
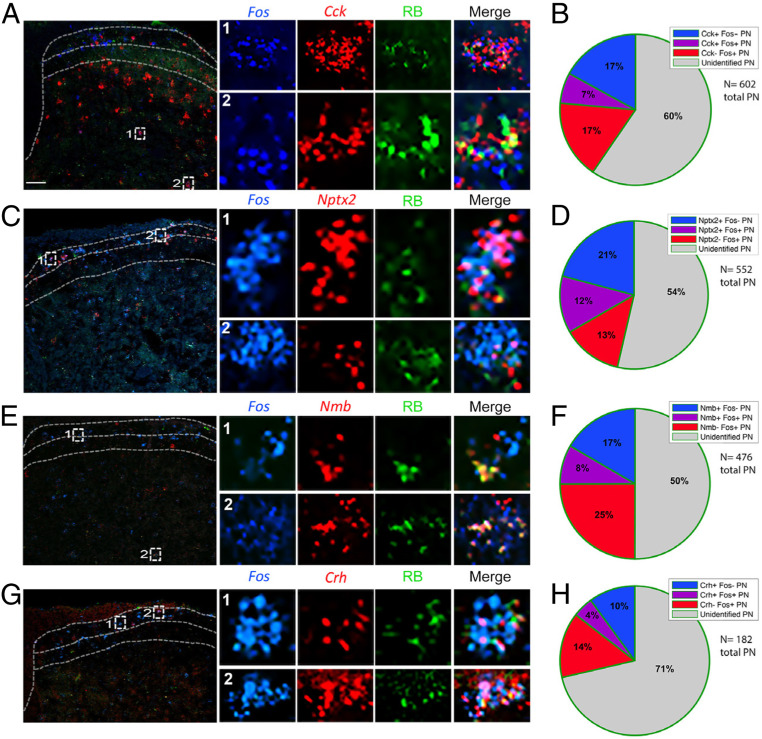
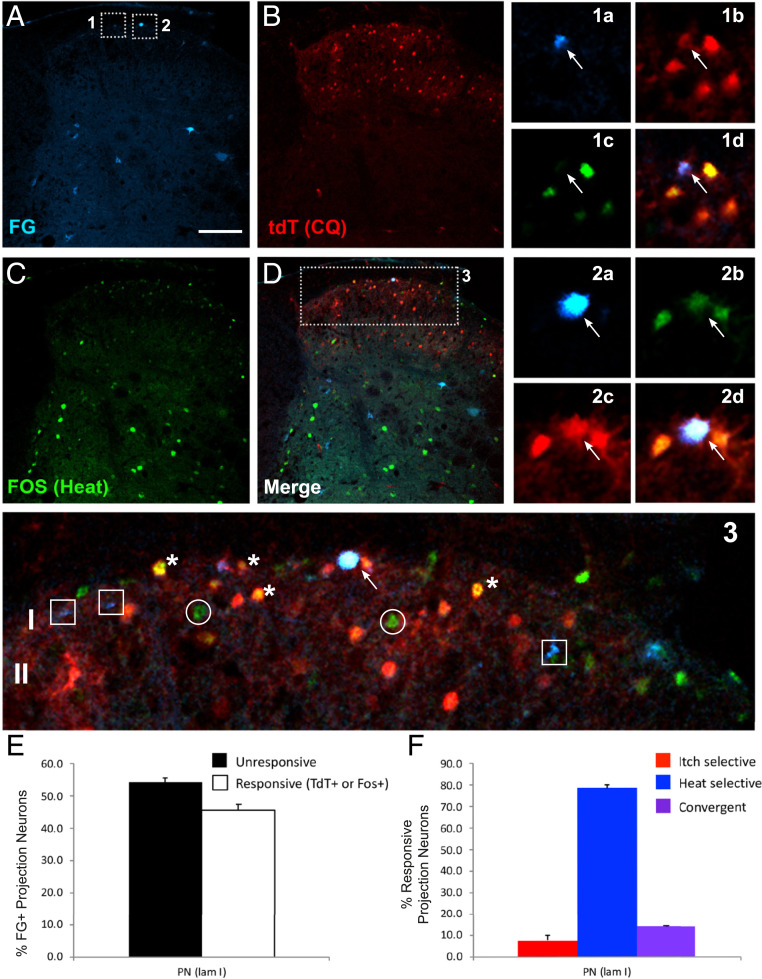
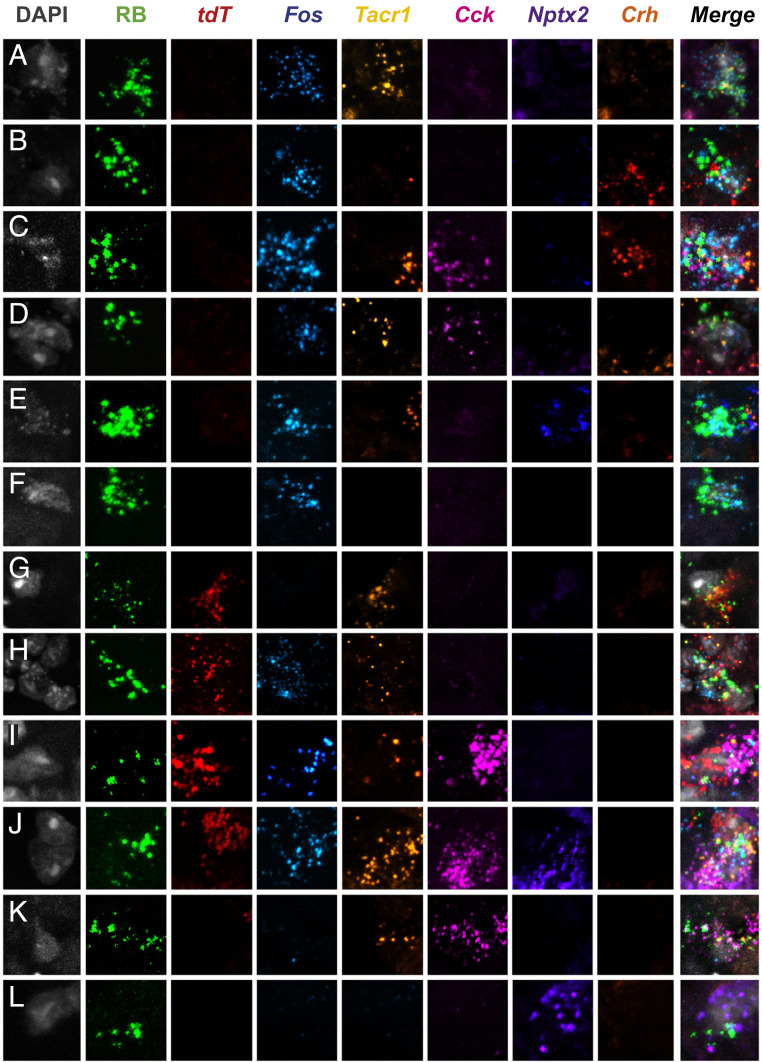
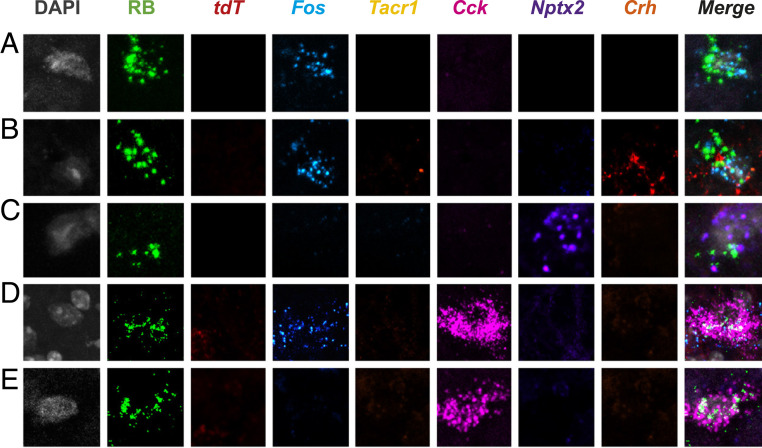
A remarkable molecular and functional heterogeneity of the primary sensory neurons and dorsal horn interneurons transmits pain- and or itch-relevant information, but the molecular signature of the projection neurons that convey the messages to the brain is unclear. Here, using retro-TRAP (translating ribosome affinity purification) and RNA sequencing, we reveal extensive molecular diversity of spino- and trigeminoparabrachial projection neurons. Among the many genes identified, we highlight distinct subsets of Cck+ -, Nptx2+ -, Nmb+ -, and Crh+ -expressing projection neurons. By combining in situ hybridization of retrogradely labeled neurons with Fos-based assays, we also demonstrate significant functional heterogeneity, including both convergence and segregation of pain- and itch-provoking inputs into molecularly diverse subsets of NK1R- and non-NK1R-expressing projection neurons.

Keywords: RNA-seq; dorsal horn; itch; pain; projection neurons.


Conflict of interest statement

The authors declare no competing interest.

Figures

Fig. 1.
Fig. 1.
Selective purification and profiling of projection neurons reveal candidate genes expressed by projection neurons. (A) Experimental design. (B and C) Representative images of GFP (B) and HA (C) immunofluorescence in nucleus caudalis (Left) and spinal cord (Right) from wild-type and NK1R-Cre mice, respectively, illustrate projection neurons GFP or HA-tagged ribosomal protein. (Scale bar 100 μm.) (D and E) qPCR results showing enrichment of Gfp (D) and Tacr1 (E) in IP relative to input samples, in PN and NK experiments, respectively. Data are normalized to Rpl27 and represented as mean ± SEM. (F and G) qPCR shows depletion of glial genes in IP relative to input samples in PN (F) and NK (G) experiments. Data are normalized to Rpl27 and input relative expression and represented as mean ± SEM. (H) RNA sequencing shows differential expression data of IP relative to input fold change for PN experiments vs. NK experiments. Quadrant 1 (Q1) contains genes enriched in both datasets; Q2 contains genes depleted in both; Q3 and Q4 contain genes differentially altered in PN vs. NK datasets. Inset shows enlarged Q1 with genes of interest highlighted in black. Genes significantly enriched or depleted in both PN and NK datasets are highlighted in red. Genes significantly changed in PN, but not NK dataset, are highlighted in green, while genes significantly changed in NK, but not PN, datasets are highlighted in blue. All significant differences P < 0.05.
Fig. 2.
Fig. 2.
In situ hybridization confirms candidate projection neuron genes identified by RNA-seq. Representative TNC sections illustrate colabeling of Cck (A), Nptx2 (B), Nmb (C), and Crh (D) mRNA (red) with Gfp-tagged trigeminoparabrachial projection neurons (green). Insets show enlarged examples of individual cells positive for both candidate gene and Gfp. (Scale bars, 100 μm.)
Fig. 3.
Fig. 3.
Molecular heterogeneity of dorsal horn Tacr1-expressing neurons. (A) Representative section of lumbar spinal cord after triple ISH for Tacr1 (blue), Cck (green), Nptx2 (red), and DAPI (white). Insets show examples of enlarged single neurons with different gene expression combinations, including triple-labeled (A, 1), double-labeled (A, 2 to 4) and single-labeled (A, 5 to 7) cells. (B and C) Representative sections of lumbar spinal cord after double ISH for Tacr1 (green) and (B) Cck (red) or (C) Nptx2 (red). (Scale bars, 100 μm.)
Fig. 4.
Fig. 4.
A subset of molecularly defined projection neurons responds to noxious heat. (A, C, E, and G) Representative images of lumbar spinal cord illustrate Retrobead-labeled spinoparabrachial neurons (green) coexpressing Cck (A), Nptx2 (C), Nmb (E), or Crh (G) (red), and the Fos immediate-early gene (blue), after hindpaw stimulation with noxious heat (50 °C). Insets show enlarged examples of triple-labeled cells. (B, D, F, and H) Pie charts illustrate percentages of projection neurons that express Fos after noxious heat stimulation, percentage of projection neurons that express Cck (B), Nptx2 (D), Nmb (F), or Crh (H), as well as the percentage of projection neurons that express both Fos and respective genes. Quantification includes data from two to four mice per gene and three to six lumbar spinal cord sections per mouse. (Scale bars, 100 μm.)
Fig. 5.
Fig. 5.
A subset of molecularly defined projection neurons responds to pruritic (chloroquine) stimulation. (A, C, E, and G) Representative images of trigeminal nucleus caudalis illustrate Retrobead-labeled trigeminoparabrachial neurons (green) coexpressing Cck (A), Nptx2 (C), Nmb (E), or Crh (G) (red) and the Fos immediate-early gene (blue), after chloroquine injection into the cheek. Insets show enlarged examples of triple-labeled cells. (B, D, F, and H) Pie charts illustrate percentages of projection neurons that express Fos after chloroquine injection, percentage of projection neurons that express Cck (B), Nptx2 (D), Nmb (F), or Crh (H), as well as the percentage of projection neurons that express both Fos and respective genes. Quantification includes data from two to four mice per gene and three to six lumbar spinal cord sections per mouse. (Scale bars, 100 μm.)
Fig. 6.
Fig. 6.
Activation of retrogradely labeled projection neurons first trapped by chloroquine and later immunostained for Fos in response to noxious heat. (AD) Representative images of lumbar spinal cord from TRAP2-tdTomato mice illustrate Fluorogold-labeled spinoparabrachial projection neurons (A: FG; blue), chloroquine (CQ)-activated tdTomato (B: tdT; red), and heat-activated Fos (C: green)-immunoreactive neurons. Insets 1 and 2 are magnified to the Right (a–d) and 3 Below. The arrows in 1a–d point to a projection neuron (FG+) that was activated by CQ (tdT+), but not heat (Fos) and in 2a–d, to a projection neuron that was activated by both stimuli (tdT+/Fos+). The image Below (3) highlights examples of single-labeled (squares), double-labeled (asterisks), and triple-labeled (arrow) neurons. (Scale bar, 100 μm). (E) Histograms illustrate the percentage of lamina I projection neurons (PN) that responded (white bars) or did not respond (black bars) to one or both stimuli. (F) Histograms illustrate the percentage of lamina I projection neurons (PN) that responded only to CQ (red bars), only to heat (blue bars), or to both stimuli (purple bars).
Fig. 7.
Fig. 7.
Highly multiplexed in situ hybridization reveals subsets of molecularly and functionally diverse projection neurons in the superficial dorsal horn. (AL) Representative superficial dorsal horn section illustrates Retrobead (RB)-labeled projection neurons from heat (Fos) and chloroquine (tdT)-stimulated TRAP2 mice. A subset of projection neurons is activated by heat (50 °C), but not chloroquine (AF); other subsets are activated by chloroquine only (G), both heat and chloroquine (HJ), or neither stimulus (K and L). Each functionally defined subset includes projection neurons that express varying combinations of the genes Tacr1, Cck, Nptx2, and Crh.
Fig. 8.
Fig. 8.
NK1R-negative projection neurons are also molecularly heterogeneous. Representative Retrobead (RB)-labeled projection neurons in superficial (AC) and deep dorsal horn (D and E) of TRAP2 mice that are negative for Tacr1 express different combinations of Cck, Nptx2, and Crh. The illustrated projection neurons respond either only to heat (50 °C; i.e., Fos mRNA+; A, B, and D) or neither to heat nor chloroquine (Fos mRNA and tdT mRNA; C and E).

Similar articles

Cited by

References

    1. Todd A. J., Neuronal circuitry for pain processing in the dorsal horn. Nat. Rev. Neurosci. 11, 823–836 (2010). - PMC - PubMed
    1. Braz J., Solorzano C., Wang X., Basbaum A. I., Transmitting pain and itch messages: A contemporary view of the spinal cord circuits that generate gate control. Neuron 82, 522–536 (2014). - PMC - PubMed
    1. LaMotte R. H., Dong X., Ringkamp M., Sensory neurons and circuits mediating itch. Nat. Rev. Neurosci. 15, 19–31 (2014). - PMC - PubMed
    1. Koch S. C., Acton D., Goulding M., Spinal circuits for touch, pain, and itch. Annu. Rev. Physiol. 80, 189–217 (2018). - PMC - PubMed
    1. Peirs C., Seal R. P., Neural circuits for pain: Recent advances and current views. Science 354, 578–584 (2016). - PMC - PubMed

Publication types

MeSH terms