. 2021 Jul 7;12(1):4193.
doi: 10.1038/s41467-021-24348-6.

Whole-genome profiling of nasopharyngeal carcinoma reveals viral-host co-operation in inflammatory NF-κB activation and immune escape

Affiliations

Whole-genome profiling of nasopharyngeal carcinoma reveals viral-host co-operation in inflammatory NF-κB activation and immune escape

Jeff P Bruce et al. Nat Commun. .

Erratum in

Abstract

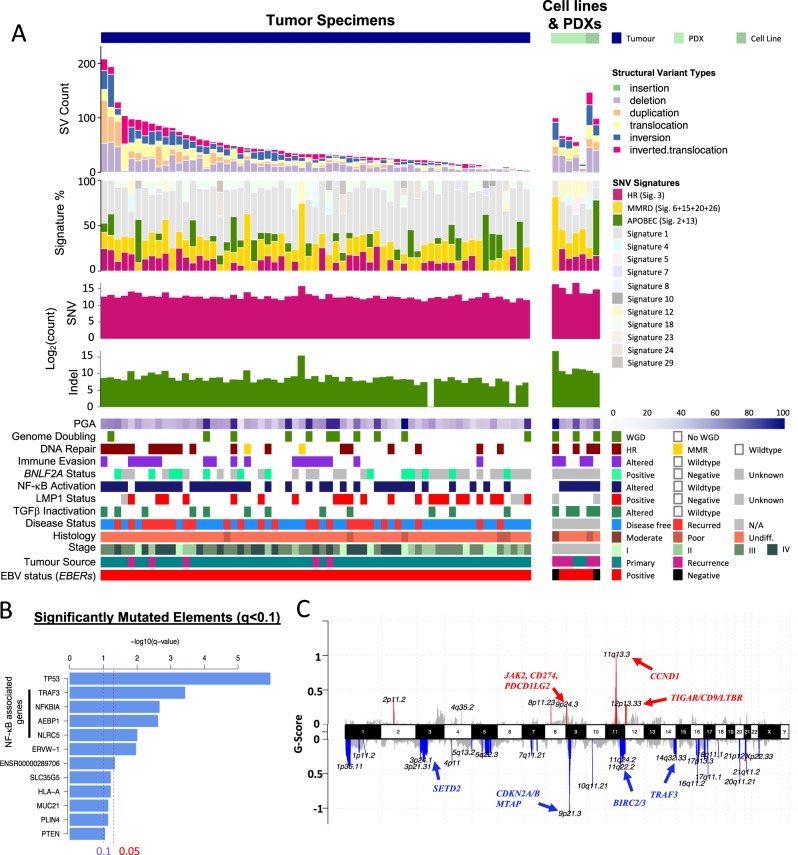
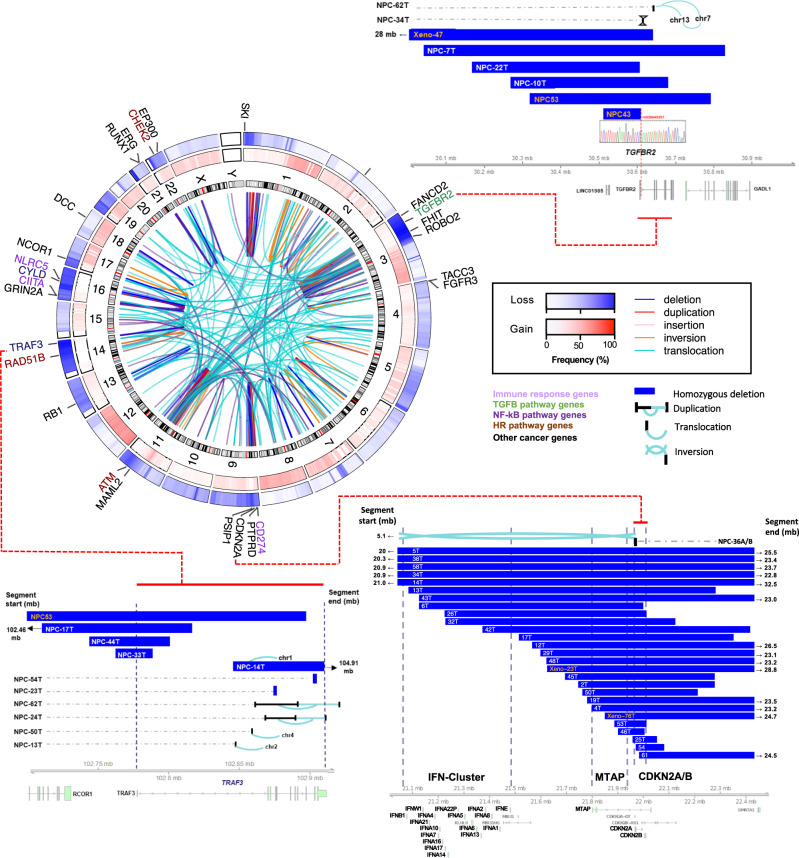
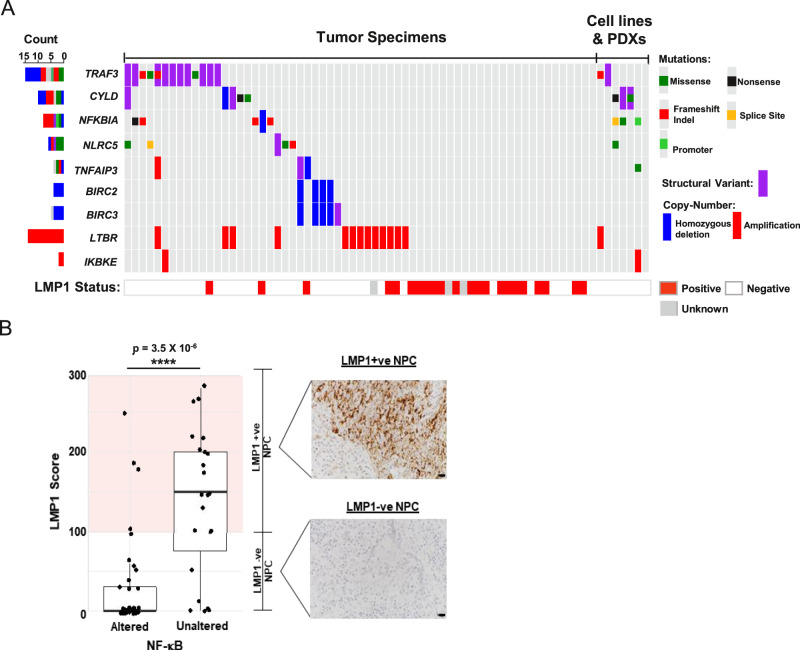
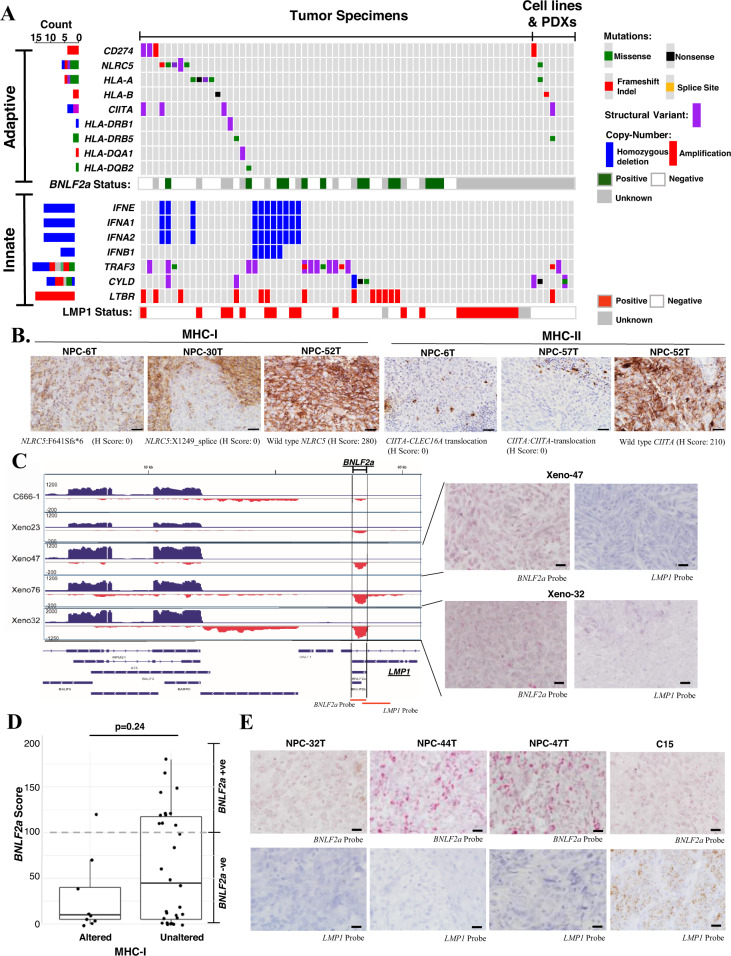
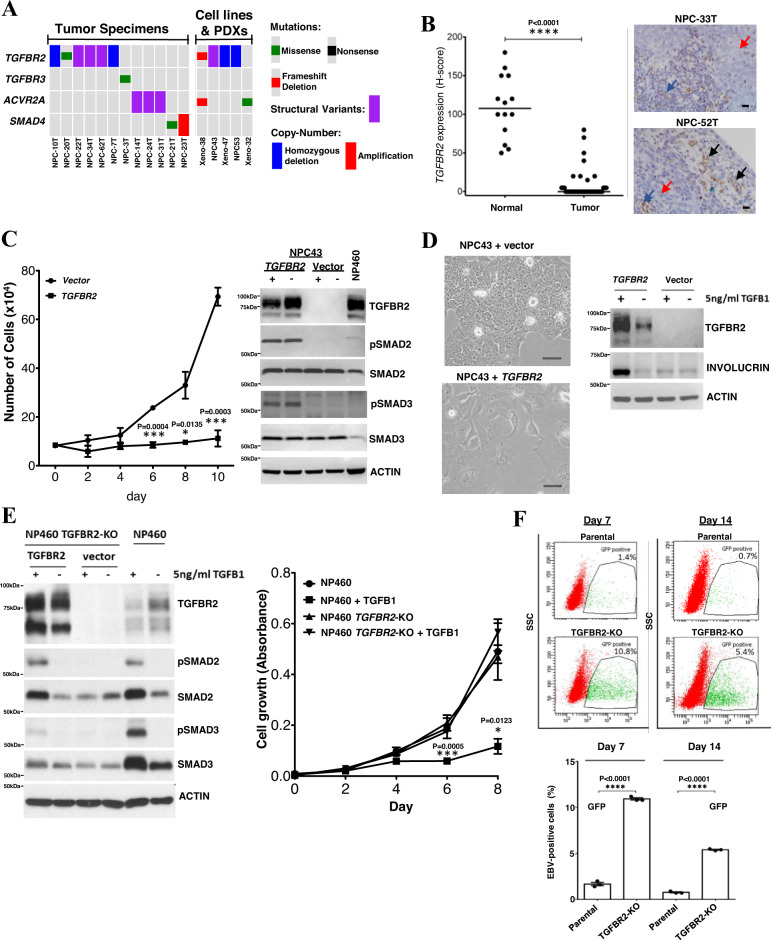
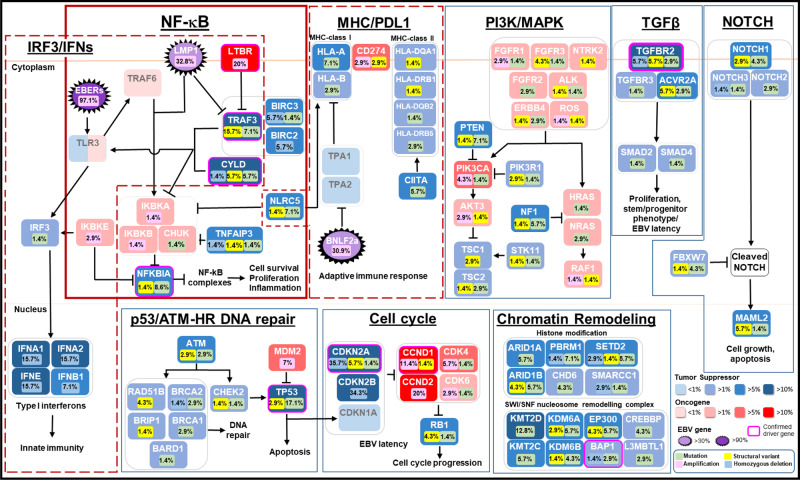
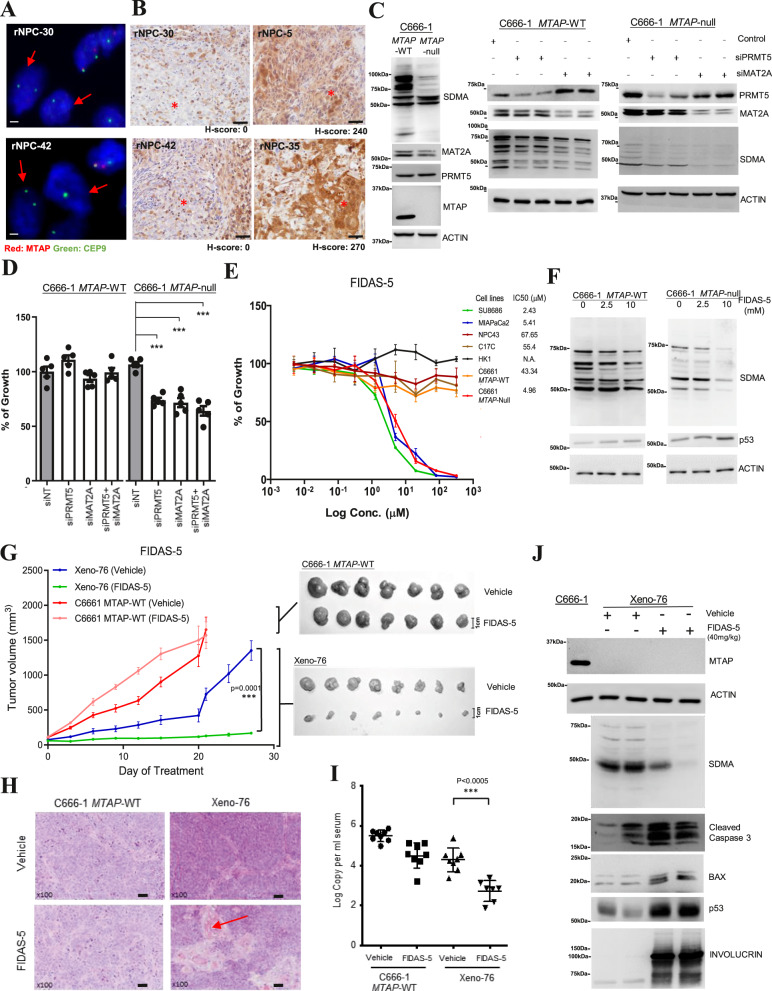
Interplay between EBV infection and acquired genetic alterations during nasopharyngeal carcinoma (NPC) development remains vague. Here we report a comprehensive genomic analysis of 70 NPCs, combining whole-genome sequencing (WGS) of microdissected tumor cells with EBV oncogene expression to reveal multiple aspects of cellular-viral co-operation in tumorigenesis. Genomic aberrations along with EBV-encoded LMP1 expression underpin constitutive NF-κB activation in 90% of NPCs. A similar spectrum of somatic aberrations and viral gene expression undermine innate immunity in 79% of cases and adaptive immunity in 47% of cases; mechanisms by which NPC may evade immune surveillance despite its pro-inflammatory phenotype. Additionally, genomic changes impairing TGFBR2 promote oncogenesis and stabilize EBV infection in tumor cells. Fine-mapping of CDKN2A/CDKN2B deletion breakpoints reveals homozygous MTAP deletions in 32-34% of NPCs that confer marked sensitivity to MAT2A inhibition. Our work concludes that NPC is a homogeneously NF-κB-driven and immune-protected, yet potentially druggable, cancer.


Conflict of interest statement

All authors declare no competing interests directly related to the current study. V.W.Y. Lui receives funding from a University-Industry Collaboration Program (UIM/329) by the Innovation and Technology Fund, Hong Kong government, and Lee’s Pharmaceutical (Hong Kong Limited) for the period of 2018–2020, and also served as a scientific consultant for Novartis Pharmaceutical (Hong Kong) Limited (Oct 2015-Oct 2016). B.B.Y. Ma received speaker’s honorarium and serves in the advisory board of Bristol-Myers Squibb (BMS), MSD and Novartis, Hong Kong. She has received a research grant from Novartis and Boerhinger Ingelheim. E.P. Hui received speaker’s honoraria and serves in the advisory board of Merck Sharp & Dohme (MSD) and Merck Serono. A.T.C. Chan received research and travel grants from MSD, Pfizer, and Roche. The other authors declare no competing interests.

Figures

Fig. 1
Fig. 1. Whole-genome landscape of NPC.
A Somatic gene alterations and mutational signatures of 70 NPC tumors. For each tumor, the number and types of SNVs and SVs, mutation signatures, whole-genome doubling, and percent genome altered (PGA) were shown in the top panels, as well as somatic changes detected in NF-κB, DNA repair, and TGF-β pathways, expression of EBV-encoded LMP1, BNLF2a and EBERs, clinical staging and tumor type. B Significantly mutated genes and regulatory elements (q < 0.1) identified in NPC. The altered genes in NF-κB pathways are indicated. C Copy number alterations in NPC. GISTIC copy number variations analysis showing recurrent amplification and deletion of multiple chromosomal regions.
Fig. 2
Fig. 2. Recurrent structural and chromosomal alterations in NPC.
Circos plot showing recurrent SVs and common CNVs in NPC. Frequencies of copy number losses and gains are shown in the outer and inner circles respectively. Selected cancer genes involved in the recurrent inter- and intra-chromosomal SVs (i.e., genes with ≥3 times altered by SVs) are indicated. Homozygous deletions and structural alteration breakpoints identified in CDKN2A/B loci, MTAP, and cluster of type I IFN genes at 9p13.3, TGFBR2 at 3p24.1, and TRAF3 at 14q32.3 are shown. The DNA sequences spanning the breakpoints of deletion of TGFBR2 identified in NPC43 and Xeno-47 were confirmed by Sanger DNA sequencing.
Fig. 3
Fig. 3. Aberrant NF-κB pathway activated by somatic gene alterations and EBV latent gene.
A Somatic aberrations activating NF-κB and LMP expression in 70 NPC samples. NPC tumors with LMP1 overexpression are also indicated. B LMP1 overexpression and somatic aberrations activating NF-κB pathway are mutually exclusive at the whole-genome level in NPC (two-sided Fisher’s exact test p = 3.5 × 10−6, ****P < 0.0001). Boxplot is defined as follows: center upper whisker = min(max(x), Q_3 + 1.5 * IQR), lower whisker = max(min(x), Q_1 – 1.5 * IQR); where IQR = Q_3−Q_1, the bounds of the box. LMP1 expression was examined in NPC tumor specimens (n = 65) by immunohistochemistry staining. IHC staining and scoring were performed twice in the tumors and similar results were observed. Representative images of NPC cases with high (+ve) or absence/low (−ve) LMP1 expression are shown. Scale bar: 10 μm. Source data are provided as a Source Data file.
Fig. 4
Fig. 4. Impaired innate and adaptive immunity by somatic gene alterations and EBV latent gene expression in NPC.
A Somatic aberrations and EBV-encoded LMP1 and BNLF2a expression attenuate adaptive and innate immunities in NPC are shown. B By immunohistochemistry analysis, loss of MHC-class I and MHC-class II expression are demonstrated in representative NPC cases with somatic alterations of NLRC5 (n = 3; NPC-6T, NPC-30T, NPC-52T) and CIITA (n = 3; NPC-6T, NPC-52T, NPC-57T), respectively. The experiments were performed twice and similar results were found. Representative images of MHC-class I and MHC-class II expression in the NPC cases with wild-type or somatic alterations of NLRC5 and CIITA genes are illustrated. Scale bar: 20 μm. C RNA-sequencing revealed the expression of BNLF2a in NPC PDXs. The partial EBV transcription profiles illustrating BNLF2a expression in NPC cell line (C666-1) and PDXs (Xeno-23, Xeno-47, Xeno-76, and Xeno-32) were shown. The RISH probe targeted regions (BNLF2a, LMP1) in EBV genome are indicated. By RISH analysis, abundant expression of BNLF2a transcripts was found in the majority of tumor cells in two NPC PDXs, Xeno-32 and Xeno-47. BNLF2a probe was used to illustrate the signal of BNLF2a transcripts in the tumor cells with no LMP1 probe signal. Each tumor was subjected to RISH analysis twice and similar results were found. Representative images of RISH results of BNLF2a and LMP1 in NPCs are illustrated. Scale bar: 10 μm. D Enrichment of BNLF2A-expressing cases in NPCs without somatic alterations in MHC-class I pathway (two-sided Wilcoxon signed-rank p = 0.24). Boxplot is defined as follows: center upper whisker = min(max(x), Q_3+1.5*IQR), lower whisker = max(min(x), Q_1−1.5*IQR); where IQR = Q_3−Q_1, the bounds of the box. BNLF2A expression was determined in NPC specimens (n = 39) by RISH. E Representative NPC tumors (NPC-32T, NPC-44T, NPC-47T) with high BNLF2a expression are shown. An LMP1-expressing xenograft C15 was included for RISH analysis using BNLF2a and LMP1 probes. Each tumor was subjected to RISH analysis twice and similar results were found. Scale bar: 10 μm. Source data are provided as a Source Data file.
Fig. 5
Fig. 5. TGFBR2 loss as a driver event in NPC.
A Somatic alterations of TGFBR2 and other genes in TGF-β/SMAD pathway. B RISH analysis of TGFBR2 expression in 41 NPCs and 14 adjacent normal epithelium. Significant downregulation of TGFBR2 was observed (Unpaired two-tailed t test, ****p < 0.0001, mean values of the data are presented) in NPC. Representative NPC cases (NPC33T, NPC-52T) showing no TGFBR2 expression in the tumor cells (red arrows) and positive signals in the infiltrating lymphocytes (blue arrows) and normal epithelium (black arrows). Scale bar: 10 μm. C Dramatic growth inhibition was found in wild-type TGFBR2 transfected TGFBR2-deleted NPC43 cells (unpaired two-tailed t test, *p < 0.05; ***p < 0.0005; data are presented as mean values ± SEM). Western blotting showed pSMAD2 and pSMAD3 overexpression in TGFBR2-expressing NPC43 cells. NP460 with TGFBR2 expression was included as control. Replication: n = 3 biologically independent experiments. D Re-introduction of wild-type TGFBR2 induced cell differentiation and morphological changes in NPC43 cells. In TGFBR2-expressing NPC43 cells, the levels of involucrin were increased upon TGF-β1 treatment, as compared with the vector control. Replication: n = 3 biologically independent experiments. Similar results were found in the repeated experiments. Scale bar: 50 μm. E CRISPR/Cas9-mediated knockout of TGFBR2 in NP460 (NP460KO) cells resulted in the loss of TGFBR2. No pSmad2 and pSmad3 expression were detected in NP460KO cells following TGF-β1 treatment. Re-expression of wild-type TGFBR2 in NP460KO cells restored its response to TGF-β1 as shown by the induction of pSmad2 and pSmad3. NP460KO cells showed significant growth inhibition when compared with parental NP460 cells after TGF-β1 treatment (unpaired two-tailed t test, *p < 0.05; ***p < 0.0005; data are presented as mean values ± SEM). Replication: n = 5 biologically independent experiments. F The parental NP460 and NP460KO cells were infected with a GFP-tagged recombinant EBV. After EBV infection and flow sorting of EBV-positive cells, significantly higher numbers of EBV-positive cells were maintained in TGFBR2 knockout NP460KO cells than those in parental cells on both day7 and day 14 (unpaired two-tailed t test, ****p < 0.0005, data are presented as mean values ± SEM). Replication: n = 3 biologically independent experiments. Source data are provided as a Source Data file.
Fig. 6
Fig. 6. Frequently altered cancer pathways in NPC at the whole-genome level.
Multiple genomic aberrations and EBV latent genes alter multiple cancer pathways in NPC.
Fig. 7
Fig. 7. MTAP deletion is pharmacologically vulnerable to MAT2A inhibition.
A FISH analysis detected homozygous deletion of MTAP in two NPC tumors (rNPC-30, rNPC-42). Scale bar: 1 μm. B Loss of MTAP expression was confirmed in MTAP-deleted NPC tumors (rNPC-30, rNPC-42) by IHC. In two NPC tumors without MTAP deletion, rNPC-5 and rNPC-35, representative images of MTAP expression were shown. Scale bar: 20 μm. Similar results were found in n = 2 independent FISH and IHC experiments. C Loss of MTAP expression and reduced SDMA in MTAP-null C666-1 cells. Knockdown of MAT2A and PRMT5 by siRNAs repressed SDMA in MTAP-null C666-1 cells. Similar effects were observed in n = 3 biologically independent experiments. D Knockdown of MAT2A and PRMT5 significantly inhibited cell growth of MTAP-null C666-1 cells. (unpaired two-tailed t test, ***p < 0.0005; data: mean values ± SEM; n = 5 biologically independent experiments). E FIDAS-5 inhibited the cell growth in MTAP-null C666-1 cells, but not parental C666-1 and MTAP-intact NPC cells (NPC43, C17C, HK1). The MTAP-deleted SU8686 and MIAPaCa2 cells were included as controls. IC50 of each cell line is shown (Data: mean values ± SEM). Replication: n = 5 biologically independent experiments. F Reduced SDMA and increased p53 expression were observed in FIDAS-5 treated MTAP-null C666-1. Similar findings were detected in n = 3 biologically independent experiments. G Marked in vivo inhibition of MTAP-deleted Xeno-76 by FIDAS-5. Growth curves and harvested tumors of C666-1 (MTAP-WT) (n = 8) and Xeno-76 (n = 7) in nude mice treated with vehicle or FIDAS-5 are shown (unpaired ANOVA test, ***p = 0.0001, data: mean values ± SEM). H The morphological changes (cell differentiation and keratin production (red arrow)) are illustrated in representative H&E-stained tissue sections of FIDAS-5 treated Xeno-76. Scale bar: 50 μm. I Circulating EBV DNA copies were significantly reduced in the Xeno-76 mice after FIDAS-5 treatment. (Unpaired two-tailed t test, ***p < 0.0005; data: mean values ± SEM). The blood samples examined in each treatment group of Xeno-76 and C666-1 MTAP-WT are n = 8 and n = 7, respectively. J FIDAS-5 treated Xeno-76 showed reduced SDMA, and increased cleaved caspase 3, BAX, p53, and involucrin expression. Similar effects were shown in n = 3 biologically independent experiments. Source data are provided as a Source Data file.

References

    1. Lo KW, To KF, Huang DP. Focus on nasopharyngeal carcinoma. Cancer Cell. 2004;5:423–428. - PubMed
    1. Tsang CM, Lui VWY, Bruce JP, Pugh TJ, Lo KW. Translational genomics of nasopharyngeal cancer. Semin. Cancer Biol. 2020;61:84–100. - PubMed
    1. Tsao SW, Tsang CM, To KF, Lo KW. The role of Epstein-Barr virus in epithelial malignancies. J. Pathol. 2015;235:323–333. - PMC - PubMed
    1. Shannon-Lowe C, Rickinson A. The global landscape of EBV-associated tumors. Front. Oncol. 2019;9:713. - PMC - PubMed
    1. Giulino L, et al. A20 (TNFAIP3) genetic alterations in EBV-associated AIDS-related lymphoma. Blood. 2011;117:4852–4854. - PMC - PubMed

Publication types

MeSH terms

Substances