Clinical Trial
. 2021 Jul 7;12(1):4172.
doi: 10.1038/s41467-021-24457-2.

Sensitive detection of tumor mutations from blood and its application to immunotherapy prognosis

Affiliations
Clinical Trial

Sensitive detection of tumor mutations from blood and its application to immunotherapy prognosis

Shuo Li et al. Nat Commun. .

Abstract

Cell-free DNA (cfDNA) is attractive for many applications, including detecting cancer, identifying the tissue of origin, and monitoring. A fundamental task underlying these applications is SNV calling from cfDNA, which is hindered by the very low tumor content. Thus sensitive and accurate detection of low-frequency mutations (<5%) remains challenging for existing SNV callers. Here we present cfSNV, a method incorporating multi-layer error suppression and hierarchical mutation calling, to address this challenge. Furthermore, by leveraging cfDNA's comprehensive coverage of tumor clonal landscape, cfSNV can profile mutations in subclones. In both simulated and real patient data, cfSNV outperforms existing tools in sensitivity while maintaining high precision. cfSNV enhances the clinical utilities of cfDNA by improving mutation detection performance in medium-depth sequencing data, therefore making Whole-Exome Sequencing a viable option. As an example, we demonstrate that the tumor mutation profile from cfDNA WES data can provide an effective biomarker to predict immunotherapy outcomes.


Conflict of interest statement

X.J.Z., W.L., and W.H.W. are co-founders of EarlyDiagnostics Inc. X.N., S.L., and M.L.S. are employees of EarlyDiagnostics Inc. The authors have filed a patent application on methods described in this manuscript. The other authors have no competing interests to declare.

Figures

Fig. 1
Fig. 1. cfSNV framework and its techniques.
a The workflow of conventional SNV callers takes the genomic data of a tumor and its matched normal tissue as inputs. b Five techniques introduced in cfSNV that modify the standard workflow. c Full workflow of cfSNV. cfSNV takes plasma DNA and germline DNA sequencing data as inputs. No tumor samples are needed. It first merges overlapping read pairs in cfDNA sequencing data. Next, we apply standard data preprocessing tools. An iterative procedure then detects mutation clusters and estimates their frequencies θ based on multiple, automatically selected potential mutation loci. Each iteration determines joint genotypes across sequencing regions to predict somatic SNV candidates, and masks the mutation candidates before proceeding. After all clusters and mutation candidates have been detected, a random forest classifier identifies raw read pairs with sequencing errors. Finally, somatic SNVs are reported and detected only if enough variant supporting read pairs pass the random forest screening. The background color of steps in c corresponds to the feature listed in b.
Fig. 2
Fig. 2. cfSNV outperforms competing methods in sensitivity and precision, especially for low-frequency mutations (VAF < 5%).
a The sensitivity of three variant calling methods on simulation data (n = 6) as a function of VAF for cfSNV, MuTect, and Strelka2. Mutations were grouped based on their simulated VAF, and the sensitivity at each simulated VAF level was calculated separately. The specificity and the precision of all three methods remained at comparable and high level (Table 1). All curves were fitted using logit functions. b The precision of three variant calling methods on patient data (n = 36) as a function of VAF. Mutations detected from all samples were grouped based on their rounded VAF (two decimal places). The precision at each VAF level was estimated by the confirmation rate. The sensitivity of patient data cannot be quantified because of the unknown ground truth, but cfSNV detected the most true positive mutations. Note that MuTect has no result when VAF < 2% because its default configuration treats all mutation candidates with VAF < 2% as contamination errors, and all curves here were fitted using logit functions.
Fig. 3
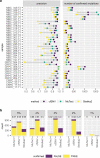
Fig. 3. Somatic SNV calling on cfDNA sequencing samples from cancer patients.
a Total number of confirmed mutations and precision using cfSNV, MuTect, and Strelka2. The precision is the number of confirmed mutations (in either the tumor biopsy or the plasma sample) divided by the total number of detected mutations. In the sample name, T1 and T2 indicate the first time point and the second time point of blood plasma samples respectively. b The total number of low-frequency variants and their confirmation status found by cfSNV, MuTect and Strelka2 from all plasma samples. Low-frequency variants are divided into five groups according to their rounded VAF, and the number of confirmed and unconfirmed mutations for each variant group are plotted in five subfigures for comparing between our method and two competing methods. The number at the top of each bar indicates the precision.
Fig. 4
Fig. 4. Experimental analysis of five techniques.
a Performance of mutation cluster frequency estimation in terms of the correlation between the estimated tumor fraction and the true dilution ratio. This experiment uses simulated data based on WES of a single patient, with dilution ratios ranging from 2 to 20%. The points and the error bars are presented as mean ± s.d. of independently generated datasets (n = 5) at each dilution. The p-value was calculated from two-sided Pearson’s correlation test: Pearson’s correlation = 0.99 (95% CI = [0.95, 1.00]), two-sided Pearson’s correlation test p-value = 1.627e−06 (t statistic = 9.1154, df = 57), n = 40. b the fold change in the likelihood ratio between cfSNV models with and without a step to estimate the mutation cluster frequency, based on simulated mutations at different VAFs. c Number of confirmed mutations and all mutations detected with and without the iterative screening procedure. d Confirmation rate of rescued mutations after adjusting conventional site-level post-filtration. e, f Performance of read-level variant classifier on independent testing data. e The averaged receiver operating characteristic curve (ROC) of applying the classifier to labeled data taken from 24 cfDNA sequencing samples of 12 metastatic breast cancer patients. f The averaged ROC of applying the classifier to labeled data taken from 12 cfDNA sequencing samples of 6 metastatic prostate cancer patients.
Fig. 5
Fig. 5. Kaplan–Meier curves for progression-free survival (PFS) on the pre-treatment cfDNA sequencing data of 30 advanced NSCLC patients.
ac Kaplan–Meier curves based on truncal-bTMB calculated using MuTect, Strelka2, and cfSNV. The high-burden and low-burden groups in each plot are defined by the median value of the measure: MuTect (a, hazard ratio (HR) = 0.839, 95% CI [0.403, 1.747], Z statistic = −0.48), Strelka2 (b, HR = 0.745, 95% CI [0.352, 1.581], Z statistic = −0.76), or cfSNV (c, HR=0.438, 95% CI [0.205, 0.938], Z statistic = −2.07). df, Kaplan–Meier curves based on bTMB calculated using MuTect, Strelka2, and cfSNV. The high-burden and low-burden groups in each plot are defined by the median value of the measure: MuTect (d, HR = 0.948, 95% CI [0.451, 1.990], Z statistic = −0.14), Strelka2 (e, HR = 0.883, 95% CI [0.415, 1.880], Z statistic = −0.33), or cfSNV (f, HR = 0.611, 95% CI [0.288, 1.295], Z statistic = −1.29). All p-values were calculated from one-sided log-rank test. There is no multiple testing adjustment.

References

    1. VanderLaan PA, et al. Success and failure rates of tumor genotyping techniques in routine pathological samples with non-small-cell lung cancer. Lung Cancer. 2014;84:39–44. doi: 10.1016/j.lungcan.2014.01.013. - DOI - PMC - PubMed
    1. Zill OA, et al. The landscape of actionable genomic alterations in cell-free circulating tumor DNA from 21,807 advanced cancer patients. Clin. Cancer Res. 2018;24:3528–3538. doi: 10.1158/1078-0432.CCR-17-3837. - DOI - PubMed
    1. Cohen JD, et al. Detection and localization of surgically resectable cancers with a multi-analyte blood test. Science. 2018;359:926–930. doi: 10.1126/science.aar3247. - DOI - PMC - PubMed
    1. Kang S, et al. CancerLocator: non-invasive cancer diagnosis and tissue-of-origin prediction using methylation profiles of cell-free DNA. Genome Biol. 2017;18:53. doi: 10.1186/s13059-017-1191-5. - DOI - PMC - PubMed
    1. Li W, et al. CancerDetector: ultrasensitive and non-invasive cancer detection at the resolution of individual reads using cell-free DNA methylation sequencing data. Nucleic Acids Res. 2018;46:e89–e89. doi: 10.1093/nar/gky423. - DOI - PMC - PubMed

Publication types

MeSH terms