. 2021 Jul 7;11(1):13971.
doi: 10.1038/s41598-021-92851-3.

Genomic epidemiology of SARS-CoV-2 in the UAE reveals novel virus mutation, patterns of co-infection and tissue specific host immune response

Affiliations

Genomic epidemiology of SARS-CoV-2 in the UAE reveals novel virus mutation, patterns of co-infection and tissue specific host immune response

Rong Liu et al. Sci Rep. .

Erratum in

Abstract

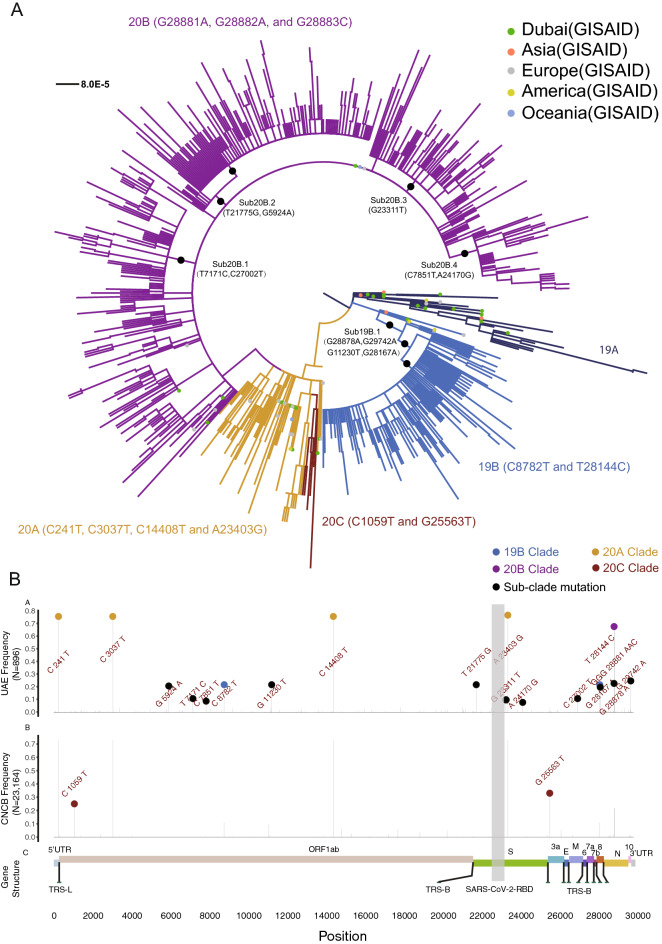
To unravel the source of SARS-CoV-2 introduction and the pattern of its spreading and evolution in the United Arab Emirates, we conducted meta-transcriptome sequencing of 1067 nasopharyngeal swab samples collected between May 9th and Jun 29th, 2020 during the first peak of the local COVID-19 epidemic. We identified global clade distribution and eleven novel genetic variants that were almost absent in the rest of the world and that defined five subclades specific to the UAE viral population. Cross-settlement human-to-human transmission was related to the local business activity. Perhaps surprisingly, at least 5% of the population were co-infected by SARS-CoV-2 of multiple clades within the same host. We also discovered an enrichment of cytosine-to-uracil mutation among the viral population collected from the nasopharynx, that is different from the adenosine-to-inosine change previously reported in the bronchoalveolar lavage fluid samples and a previously unidentified upregulation of APOBEC4 expression in nasopharynx among infected patients, indicating the innate immune host response mediated by ADAR and APOBEC gene families could be tissue-specific. The genomic epidemiological and molecular biological knowledge reported here provides new insights for the SARS-CoV-2 evolution and transmission and points out future direction on host-pathogen interaction investigation.


Conflict of interest statement

The authors declare no competing interests.

Figures

Figure 1
Figure 1
COVID-19 outbreak in the United Arab Emirates and the samples subjected for sequencing in this study. (A) Number of confirmed infected cases in the UAE (N = 461,444) until Mar 31st, 2021 was shown in the blue line and the number of subjects sequenced by meta-transcriptomic sequencing (N = 1067) was shown in the red bars. Important dates reflecting governmental responses were marked in black text. (B) Assembly quality of the 1067 viral genomes as a function of the RT-PCR Ct value and SARS-CoV-2 reads per million sequencing reads. Color represents assembly quality stratified by the number of gaps. (C) Allele frequency spectrum of the 1245 genetic variants identified from the 896 assemblies with less than 2% gaps.
Figure 2
Figure 2
Phylogenetic analysis of the sequenced UAE viral population during May and June. (A) Maximum likelihood tree of the 637 unique viral genomes with less than 2% gaps and 52 closest relatives from GISAID. Each line indicates a sample colored by the five dominant viral clades worldwide (19A: MidnightBlue, 19B: RoyalBlue, 20A: GoldEnrod, 20B: Purple, 20C: SaddleBrown), annotated with the clade definitive genetic variation. The closest relatives from GISAID were marked by a dot colored by geographical district reported for the viral sample. The subclade-definitive genetic variations were marked in black. (B) Comparison of the alternative allele frequency of the 1245 viral genetic variants between the 896 high quality UAE viral genomes and the 23,164 viral genomes from the globe downloaded from the China National Center for Bioinformation. Nomenclature of the clades was detailed in “Supplementary Notes”.
Figure 3
Figure 3
Functional analysis of the unique variants and subclade in the UAE samples. RT-qPCR Ct value distribution for samples in each of the five dominant clades and five subclades. Shown is the p-value using Kruskai–Wallis test and p-value by performing T-test comparing the Ct value for patients carrying certain clade or subclade virus strains with the rest of the patients who did not carry the virus belong to a specific clade or subclade.
Figure 4
Figure 4
Human-to-human transmission across settlements. (A) Geographical distribution of 120 viral samples with settlement level information in the Abu Dhabi city. (B) Transmission network of the 120 samples colored by settlements. (C) L1-norm genetic distance for longitudinal samples, samples from the same settlements, and samples from different settlements. Among the 130 samples that report settlement level geographical location in Table S5, ten samples were not displayed because only one sample were collected from that settlement. The UAE map was obtained from the world-geo.js file (https://gist.githubusercontent.com/munaf-zz/4630218/raw/32a389a88f990e01c2c7661c551c84af9eda1a26/world-geo.js) and plotted using jQuery JavaScript Library v1.11.1 and echart v3.7.2.
Figure 5
Figure 5
Co-infection with multiple SARS-CoV-2 variants. Evidence for human-to-human transmission of multiple SARS-CoV-2 variants were established using the clade and sub-clade definitive viral genetic variants. Columns display the de-identified sample ID that carried more than one SARS-CoV-2 viral variants in the nasopharyngeal swab sampling (N = 48). Color bar shows the viral clade assigned to the individual, according to the consensus viral sequence, reflecting the dominant clade in one sample. Rows indicate the eleven clade- definitive and eleven sub-clade definitive variants. Heatmap color, ranging from red to blue, suggests the allelic proportion of the derived allele of the iSNV. The ID of two longitudinal samples were marked in red.
Figure 6
Figure 6
Human innate immune response to SARS-CoV-2 mediated by the ADAR and APOBEC gene families. (A) Allelic faction (Column 1), the number of mutations (Column 2) and the number of recurrent mutations (Column 3) for twelve mutation types for six studies arranged by row. UAE: 896 nasal swab samples collected in our study; GISAID: 23,164 viral sequences collected; Spain: 36 nasal swab samples collected in Spain; Virginia: 35 nasal swab samples collected in Virginia and 112 nasal swab samples collected in Ruijin hospital in Shanghai city, China. (B) Host ADAR and APOBEC gene expression (logarithm of transcript per million) in the nasal swab samples for all and for each of the five clades.

References

    1. Zhu N, Zhang D, Wang W, Li X, Yang B, Song J, Zhao X, Huang B, Shi W, Lu R, Niu P, Zhan F, Ma X, Wang D, Xu W, Wu G, Gao GF, Tan W. A novel coronavirus from patients with pneumonia in China, 2019. N. Engl. J. Med. 2020 doi: 10.1056/nejmoa2001017. - DOI - PMC - PubMed
    1. Johnson NPAS, Mueller J. Updating the accounts: Global mortality of the 1918–1920 《Spanish》 influenza pandemic. Bull. Hist. Med. 2002 doi: 10.1353/bhm.2002.0022. - DOI - PubMed
    1. Dong E, Du H, Gardner L M. An interactive web-based dashboard to track COVID-19 in real time. The Lancet Infectious Diseases. 10.1016/S1473-3099(20)30120-1 (2020). - PMC - PubMed
    1. Guan W, Ni Z, Hu Y, Liang W, Ou C, He J, Liu L, Shan H, Lei C, Hui DSC, Du B, Li L, Zeng G, Yuen KY, Chen R, Tang C, Wang T, Chen P, Xiang J, Li S, Wang JL, Liang Z, Peng Y, Wei L, Liu Y, Hu YH, Peng P, Wang JM, Liu J, Chen Z, Li G, Zheng Z, Qiu S, Luo J, Ye C, Zhu S, Zhong N. Clinical characteristics of coronavirus disease 2019 in China. N. Engl. J. Med. 2020 doi: 10.1056/NEJMoa2002032. - DOI - PMC - PubMed
    1. Ashraf O, Virani A, Cheema T. COVID-19: An update on the epidemiological, clinical, preventive, and therapeutic management of 2019 novel coronavirus disease. Crit. Care Nurs. Q. 2021 doi: 10.1097/CNQ.0000000000000346. - DOI - PMC - PubMed

Publication types