. 2022 Jul;36(7):1461-1467.
doi: 10.1038/s41433-021-01672-1. Epub 2021 Jul 7.

Fluctuations in macular thickness in patients with diabetic macular oedema treated with anti-vascular endothelial growth factor agents

Affiliations

Fluctuations in macular thickness in patients with diabetic macular oedema treated with anti-vascular endothelial growth factor agents

Victoria Y Wang et al. Eye (Lond). 2022 Jul.

Abstract

Purpose: To evaluate retinal thickness fluctuations in patients with diabetic macular oedema (DMO) treated with anti-vascular endothelial growth factor (anti-VEGF) injections.

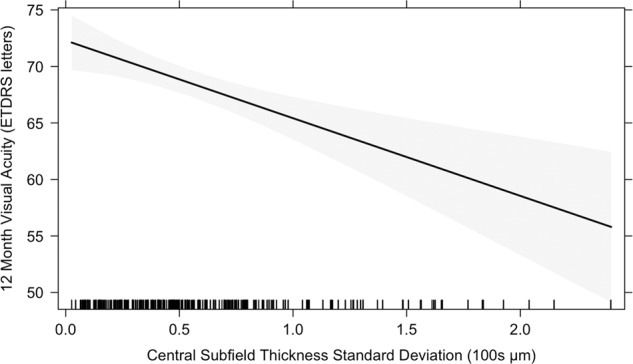
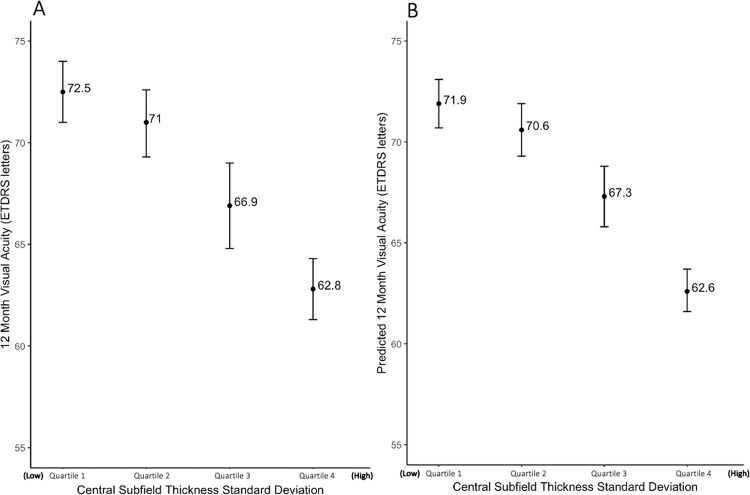
Methods: Visual acuity (VA) and central subfield thickness (CST) were collected at baseline, 3, 6, 9 and 12 months. Retinal thickness fluctuation was quantified by standard deviation (SD) of CST across 12 months. A mixed effects regression model evaluated the relationship between CST SD and VA at 12 months. Multiple linear regression analysis was performed to investigate predictors of CST SD.

Results: Mean baseline and 12-month VAs were 63.5 ± 15.7 and 69.0 ± 13.8 Early Treatment of Diabetic Retinopathy Study (ETDRS) letters (change = +5.1 ± 16.1 letters, p < 0.001). Mean baseline and 12-month CSTs were 396.9 ± 109.7 and 337.7 ± 100.7 μm (change = -59.2 ± 114.8 μm, p < 0.001). Retinal thickness variability across the first 12 months was 59.4 ± 43.6 μm. Stratification of patient eyes by CST SD demonstrated 9.7 letters difference in 12-month VA between first and fourth quartiles. Significant predictors of CST SD include baseline CST, injection type, laser treatment, and DR stage.

Conclusions: Larger retinal thickness fluctuations are associated with poorer visual outcomes in eyes with DMO treated with anti-VEGF injections. Retinal thickness variability may be an important prognostic biomarker for DMO patients.


Conflict of interest statement

RPS: Genentech/Roche (personal fees), Alcon/Novartis (personal fees), Apellis (grant), Graybug (grant), Zeiss (personal fees), Bausch + Lomb (personal fees), Regeneron Pharmaceuticals, Inc. (personal fees). The other authors declare no competing interests.

Figures

Fig. 1
Fig. 1. Patient selection workflow.
Two thousand five hundred and three patients with a documented diagnosis of DMO who were receiving anti-VEGF treatment were selected via electronic record query. Six hundred and thirty of these patients had continuous follow-up for at least 12 months and met the injection frequency criteria (excluded n = 1873). Two hundred and sixty-six patients were selected after excluding based on OCT frequency criteria, presence of concomitant macular disease, or concurrent administration of steroid or focal laser treatment (excluded n = 364).
Fig. 2
Fig. 2. Relationship between macular thickness variability and visual acuity at 12 months.
12-month visual acuity predicted by a mixed effects regression model using central subfield thickness standard deviation (CST SD) across 12 months as the predictor, adjusted for demographics, number of treatments and baseline variables. The shaded area represents the 95% confidence band; the rug plot shows the distribution of CST SD values.
Fig. 3
Fig. 3. Visual acuity by macular thickness variability quartiles.
A Actual 12-month visual acuity stratified by quartiles of central subfield thickness standard deviation (CST SD) across 12 months. B Predicted 12-month visual acuity using a mixed effects regression model, stratified by quartiles of central subfield thickness standard deviation (CST SD) across 12 months, adjusted for demographics, number of treatments and baseline variables. Error bars represent the standard error of each quartile.

References

    1. Lee R, Wong TY, Sabanayagam C. Epidemiology of diabetic retinopathy, diabetic macular edema and related vision loss. Eye Vis. 2015;2:17. doi: 10.1186/s40662-015-0026-2. - DOI - PMC - PubMed
    1. Cheung N, Mitchell P, Wong TY. Diabetic retinopathy. Lancet. 2010;376:124–36. doi: 10.1016/S0140-6736(09)62124-3. - DOI - PubMed
    1. Varma R, Bressler NM, Doan QV, et al. Prevalence of and risk factors for diabetic macular edema in the United States. JAMA Ophthalmol. 2014;132:1334–40. doi: 10.1001/jamaophthalmol.2014.2854. - DOI - PMC - PubMed
    1. Yau JW, Rogers SL, Kawasaki R, et al. Global prevalence and major risk factors of diabetic retinopathy. Diabetes Care. 2012;35:556–64. doi: 10.2337/dc11-1909. - DOI - PMC - PubMed
    1. Flaxel CJ, Adelman RA, Bailey ST, et al. Diabetic retinopathy preferred practice pattern(R) Ophthalmology. 2020;127:P66–145. doi: 10.1016/j.ophtha.2019.09.025. - DOI - PubMed

MeSH terms