Review
. 2021 Aug;16(8):4031-4067.
doi: 10.1038/s41596-021-00575-5. Epub 2021 Jul 7.

Scaling up reproducible research for single-cell transcriptomics using MetaNeighbor

Affiliations
Review

Scaling up reproducible research for single-cell transcriptomics using MetaNeighbor

Stephan Fischer et al. Nat Protoc. 2021 Aug.

Abstract

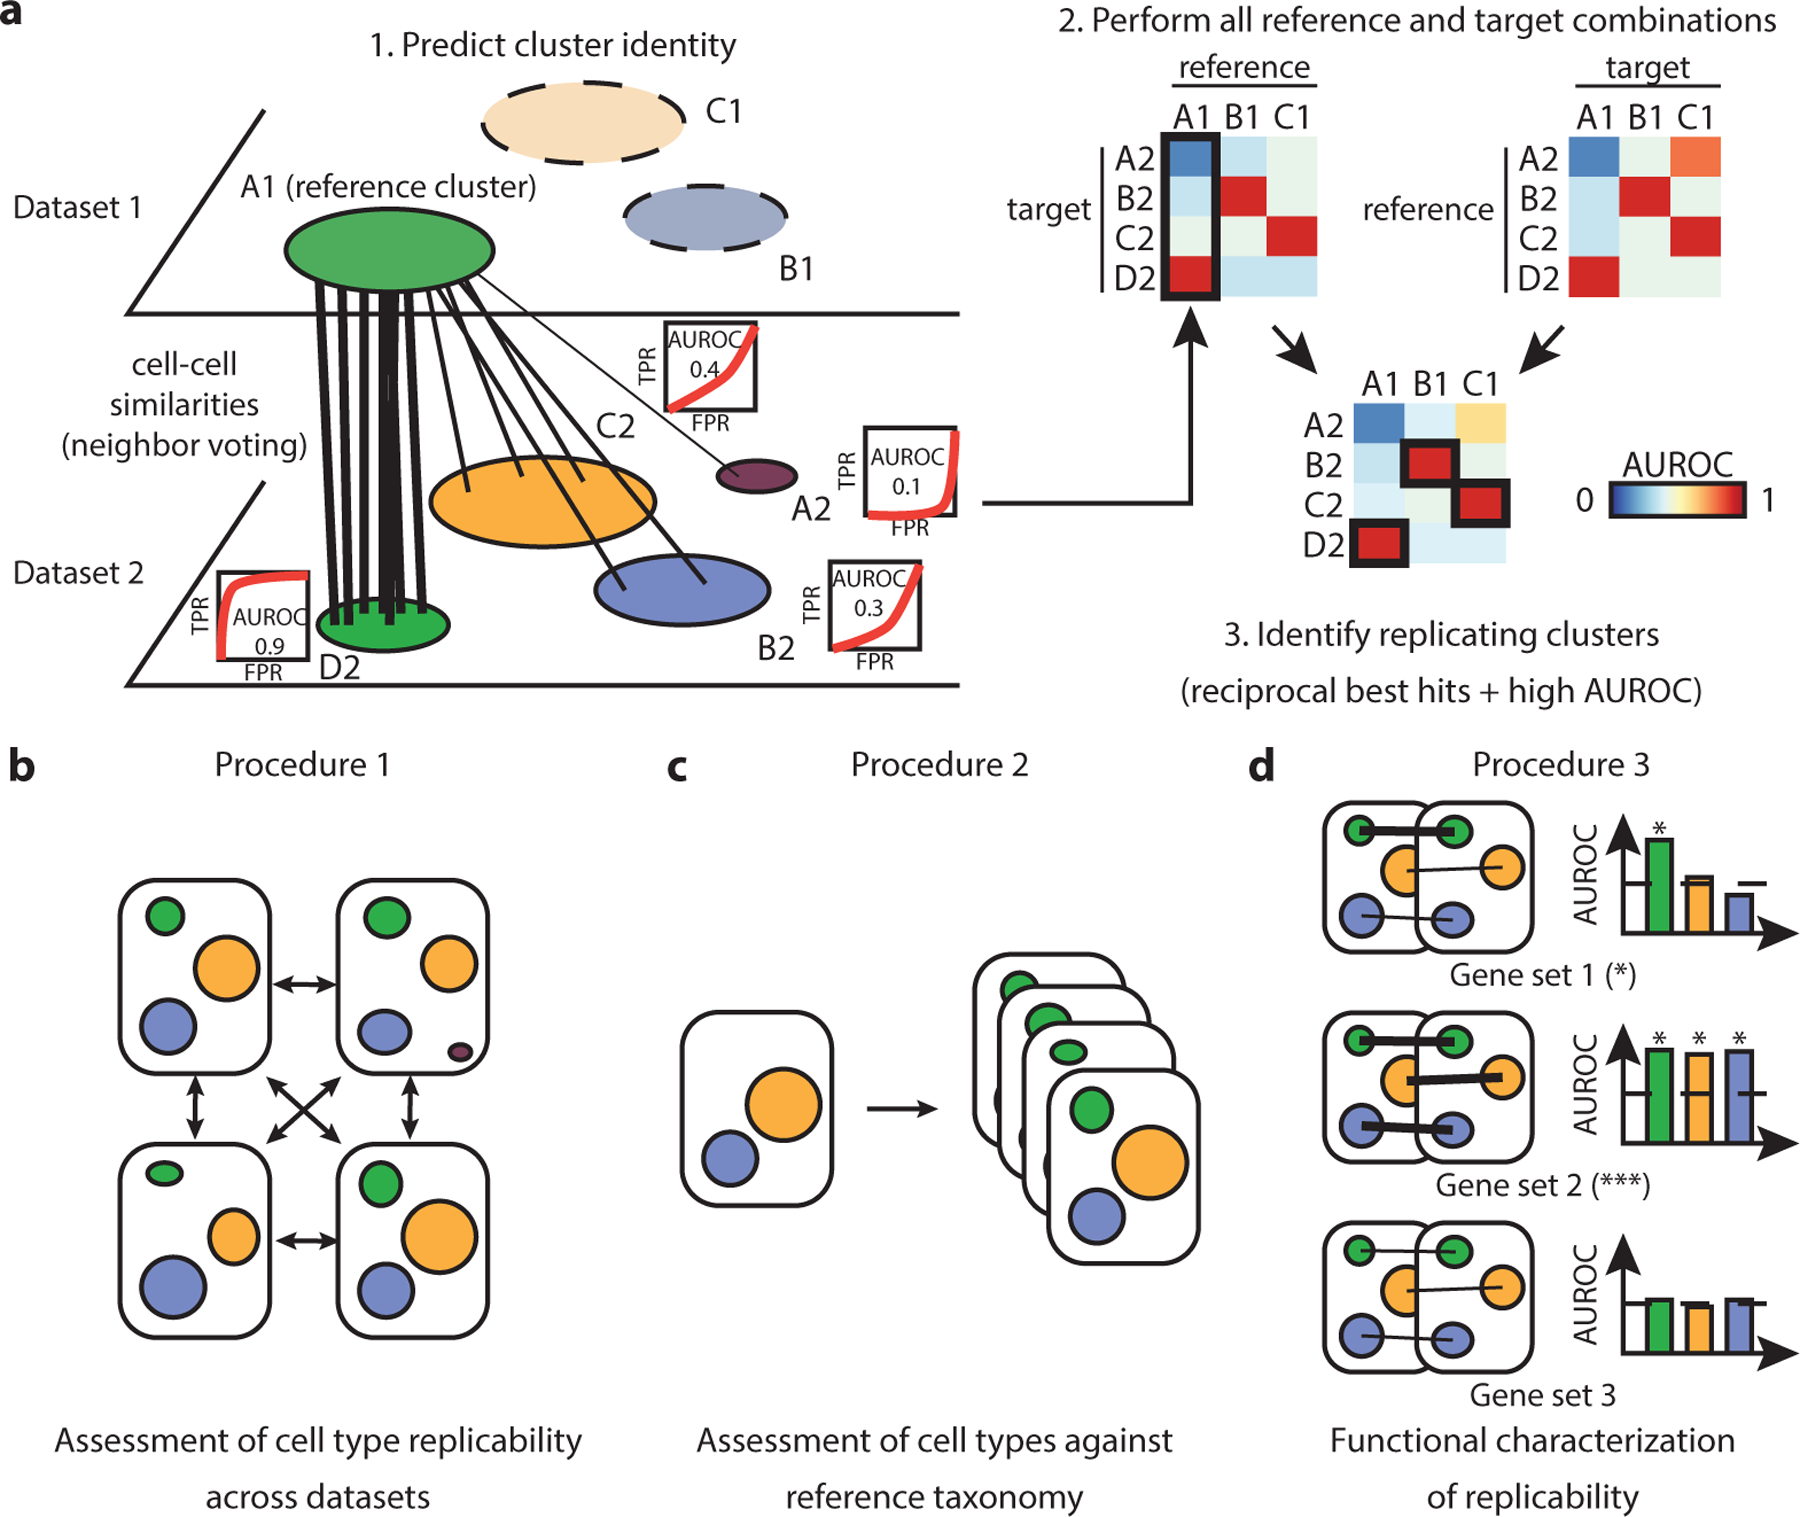
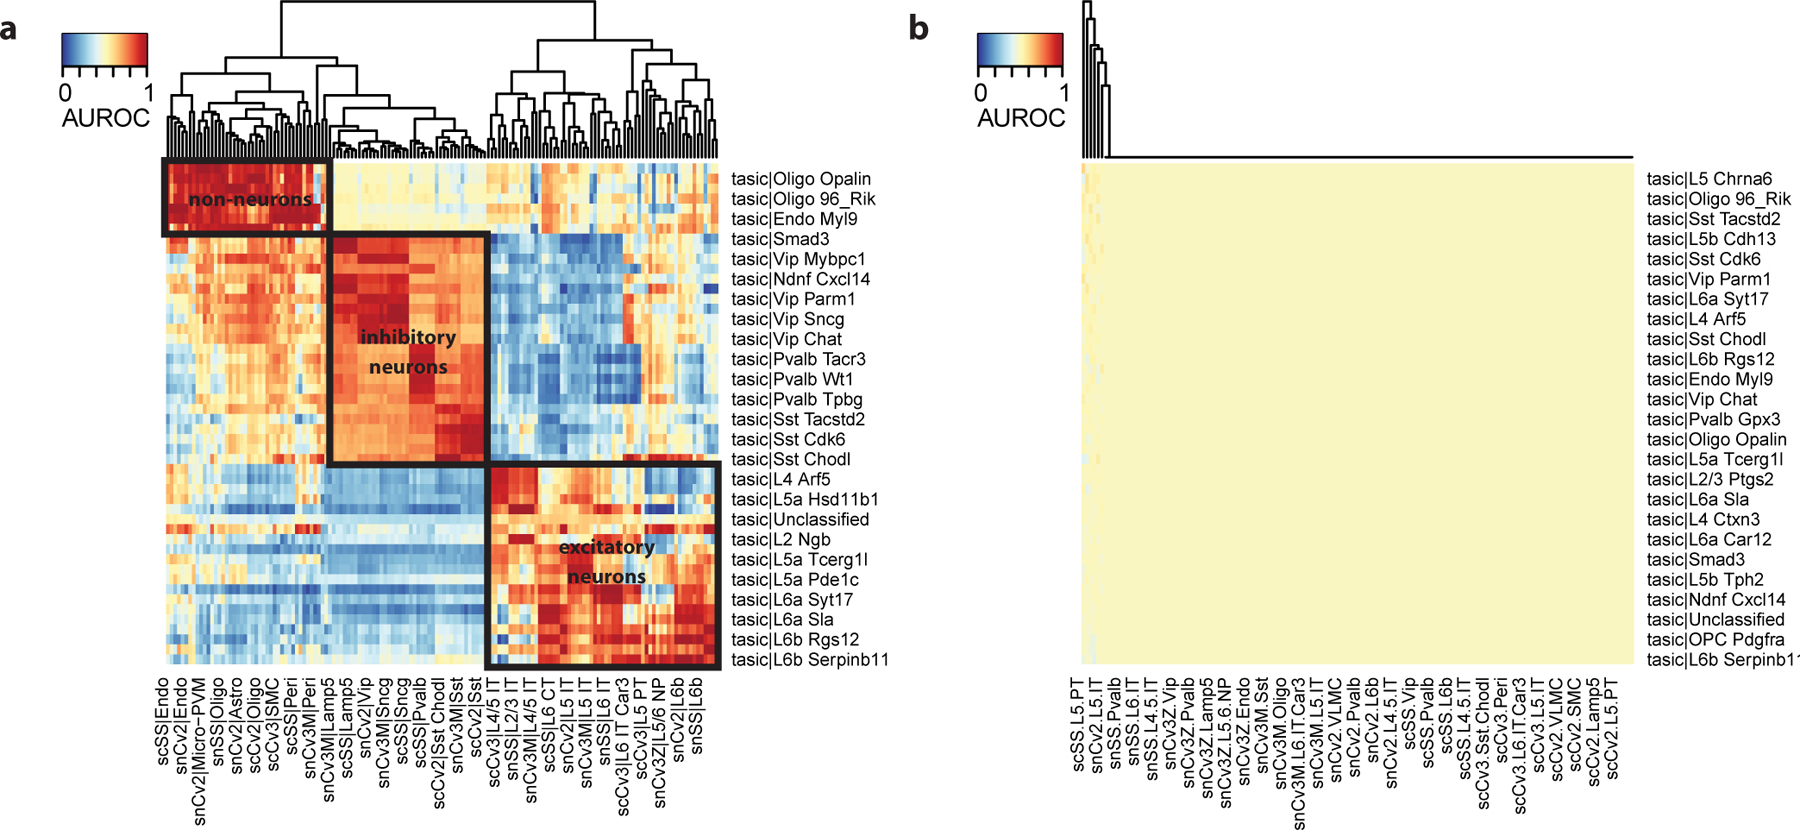
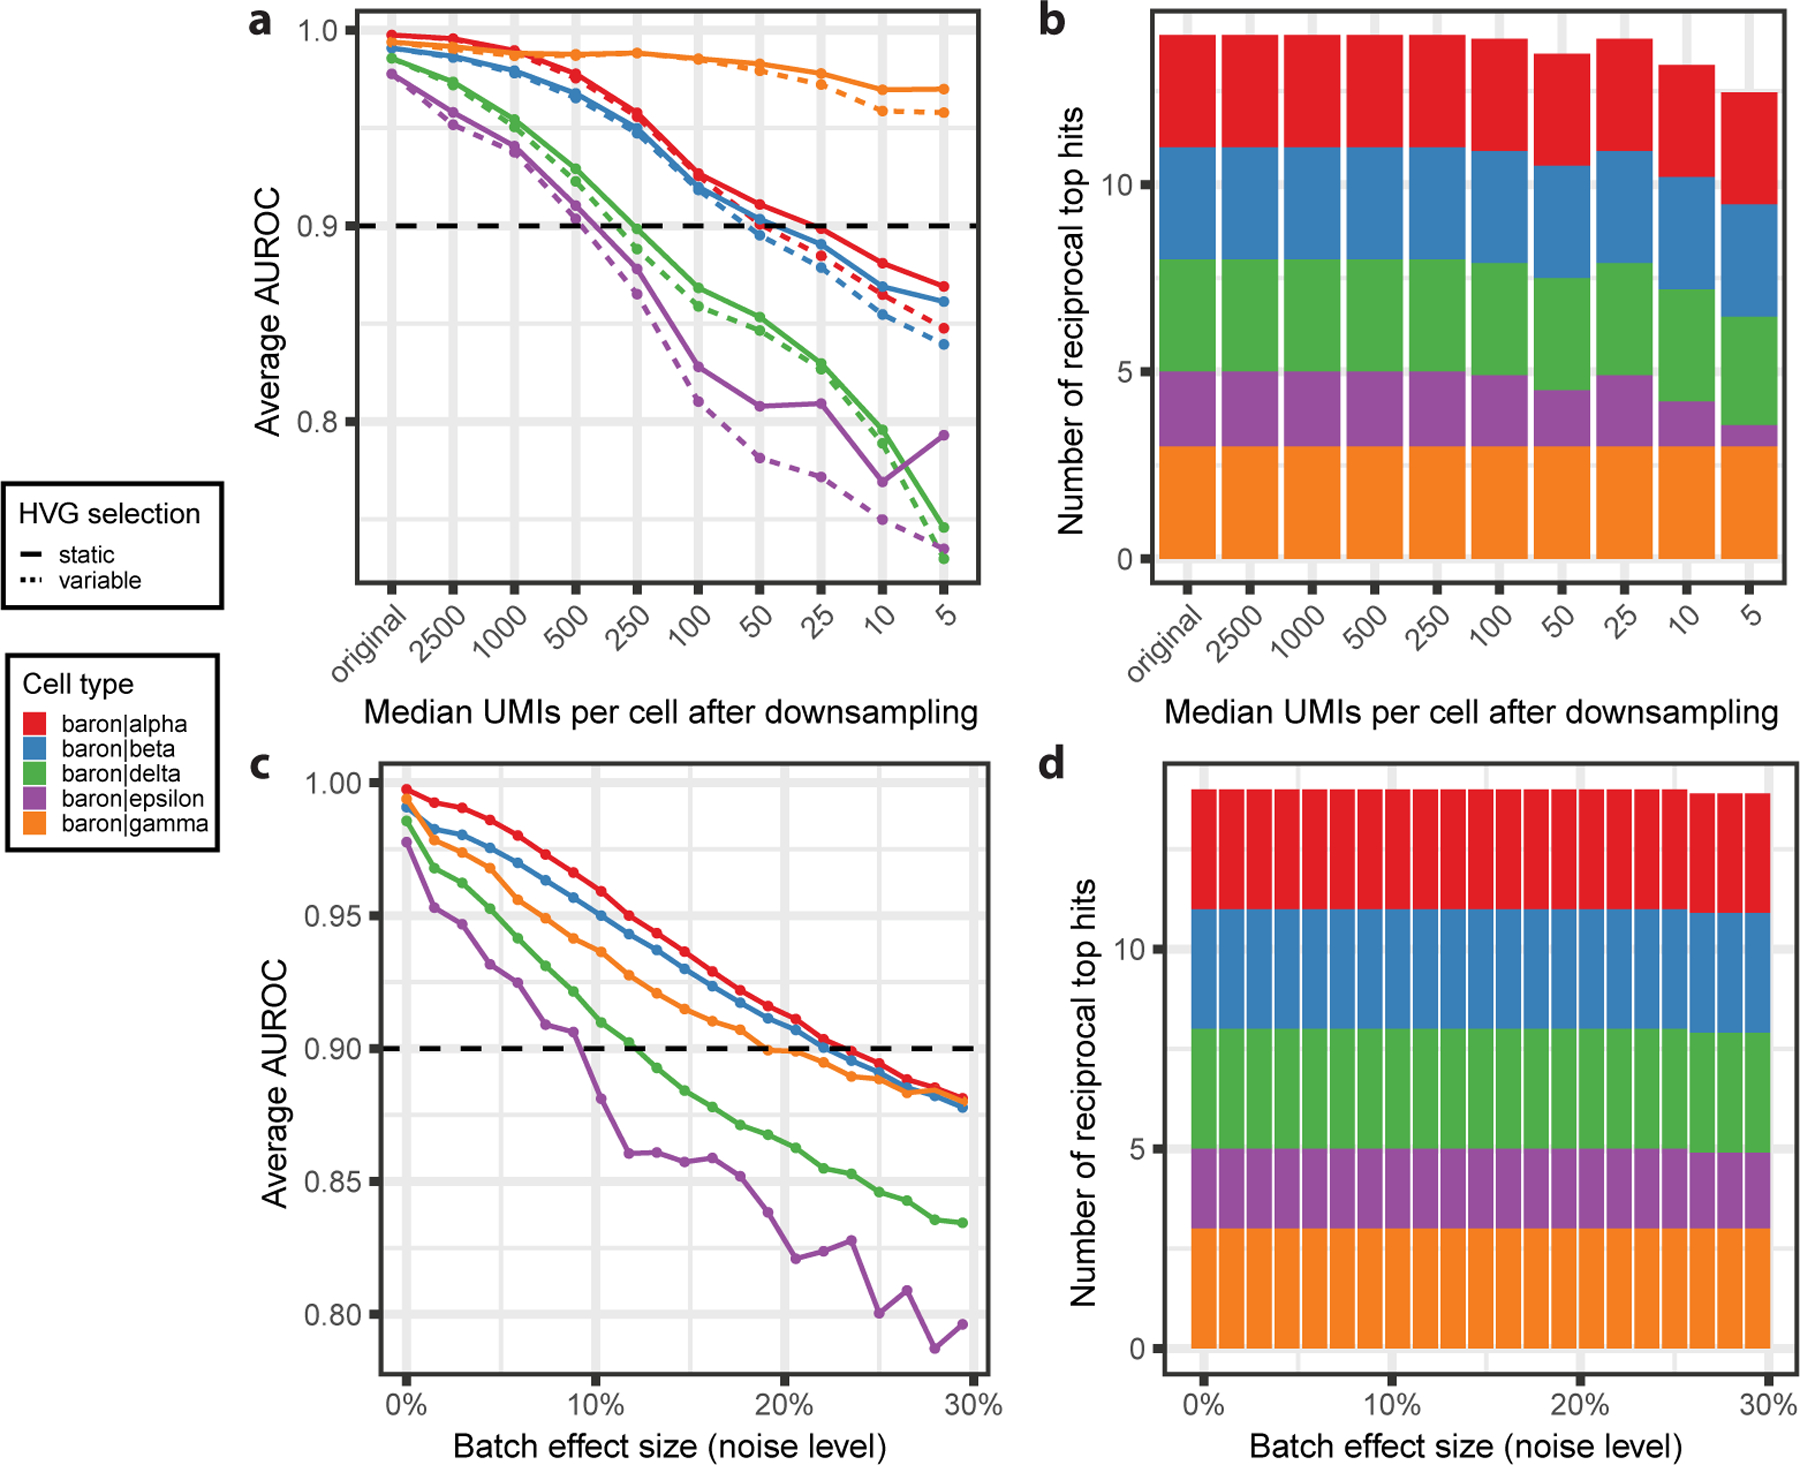
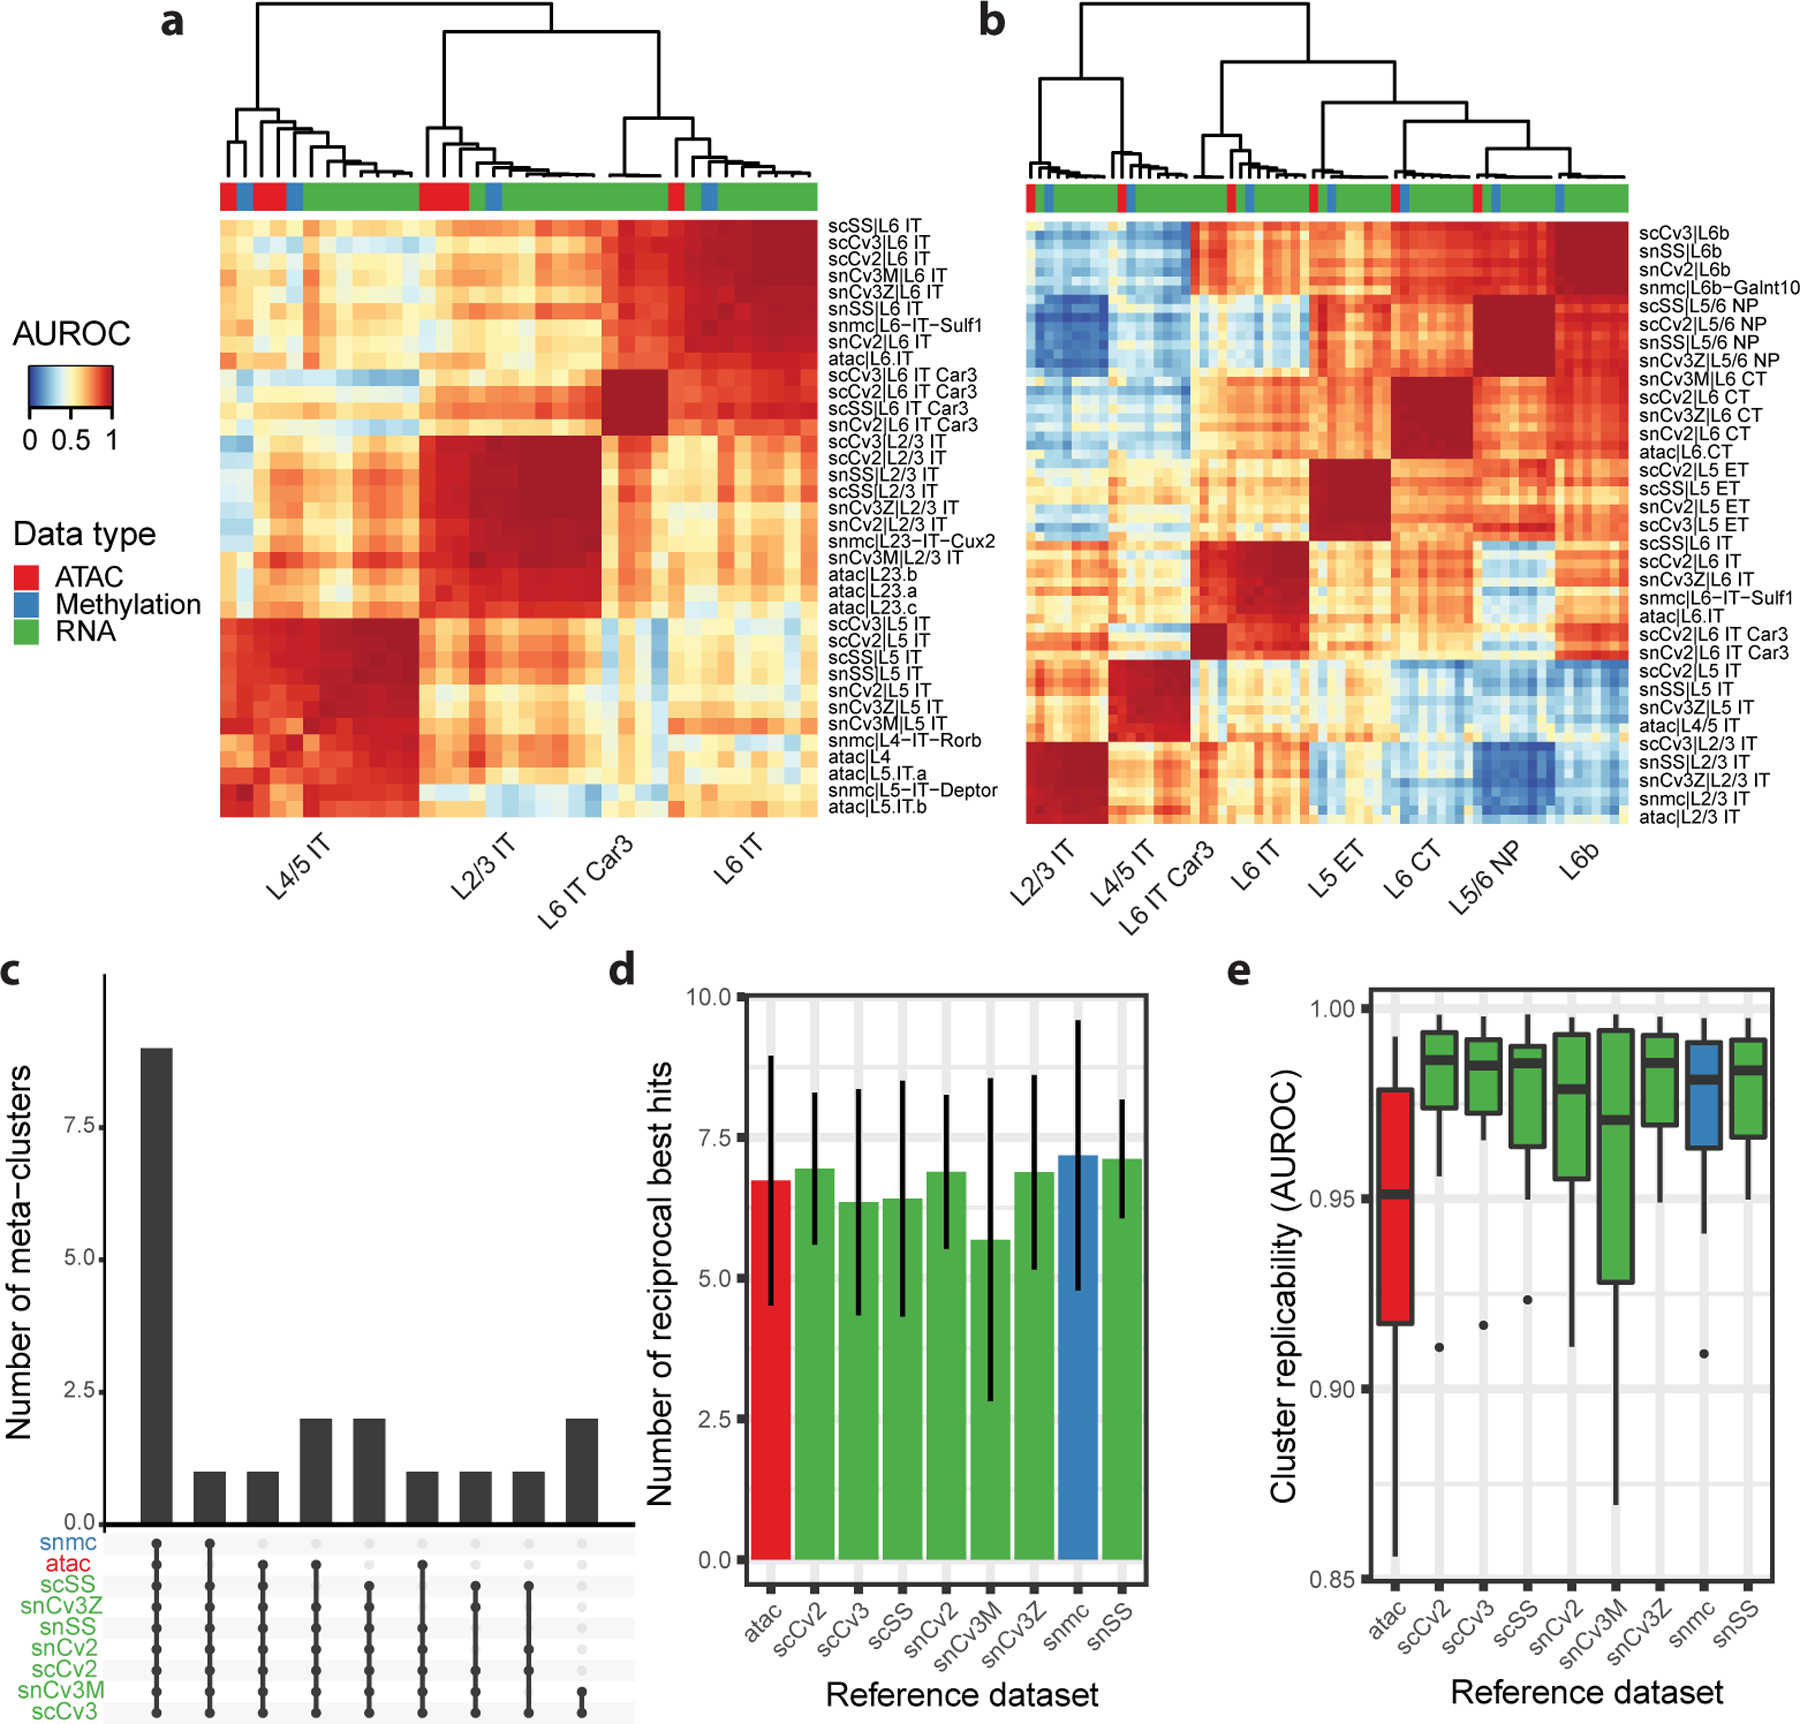
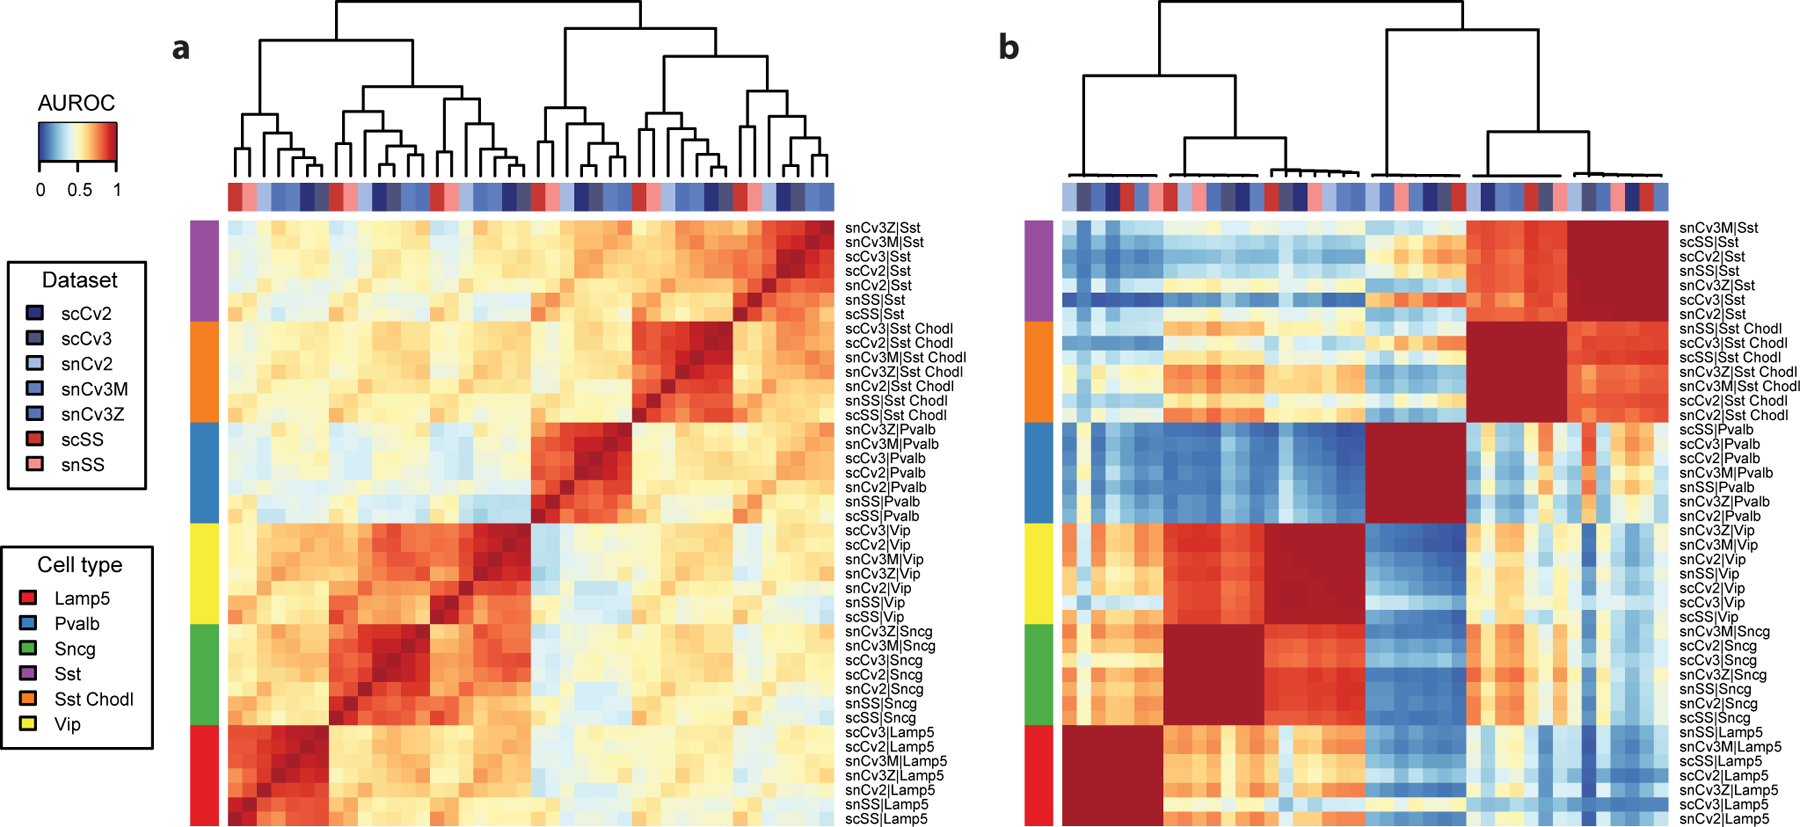
Single-cell RNA-sequencing data have significantly advanced the characterization of cell-type diversity and composition. However, cell-type definitions vary across data and analysis pipelines, raising concerns about cell-type validity and generalizability. With MetaNeighbor, we proposed an efficient and robust quantification of cell-type replicability that preserves dataset independence and is highly scalable compared to dataset integration. In this protocol, we show how MetaNeighbor can be used to characterize cell-type replicability by following a simple three-step procedure: gene filtering, neighbor voting and visualization. We show how these steps can be tailored to quantify cell-type replicability, determine gene sets that contribute to cell-type identity and pretrain a model on a reference taxonomy to rapidly assess newly generated data. The protocol is based on an open-source R package available from Bioconductor and GitHub, requires basic familiarity with Rstudio or the R command line and can typically be run in <5 min for millions of cells.


Conflict of interest statement

Competing financial interests

The authors declare that they have no competing financial interests.

Figures

Figure 1.
Figure 1.. MetaNeighbor quantifies and characterizes cell type replicability.
a Schematic of MetaNeighbor. MetaNeighbor uses a cross-dataset neighbor voting framework to compute cell type similarities. Cells from a reference cell type (A1) vote for cells in a target dataset according to their similarity (Spearman correlation). Votes can be summarized at the cell type level as an Area Under the Receiver Operating Characteristic curve (AUROC), reflecting the similarity of the reference and target cell types. Formally, the AUROC is computed for each pair of cluster by setting up the following classification problem: “can cells from the reference cluster (A1) predict which cells belong to the target cluster (e.g., D2)?”, where target cells are ranked according to their average similarity to A1 cells, cells from D2 are treated as positives, and all other cells from the target dataset are treated as negatives. An AUROC of 1 indicates perfect performance (all D2 cells ranked at the top). This procedure is repeated for all possible reference and target combinations: replicating cell types are identified as reciprocal top hits with high average AUROC. For example, D2 was A1’s top hit, reciprocally A1 was D2’s top hit, and the average AUROC of these hits exceeded 0.9. In AUROC graphs, TPR=True Positive Rate, FPR=False Positive Rate. b-d Schematic of the 3 MetaNeighbor procedures. Procedure 1 shows how to assess cell type replicability by considering all possible pairs of reference and target datasets: highly replicating cell types are identified as recurrent reciprocal top hits across datasets. Procedure 2 shows how to pre-train MetaNeighbor on large reference compendia, enabling rapid identification of reference cell types that are present in a given target dataset. Procedure 3 shows how to functionally characterize replicating cell types by identifying functional gene sets (such as Gene Ontology gene sets) that contribute most to replicability.
Figure 2.
Figure 2.. Cell types from 4 pancreas datasets cluster according to their biological similarity.
Heatmap based on MetaNeighbor AUROCs. Red indicates high similarity, blue indicates low similarity. By applying hierarchical clustering, replicating cell types group together (dark red squares), biologically related cell types (e.g. endocrine cell types, such as alpha, beta, gamma cells) form secondary groups (large light red squares).
Figure 3.
Figure 3.. Restricting the 4 pancreas datasets to endocrine subtypes allows for a more stringent replicability assessment.
a Heatmap based on MetaNeighbor AUROCs applied to endocrine cell types, where cell types are grouped by applying hierarchical clustering. Red squares represent replicating cell types (alpha, beta, gamma, delta and epsilon cells). b AUROCs can be refined as long as there are two cell types per dataset. Heatmap based on MetaNeighbor AUROCs applied to gamma, delta and epsilon cells, where cell types are grouped by applying hierarchical clustering. Red squares represent replicating cell types (gamma, delta and epsilon cells).
Figure 4.
Figure 4.. 1-vs-best AUROCs automatically identify each cell type’s closest outgroup.
Heatmap based on MetaNeighbor 1-vs-best AUROCs, where cell types are grouped by applying hierarchical clustering. Reference cell types are shown as columns, target cell types are shown as rows. Red values indicate each reference cell type’s best hit, blue values the closest outgroup (one value per target dataset). All other cell type combinations are shown in gray.
Figure 5.
Figure 5.. Replicating cell types can be extracted as meta-clusters.
a The Upset plot breaks down cell-type replicability by dataset. Meta-clusters (groups of replicating cell types) are organized according to the datasets in which they replicate. For example, there are two cell types that replicate in the Baron, Muraro and Seger datasets, but are missing in the Lawlor dataset. b “Cell type badges” help identify datasets where cell type replicability is weaker. 1-vs-best AUROC heatmap for meta-cluster corresponding to ductal cells. The cell type is detected across all 4 datasets, but AUROCs are systematically weaker when testing in the Muraro dataset, indicating that the cell type is not as clearly defined in that dataset. c The cluster graph enables the rapid visualization of replicating cell types. Each node of the graph represents a cell type, colored by dataset of origin. Best hits (strong 1-vs-best AUROC) are shown by gray directed edges (oriented from reference cell type toward target cell type). Outgroups are shown by orange directed edges (reference toward target) for 1-vs-best AUROC > 0.3. Ideally replicating cell types form cliques (every pair of a cell type is connected, e.g., alpha cells). d Subsetting the cluster graph enables the investigation of close calls. Same representation as c, centered on the “epsilon” cell type from the Baron dataset, which had two close matches in the Lawlor dataset (“Alpha” and “Gamma/PP”), as the epsilon cell type is missing in the Lawlor dataset.
Figure 6.
Figure 6.. Assessment of cell type annotations from the mouse primary visual cortex against reference neuron taxonomy from the primary motor cortex (medium resolution).
a Heatmap based on MetaNeighbor AUROCs. Reference cell types are shown as columns, query cell types as rows. Reference cell types are grouped by hierarchical clustering, query cell types according to the strongest matching reference cell type. b Assessment of inhibitory cell types from the mouse primary visual cortex against reference inhibitory cell types (medium resolution). Same representation as a. Red rectangles indicate groups of related cell types: Sncg, Vip, Lamp5, Sst and Pvalb inhibitory neurons.
Figure 7.
Figure 7.. Assessment of inhibitory cell types from the mouse primary visual cortex against reference inhibitory cell types (high resolution).
a Heatmap based on MetaNeighbor AUROCs. Reference cell types are shown as columns, query cell types as rows. Global red rectangles indicate good replicability structure, suggesting replicability for Sncg, Vip, Lamp5, Sst and Pvalb inhibitory subtypes. b Distribution of AUROC scores for the “Pvalb Cpne5” cell type from the primary visual cortex (query cell type) against all reference cell types. Best hits (against the “Pvalb Vipr2_2) are shown by red lines, all other hits are shown as a gray background distribution. Replicating cell types have substantially higher AUROC scores than background cell types.
Figure 8.
Figure 8.. 1-vs-best AUROCs enable rapid identification of 1:1 hits and 1:n hits.
Heatmap is based on MetaNeighbor 1-vs-best AUROCs. Reference cell types are shown as columns, query cell types as rows. In this representation, the best hits are shown in red, the outgroup hit is shown in blue, all other values are gray.
Figure 9.
Figure 9.. A small fraction of functional gene sets contributes highly to cell type replicability.
For each cell type, large ticks represent the average AUROC across gene sets. Each smaller tick represents an individual gene set, the envelope is a violin-plot style approximation of the distribution of performance across gene sets.
Figure 10.
Figure 10.. Top scoring gene sets can be broken down into characteristic genes for each cell type.
a Dot plot of genes from the “Glutamate receptor signalling pathway” Gene Ontology term, where cell types are shown on the x-axis and genes are shown on the y-axis. For each cell type, the dot size corresponds to the fraction of cells expressing a given gene, the color corresponds to the z-scored average expression level, averaged across datasets. b Same as a, for the “GABA-A receptor complex” Gene Ontology term.
Figure 11.
Figure 11.. Selection of a bad highly variable gene set leads to suboptimal performance and obscures biological signal.
a Anticipated result: AUROC heatmap based on a set of highly variable genes selected by MetaNeighbor. The heatmap has clear replicating clusters (dark red squares) and known secondary biological relationships (e.g., similarity of CGE-derived interneurons Vip, Sncg and Lamp5). b Possible issue: AUROC heatmap based on a set of random genes (same number of genes as the correctly selected highly variable gene set in a). Replicability patterns become weaker: lower performance, gradients within replicating cell types, weaker secondary relationships.
Figure 12.
Figure 12.. Absence of biological overlap between datasets leads to almost random performance and lack of hierarchical cell type structure.
a Anticipated result: AUROC heatmap with inhibitory neuron cell types as query (rows) and inhibitory neuron cell types as reference (columns). b Possible issue: same as a, but with non-neuronal cell types as reference (columns). The heatmap lacks clear replicating clusters (dark red rectangles) and known secondary biological relationships (e.g., similarity of CGE-derived interneurons Vip, Sncg on the query side).
Figure 13.
Figure 13.. Disrupting formatting of cell type names in pre-trained models leads to random performance.
a Anticipated result: AUROC heatmap with cell types from primary visual cortex as query (rows) and cell types from primary motor cortex as reference (columns). The heatmap shows evidence of replicating cell types (dark red rectangles) and global structure (larger rectangles corresponding to non-neurons, excitatory neurons and inhibitory neurons). b Possible issue: same as a, but with incorrect formatting of reference cell types (due to an error while reading the pre-trained model), leading to completely random performance.
Figure 14.
Figure 14.. MetaNeighbor results are robust to batch effects.
a Replicability (MetaNeighbor AUROC) of endocrine cell types in the Baron pancreas dataset after downsampling the number of Unique Molecular Identifiers (UMIs) per cell. “original” corresponds to the replicability in the original dataset, without downsampling (~ 5000 UMIs per cell). Line types represent the Highly Variable Gene (HVG) selection strategy: full lines indicate that the initial set of HVG (based on the full dataset) is conserved (“static”), dashed lines indicate that HVG are re-picked after downsampling (“variable”). b Stacked barplot showing the number of reciprocal top hits for each endocrine cell type after downsampling. The height of the bars indicates the number of datasets in which the cell type was found to replicate. c Replicability (MetaNeighbor AUROC) of endocrine cell types in the Baron pancreas dataset after the addition of noise to original counts. d Stacked barplot showing the number of reciprocal top hits for each endocrine cell type after the addition of noise. In all panels, statistics are averaged over 10 independent experiments and colors represent cell types.
Figure 15.
Figure 15.. MetaNeighbor finds replicable cell types in a multi-modal dataset of the mouse primary motor cortex.
a Heatmap based on MetaNeighbor AUROCs for Intra-Telencephalic (IT) projecting cell types, where cell types are grouped by applying hierarchical clustering. Column annotation colors indicate the sequencing modality (expression, chromatin accessibility or methylation). b Heatmap based on MetaNeighbor AUROCs for excitatory cell types, where cell types are grouped by applying hierarchical clustering. Column annotation colors as in a. c Upset plot showing the number of cell types that replicate across given combinations of datasets (meta-clusters). For example, 9 cell types were found to replicate across all datasets. d Number of reciprocal best hits for each dataset in the primary motor cortex compendium. The height of each bar indicates the average number of hits across cell types, the line indicates the standard deviation. e Boxplot showing the strength of cluster replicability (MetaNeighbor AUROC) across cell types for each dataset in the primary motor cortex compendium. The lower and upper hinges of the boxplots represent the first and third quartile, the central line represents the median, the upper (resp. lower) whisker extends to the largest (resp. smallest) value within 1.5 IQR (Inter-Quartile Range) of the hinge. All points beyond 1.5 IQR are drawn individually.
Figure 16.
Figure 16.. MetaNeighbor AUROCs offer a generalizable and batch-effect-free quantification of cell type similarity
a Possible issue: Spearman correlation of cell type centroids is affected by technical variability. The heatmap shows some evidence of replicating cell types (light red rectangles), but is dominated by batch effects, largely obscuring secondary relationships between cell types. Red colors correspond to datasets using the Smart-Seq technology, blue colors to datasets using the 10x technology, light colors to single nuclei datasets, dark colors to single cell datasets. b Anticipated result: MetaNeighbor AUROCs alleviate most of the concerns seen in a, with clear groups of replicating cell types (dark red squares, AUROC ~ 1) and clear secondary relationships (e.g., similarity of CGE-derived interneurons Vip, Sncg and Lamp5).

References

    1. Hay SB, Ferchen K, Chetal K, Grimes HL & Salomonis N The Human Cell Atlas bone marrow single-cell interactive web portal. Exp. Hematol 68, 51–61 (2018). - PMC - PubMed
    1. Schaum N et al. Single-cell transcriptomics of 20 mouse organs creates a Tabula Muris. Nature 562, 367–372 (2018). - PMC - PubMed
    1. Almanzar N et al. A single-cell transcriptomic atlas characterizes ageing tissues in the mouse. Nature 583, 590–595 (2020). - PMC - PubMed
    1. Yao Z et al. An integrated transcriptomic and epigenomic atlas of mouse primary motor cortex cell types. bioRxiv 2020.02.29.970558 (2020) doi: 10.1101/2020.02.29.970558. - DOI
    1. Yao Z et al. A taxonomy of transcriptomic cell types across the isocortex and hippocampal formation. bioRxiv 2020.03.30.015214 (2020) doi: 10.1101/2020.03.30.015214. - DOI - PMC - PubMed

Related links

Key references using this protocol
    1. Crow M et al. Nat Commun 9, 884 (2018): 10.1038/s41467-018-03282-0 - DOI - PMC - PubMed
    1. Paul A et al. Cell 171, 522–539.e20 (2017): 10.1016/j.cell.2017.08.032 - DOI - PMC - PubMed
    1. Yao Z et al. bioRxiv 2020.02.29.970558 (2020): 10.1101/2020.02.29.970558 - DOI
    1. Bakken TE et al. bioRxiv 2020.03.31.016972 (2020): 10.1101/2020.03.31.016972 - DOI
Key data used in this protocol
    1. Yao Z et al. bioRxiv 2020.02.29.970558 (2020): 10.1101/2020.02.29.970558 - DOI
    1. Baron M et al. Cell Syst. 3, 346–360.e4 (2016): 10.1016/j.cels.2016.08.011 - DOI - PMC - PubMed
    1. Lawlor N et al. Genome Res. 27, 208–222 (2017): 10.1101/gr.212720.116 - DOI - PMC - PubMed
    1. Muraro MJ et al. Cell Syst. 3, 385–394.e3 (2016): 10.1016/j.cels.2016.09.002 - DOI - PMC - PubMed
    1. Segerstolpe Å et al. Cell Metab. 24, 593–607 (2016): 10.1016/j.cmet.2016.08.020 - DOI - PMC - PubMed

Publication types