. 2021 Jul;595(7869):724-729.
doi: 10.1038/s41586-021-03692-z. Epub 2021 Jul 7.

Metabolic control of TFH cells and humoral immunity by phosphatidylethanolamine

Affiliations

Metabolic control of TFH cells and humoral immunity by phosphatidylethanolamine

Guotong Fu et al. Nature. 2021 Jul.

Abstract

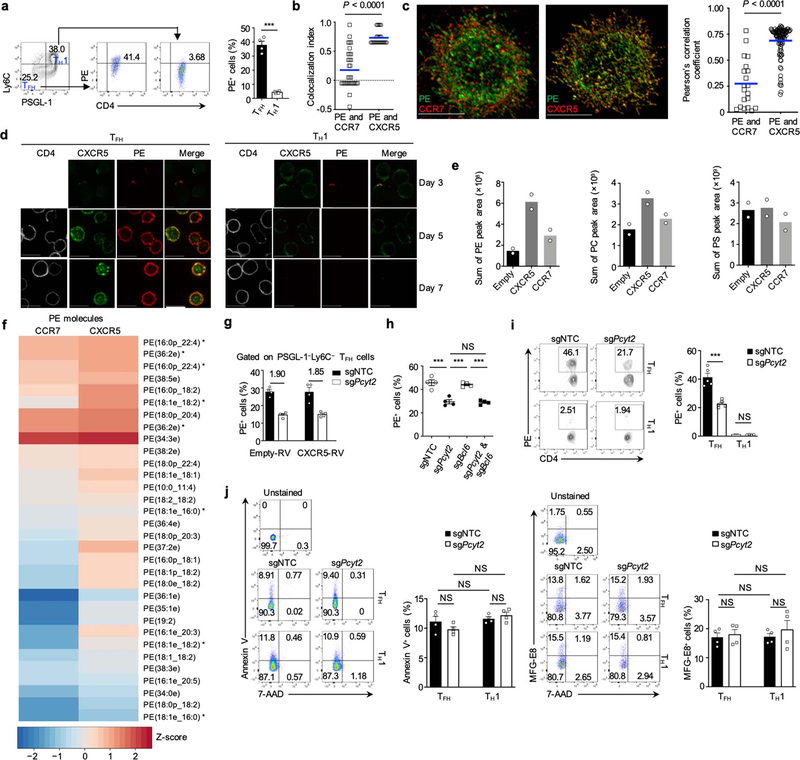
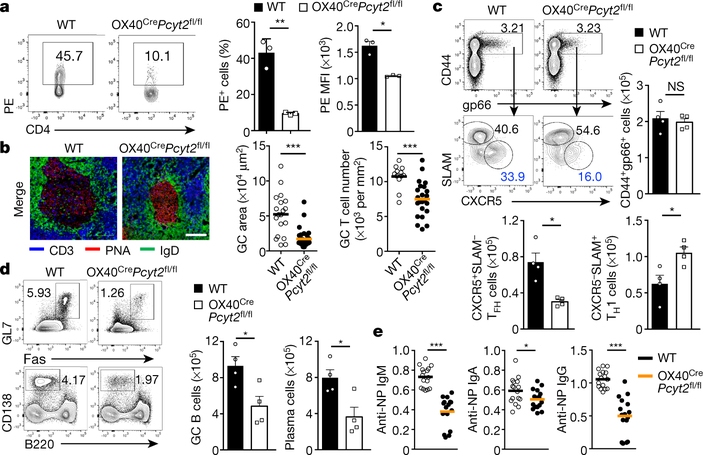
T follicular helper (TFH) cells are crucial for B cell-mediated humoral immunity1. Although transcription factors such as BCL6 drive the differentiation of TFH cells2,3, it is unclear whether and how post-transcriptional and metabolic programs enforce TFH cell programming. Here we show that the cytidine diphosphate (CDP)-ethanolamine pathway co-ordinates the expression and localization of CXCR5 with the responses of TFH cells and humoral immunity. Using in vivo CRISPR-Cas9 screening and functional validation in mice, we identify ETNK1, PCYT2, and SELENOI-enzymes in the CDP-ethanolamine pathway for de novo synthesis of phosphatidylethanolamine (PE)-as selective post-transcriptional regulators of TFH cell differentiation that act by promoting the surface expression and functional effects of CXCR5. TFH cells exhibit unique lipid metabolic programs and PE is distributed to the outer layer of the plasma membrane, where it colocalizes with CXCR5. De novo synthesis of PE through the CDP-ethanolamine pathway co-ordinates these events to prevent the internalization and degradation of CXCR5. Genetic deletion of Pcyt2, but not of Pcyt1a (which mediates the CDP-choline pathway), in activated T cells impairs the differentiation of TFH cells, and this is associated with reduced humoral immune responses. Surface levels of PE and CXCR5 expression on B cells also depend on Pcyt2. Our results reveal that phospholipid metabolism orchestrates post-transcriptional mechanisms for TFH cell differentiation and humoral immunity, highlighting the metabolic control of context-dependent immune signalling and effector programs.


Conflict of interest statement

Competing interests

H. Chi is a consultant for Kumquat Biosciences, Inc.

Figures

Extended Data Figure 1.
Extended Data Figure 1.. Pooled in vivo CRISPR-Cas9 screening and an in vivo dual transfer system to identify and validate potential regulators of Tfh cells.
a, Diagram of the screening system. Naïve Cas9-expressing SMARTA cells were transduced with lentiviral-derived sgRNA metabolic library, expanded in vitro, and transferred into C57BL/6 hosts, which were then infected with LCMV 24 h later. At day 7 post-infection, splenic Tfh (CXCR5+SLAM) and Th1 (CXCR5SLAM+) cells were purified and those gRNAs that were upregulated (corresponding to negative regulators of Tfh responses) or downregulated (corresponding to positive regulators of Tfh responses) in Tfh versus Th1 cells [|log2 ratio (Tfh/Th1)| > 0.5; adjusted P < 0.05] were determined for metabolism-related genes that establish Tfh over Th1 cell differentiation. b, Diagram of in vivo dual transfer system. SMARTA cells transduced with sgRNA viral vectors expressing distinct fluorescent proteins were mixed and transferred into the same C57BL/6 hosts, followed by LCMV infection and experimental analyses. c, SMARTA cells transduced with the indicated sgRNA viral vectors (Ametrine+) were mixed at a 2:1 ratio with sgNTC (mCherry+)-transduced SMARTA cells and transferred into C57BL/6 hosts, followed by LCMV infection. Analyses of the proportion of donor-derived Tfh (CXCR5+SLAM or PSGL-1Ly6C) and Th1 (CXCR5SLAM+ or PSGL-1+Ly6C+) cells and quantification of relative Tfh cell percentage and number (right lower) in the spleen at day 7 (n = 4 mice). d, Insertion and deletion (indel) mutations after CRISPR-Cas9 targeted disruption in SMARTA cells transduced with sgNTC or sgPcyt2, via deep sequencing analysis of indels generated at the exonic target site of the Pcyt2 gene, including 74% of indel events in sgPcyt2-transduced cells compared to 0.6% in sgNTC-transduced cells. e, Immunoblot analyses of Etnk1 and Pcyt2 in splenic SMARTA cells at day 3 post-infection. Asterisk (*), non-specific band; arrow, the target band. Data are representative of two (d, e), or at least three (c) independent experiments. Data are mean ± s.e.m. P values are determined by one-way ANOVA (c). ***P < 0.001. Numbers in quadrants or gates indicate percentage of cells.
Extended Data Figure 2.
Extended Data Figure 2.. Validation of the effects of CDP-ethanolamine pathway genes on Tfh generation during both virus infection and protein immunization.
a, b, Quantification of relative proportions and numbers of CXCR5+PD-1+ Tfh cells (a) and CXCR5SLAM+ Th1 cells (b) in donor-derived cells from spleen of mice receiving the indicated sgRNA-transduced SMARTA cells at day 7 after LCMV infection (n = 4 mice). c, Insertion and deletion (indel) mutations after CRISPR-Cas9 targeted disruption in SMARTA cells transduced with the indicated sgRNAs via deep sequencing analysis of indels generated at the exonic target sites of the indicated genes. d, Immunoblot analyses of indicated proteins in the indicated sgRNA-transduced SMARTA cells isolated from the spleen at 3–5 days after adoptive transfer and LCMV infection. Non-specific bands are indicated by an asterisk (*); target bands are indicated by an arrow. e, SMARTA cells transduced with the indicated sgRNA-expressing vectors (Ametrine+) were mixed at a 2:1 ratio with sgNTC (mCherry+)-transduced SMARTA cells and transferred into C57BL/6 hosts, followed by LCMV infection. Quantification of donor-derived Tfh and Th1 cells from the host spleen at day 7 post-infection (n = 4 mice). f, OT-II cells transduced with the indicated sgRNAs were transferred into C57BL/6 hosts, followed by NP-OVA + LPS in alum immunization. Quantification of Tfh cell percentage and number in the spleen at day 7 (n = 4 mice). Data are representative of two (ce), or at least three (a, b, f) independent experiments. Data are mean ± s.e.m. P values are determined by one-way ANOVA (a, b, e, f). NS, not significant; *P < 0.05, **P < 0.01, and ***P < 0.001.
Extended Data Figure 3.
Extended Data Figure 3.. Dynamic regulation of PE metabolic programs in Tfh cells.
a, Lipidomic analysis of the lipid content (phosphatidylcholine, PC; phosphatidylserine, PS) in naïve (CD4+) T cells, wild-type Tfh (transduced with sgNTC), and Pcyt2-deficient Tfh cells (n = 3 samples, each pooled from multiple mice). b, c The dependence of Pcyt2 for PE alterations during Tfh cell differentiation from naïve CD4+ T cells. Heatmap showing the 39 significantly downregulated PE molecules in Pcyt2-deficient Tfh cells as compared with wild-type Tfh cells (log2 ratio ≥ 0.5, P < 0.05) (b). Venn diagram showing the overlap of upregulated (left) or downregulated (right) PE molecules in wild-type Tfh versus naïve CD4+ T cells compared to wild-type versus Pcyt2-deficient Tfh cells (c) (n = 3 samples, each pooled from multiple mice). d, Lipidomic analysis of the lipid content (PE and PC) in wild-type and Selenoi-deficient Tfh cells (n = 3 samples, each pooled from multiple mice). e, Primary Tfh and Th1 cells were sorted from LCMV-infected mice and incubated with [3H]-Etn (2 μCi/ml) for 3 h. To assess PE synthesis, lipids were extracted and [3H]-Etn incorporation into Tfh cells was assessed with a scintillation counter (see synthesis column, left graph). To assess PE turnover, after 3 h of [3H]-Etn incubation, cells were washed and chased with unlabeled ethanolamine for another 3 h (see turnover column, left graph). The presence of [3H] radioactivity in cells and culture medium (right graph) was measured with a scintillation counter (n = 4 samples, each pooled from multiple mice). CPM, counts per million. Data are representative of at least two independent experiments (ae). Data are mean ± s.e.m. P values are determined one-way ANOVA (a) or by two-tailed unpaired Student’s t-test (d, e). NS, not significant; *P < 0.05, **P < 0.01, and ***P < 0.001.
Extended Data Figure 4.
Extended Data Figure 4.. CDP-ethanolamine pathway but not CDP-choline pathway is required for Tfh cell differentiation.
a, Diagram summary of the effects of single or combined deficiency of genes in the CDP-ethanolamine and CDP-choline pathways on Tfh cell differentiation after LCMV infection. b, Immunoblot analyses of indicated proteins in the indicated sgRNA-transduced SMARTA cells isolated from the spleen at 3–5 days after adoptive transfer and LCMV infection. The non-specific band is indicated by an asterisk (*); the target band is indicated by an arrow. c, Summary of the relative proportions of Tfh (CXCR5+SLAM) and Th1 (CXCR5SLAM+) cells in donor-derived cells in spleen of mice receiving the indicated sgRNA-transduced SMARTA cells at day 7 after LCMV infection (n = 4 mice). d, Lipidomic analysis of the lipid content (PC and PE) in wild-type Tfh (transduced with sgNTC), Pcyt1a-deficient Tfh and Pcyt1a and Pcyt1b-doubly deficient Tfh cells (n = 3 samples, each pooled from multiple mice). e, Flow cytometry analysis (left) and summary of the proportion of wild-type and Pcyt2-deficient CXCR5+ SMARTA cells (middle) and their dilution of CellTrace Violet (CTV; right) at day 2 after LCMV infection (n = 3 mice). f, Summary of apoptotic wild-type and Pcyt2-deficient SMARTA cells as analyzed by Annexin V and 7AAD staining (or unstained) in freshly-isolated splenocytes at day 2 after LCMV infection (n = 3 mice). g, Distribution of SMARTA cells in the follicle in the spleen at day 3 post-infection. Scale bar, 50 μm (n = 50 sections). h, Diagram of Tfh cell effector functional assay. sgNTC (mCherry+) and sgPcyt2 (Ametrine+)-transduced SMARTA cells (CD45.1+) were transferred (1st transfer) into C57BL/6 hosts (CD45.2+), followed by LCMV infection. Seven days later, the fully differentiated wild-type or Pcyt2-deficient CXCR5+SLAM Tfh cells (CD45.1+) were sorted and equal numbers of these cells were transferred (2nd transfer) into LCMV-infected mice (CD45.2+; this transfer occurred at day 1 after LCMV infection). GC B cell and plasma cell formation was analyzed at day 5 after the 2nd adoptive transfer. Data are representative of one (d) or at least two (b, c, e–g) independent experiments. Data are mean ± s.e.m. P values are determined by one-way ANOVA (c, d) or by two-tailed unpaired Student’s t-test (e, f). NS, not significant; **P < 0.01 and ***P < 0.001. Numbers in gates indicate percentage of cells.
Extended Data Figure 5.
Extended Data Figure 5.. CDP-ethanolamine pathway regulates Tfh cell differentiation independently of Bcl6–T-bet axis.
a, sgNTC or sgPcyt2-transduced SMARTA cells (CD45.1+) were transferred into C57BL/6 recipients (CD45.2+) that were subsequently infected with LCMV. CD45.1+ cells were isolated at day 3 for transcriptional profiling by microarray. Gene set enrichment analysis (GSEA) of the Tfh signature in Pcyt2-deficient compared to wild-type T cells (n = 3 samples, each pooled from multiple mice). b, c, sgNTC, sgEtnk1, sgPcyt2, or sgSelenoi-transduced SMARTA cells were transferred into C57BL/6 recipients, followed by infection with LCMV. Quantification of the percentages of Bcl6+T-bet and Bcl6T-bet+ cells among donor-derived T cells in the spleen at day 3 (b) and day 7 (c) post-infection (n = 4 mice). d, GSEA of Bcl6 target genes (identified by ChIP-Seq) in Pcyt2-deficient compared to wild-type T cells (samples are the same as Extended Data Fig. 5a; n = 3 samples, each pooled from multiple mice). e, GSEA of the Tfh-specific genes that are directly downregulated by Bcl6 (in total 48 genes, identified by combining ChIP-Seq, RNA-Seq and microarray datasets) in Pcyt2-deficient compared to wild-type T cells (samples are the same as Extended Data Fig. 5a; n = 3 samples, each pooled from multiple mice). f, Analysis and quantification of PSGL-1Ly6C cells, CXCR5+ cells and CXCR5 MFI among PSGL-1Ly6C Tfh cells at day 3 post-infection (n = 4 mice). g, sgNTC, sgPcyt2, sgBcl6, or sgPcyt2 and sgBcl6-transduced SMARTA cells were transferred into C57BL/6 recipients that were subsequently infected with LCMV. Quantification of the proportion of Tfh cells (CXCR5+PD-1+ and CXCR5+SLAM) in donor-derived cells from the spleen at day 7 post-infection (n = 4 mice). h, sgNTC, sgEtnk1, sgPcyt2, or sgSelenoi-transduced SMARTA cells (CD45.1+) were transferred into C57BL/6 recipients (CD45.2+) that were subsequently infected with LCMV. Quantification of the proportion of Tfh cells (CXCR5+PD-1+) in donor-derived T cells from the spleen at day 3 post-infection (n = 4 mice). io, SMARTA cells transduced with the indicated sgRNAs were transferred into C57BL/6 recipients, followed by infection with LCMV. i, Quantification of the frequency and mean fluorescence intensity (MFI) of CXCR5 on Tfh cells (PSGL-1Ly6C) in the spleen at day 2 post-infection (n = 3 mice). j, Quantification of the frequency and MFI of PD-1 on Tfh cells (PSGL-1Ly6C) in the spleen at day 2 post-infection (n = 3 mice). k, SMARTA cells were transduced with sgNTC or sgPcyt2 alone or in combination with a retrovirus overexpressing empty vector (Empty-RV) or CXCR5 (CXCR5-RV), followed by adoptive transfer into C57BL/6 mice that were then infected with LCMV. Analysis (upper) and quantification (lower) of the proportion of Tfh cells (CXCR5+PD-1+ and PSGL-1Ly6C) in donor-derived cells from the spleen at day 7 post-infection (n = 4 mice in CXCR5-RV group of CXCR5+PD-1+ Tfh data, n = 3 mice in other groups). l, MFI of PD-1, ICOS, Ly6C, PSGL-1, CD44, and CD62L on CD45.1+ SMARTA cells at day 3 post-infection (n = 4 mice). m, Quantification of the frequency and MFI of CXCR3 on CD45.1+ SMARTA cells at day 3 post-infection (n = 3 mice). n, MFI of CCR7 expression on donor-derived T cells from the host spleen at day 3 post-infection (n = 3 mice). o, Quantification of phosphorylated AKT (pAKT-S473) levels in purified wild-type or Pcyt2-deficient Tfh cells (CXCR5+SLAM) that were stimulated with CXCL13 for 3 h (n = 4 mice). Data are representative of one (a, d, e), at least two (b, c, g, h), or at least three (f, io) independent experiments. Data are mean ± s.e.m. P values are determined by one-way ANOVA (b, c, fh, k, l), or by two-tailed unpaired Student’s t-test (i, j, mo). NS, not significant; *P < 0.05, **P < 0.01, and ***P < 0.001. Numbers in gates indicate percentage of cells.
Extended Data Figure 6.
Extended Data Figure 6.. PE is selectively distributed on the outer layer of the Tfh but not Th1 cell plasma membrane.
a, Analysis and quantification of surface level of PE on Tfh (PSGL-1Ly6C) and Th1 (PSGL-1+Ly6C+) cell membrane at day 5 post-infection (n = 4 mice). b, Quantification of co-localization index of PE and CCR7 or CXCR5 on PSGL-1Ly6C Tfh cells in Fig. 3b using the Coordinate-Based Colocalization (CBC) algorithm (PE : CCR7, n = 33 cells; PE : CXCR5, n = 25 cells). A co-localization index value of 1 indicates complete co-localization, a value of 0 represents spatial randomness, and value of −1 indicates inter-molecular exclusion. c, 3D super resolution confocal image of the entire Tfh cell on poly-L-lysine-coated coverslips. Surface staining was reconstructed using Imaris software. Scale bar, 2 μm. Layers are translucent to readily visualize both colors. Right, quantification of co-localization index of PE and CCR7 or PE and CXCR5 on PSGL-1Ly6C Tfh cells (n = 4 mice and 20 cells were quantified). d, Confocal microscopy imaging of PE distribution on Tfh (PSGL-1Ly6C) and Th1 (PSGL-1+Ly6C+) cells at the indicated time points after LCMV infection. Scale bar, 10 μm (n = 3 mice). e, f, Lipids associated with FLAG-CXCR5 or FLAG-CCR7 expressed in SMARTA cells isolated from LCMV-infected mice were immunoprecipitated by anti-FLAG M2 magnetic beads and quantified using LC-MS/MS. Analysis of lipid (PE, PC and PS) content (e) and heatmap showing significantly changed (P < 0.05) PE molecules (f) in the indicated groups (n = 2 samples, each pooled from multiple mice). Asterisks indicate PE molecules with the exact mass. g, SMARTA cells were transduced with the indicated sgRNA and the retrovirus overexpressing empty vector (Empty-RV) or CXCR5 (CXCR5-RV), followed by adoptive transfer into C57BL/6 mice and LCMV infection. Quantification of the proportion of PE+ cells in PSGL-1Ly6C Tfh cells in donor-derived cells from the spleen at day 7 (n = 4 mice). h, SMARTA cells were transduced with the indicated sgRNAs, followed by adoptive transfer into C57BL/6 mice and LCMV infection. Quantification of the proportion of PE+ cells in donor-derived PSGL-1Ly6C Tfh cells from the spleen at day 7 post-infection (n = 4 mice). i, Analysis and quantification of PE outer layer membrane distribution on freshly-isolated wild-type and Pcyt2-deficient Tfh (PSGL-1Ly6C) and Th1 (PSGL-1+Ly6C+) cells (Tfh, n = 5 mice; Th1, n = 4 mice). j, sgNTC or sgPcyt2-transduced SMARTA cells were transferred into C57BL/6 recipients that were subsequently infected with LCMV. Phosphatidylserine (PS) exposure in intact Tfh (PSGL-1Ly6C) and Th1 (PSGL-1+Ly6C+) cell membrane was assessed by Annexin V and 7AAD (left) or MFG-E8 and 7AAD (right) staining analysis at day 5 post-infection (n = 4 mice). Data are representative of two (eh, j), or at least three (ad, i) independent experiments. Data are mean ± s.e.m. P values are determined by one-way ANOVA (h, j), or two-tailed unpaired Student’s t-test (ac, g, i). NS, not significant; ***P < 0.001. Numbers in quadrants or gates indicate percentage of cells.
Extended Data Figure 7.
Extended Data Figure 7.. PE regulates CDP-ethanolamine pathway-mediated Tfh responses.
a, Wild-type and Pcyt2-deficient Tfh cells were sorted from LCMV-infected mice and incubated with [3H]-Etn (2 μCi/ml) for 3 h. Lipids were extracted and [3H]-Etn incorporated into Tfh cells was assessed with a scintillation counter (n = 4 samples). be, Lipid add-back/rescue assay. The sgNTC and sgPcyt2-transduced SMARTA cells were supplemented with the indicated lipids, followed by transfer of these cells to C57BL/6 mice and LCMV infection. b, Diagram showing the time points of lipid treatment. PE was supplemented at days −5, −3 and −1 prior to adoptive transfer, and LCMV-infected mice were analyzed at day 3 post-infection (to capture the effects induced by in vitro PE supplementation). c, Lipidomic analysis showing the PE content in the indicated groups (left), and Venn diagram showing the rescued PE molecules by diacyl-type and ether-type PE supplementation (right) at day 3 post-infection. d, Analysis and quantification of the proportion of PE+ cells in donor-derived Tfh cells (PSGL-1Ly6C) from the spleen (n = 5 mice). e, Analysis and quantification of the proportion of donor-derived CXCR5+SLAM Tfh cells from the spleen (n = 5 mice). f, Gene set enrichment analysis (GSEA) plot for KEGG signature of ABC transporters in Tfh versus Th1 cells (from a public dataset GSE7485448). g, Heatmap showing the top 22 leading-edge genes from the enrichment plot in (f). Data are representative of two (a, c) or at least three (d, e) independent experiments. Data are mean ± s.e.m. P values are determined by one-way ANOVA (d, e) or two-tailed unpaired Student’s t-test (a). *P < 0.05, **P < 0.01, and ***P < 0.001. Numbers in gates indicate percentage of cells.
Extended Data Figure 8.
Extended Data Figure 8.. PE stabilizes surface CXCR5 and prevents it from being targeted for lysosome-mediated degradation.
a, The internalization of surface CXCR5 over time was traced by confocal imaging. b, Wild-type or Pcyt2-deficient SMARTA cells were isolated from LCMV-infected mice and labeled with unconjugated PD-1-specific antibody before incubation at 37 °C. The amount of surface PD-1 remaining over time was detected by fluorophore-conjugated secondary antibody staining (n = 3 mice). c, Flow cytometry analysis of CXCR5 surface expression showed proteinase K treatment (0.1 mg/ml) efficiently removed the non-internalized CXCR5 on the cell surface. d, CXCR5 recycling assay. Cell surface CXCR5 was labeled with unconjugated anti-CXCR5 antibody and incubated at 30 °C to allow internalization of antibody-labeled CXCR5. After washing, the remaining surface-bound antibody was stripped by resuspension in proteinase K, followed by washing and incubation at different time points to allow CXCR5 recycling. The amount of surface CXCR5 recycled over time was detected by fluorophore-conjugated secondary antibody staining and analyzed by flow cytometry (left). Right, quantification of percentage of recycled CXCR5 (relative ratio to untreated cells) (n = 4 mice). e, Validation of anti-CXCR5 antibody (clone number, EPR23463–30) by immunoblot analysis of CXCR5 expression in wild-type and CXCR5-deficient SMARTA cells that were isolated from LCMV-infected mice. f, Immunoblot analysis of CXCR5 and Pcyt2 expression in wild-type and Pcyt2-deficient SMARTA cells that were isolated from LCMV-infected mice and treated with the indicated concentrations of Bafilomycin A1 (BafA1) for 8 h. g, Immunoblot analysis of CXCR5 expression in wild-type and Pcyt2-deficient SMARTA cells isolated from LCMV-infected mice after treatment with the proteasome inhibitor MG-132. h, Flow cytometry analysis of CXCR5 surface expression on wild-type and Pcyt2-deficient SMARTA cells that were isolated from LCMV-infected mice and treated with the indicated concentrations of BafA1 for 8 h. i, Quantification of surface PE levels on human CXCR5+ memory Tfh, CXCR5+ central memory (Tcm) and CD45RA+ naïve-like T cells in peripheral blood (n = 4 donors). j, Analysis and quantification of surface PE levels on human tonsil CXCR5+PD-1hi Tfh cells, transitional CXCR5+PD-1+ Tfh cells, CXCR5 non-Tfh and CD45RA+ naïve-like T cells (n = 8 donors). Data are representative of two (b, eh) or at least three (a, c, d, i, j) independent experiments. P values are determined by one-way ANOVA (i, j) or two-tailed unpaired Student’s t-test (b, d). NS, not significant; *P < 0.05 and ***P < 0.001. Numbers in gates indicate percentage of cells.
Extended Data Figure 9.
Extended Data Figure 9.. Pcyt2 deficiency in activated T cells reveals selective impairments of Tfh accumulation associated with reduced GC responses.
a, Pcyt2 mRNA expression in freshly-isolated (day 0) naïve CD4+ T cells from wild-type and OX40CrePcyt2fl/fl mice, or after in vitro anti-CD3/CD28 antibody stimulation for the indicated times (n = 4 samples). b, Analysis and quantification of Tfh cells (CXCR5+Bcl6+ or CXCR5+PD-1+) among B220CD4+TCRβ+ cells in Peyer’s patches (PPs) and mesenteric lymph nodes (mLNs) from WT and OX40CrePcyt2fl/fl mice (8 weeks old; CXCR5+Bcl6+ Tfh cells, n = 4 mice; CXCR5+PD-1+ Tfh cells, n = 3 mice). c, Analysis and quantification of GC B cells (Fas+GL7+) among B220+CD19+ cells in PPs and mLNs from WT and OX40CrePcyt2fl/fl mice (n = 3 mice). d, Immunohistochemistry of GCs in the mLNs of WT and OX40CrePcyt2fl/fl mice. Scale bar, 50 μm (n = 3 mice). e, Pcyt1a mRNA expression in freshly-isolated (day 0) naïve CD4+ T cells from WT and OX40CrePcyt1afl/fl mice, or after in vitro stimulation with anti-CD3/CD28 antibodies for indicated times (n = 3 samples). f, Analysis and quantification of Tfh cells (CXCR5+Bcl6+ or CXCR5+PD-1+) among B220CD4+TCRβ+ cells in PPs and mLNs from WT and OX40CrePcyt1afl/fl mice (8 weeks old; n = 3 mice). g, Analysis and quantification of GC B cells (Fas+GL7+) among B220+CD19+ cells in PPs and mLNs from WT and OX40CrePcyt1afl/fl mice (n = 3 mice). h, Mixed bone marrow (BM) chimeras were constructed by mixing BM cells from WT or OX40CrePcyt2fl/fl mice and CD45.1+ ‘spike’ mice followed by injection into sub-lethally irradiated Rag1–/– recipient mice. Quantification of Tfh cells (CXCR5+Bcl6+) among CD45.1+B220CD4+TCRβ+ or CD45.2+B220CD4+TCRβ+cells in the PPs and mLNs under steady state (n = 3 mice). i, Analysis and quantification of gp66 tetramer-positive CXCR5+PD-1+ Tfh cells in the spleen of WT and OX40CrePcyt2fl/fl mice at day 7 post-infection (n = 4 mice). j, Retrogenic mouse-derived naïve CD4+ T cells deficient for Etnk1 or Selenoi were transferred into C57BL/6 hosts, followed by LCMV infection. Analyses of the proportion of donor-derived Tfh (CXCR5+SLAM, CXCR5+PD-1+ or PSGL-1Ly6C) cells (left) and quantification of Tfh cell percentage and number (right) in the spleen at day 7 post-infection (n = 4 mice). k, Quantification of numbers of Tfh cells (CXCR5+PD-1+, CXCR5+ICOS+ or CXCR5+Ly6C) or GC B cells in the spleen from WT and OX40CrePcyt2fl/fl mice at day 7 after intraperitoneal immunization with NP-OVA + LPS in alum (n = 4 mice). l, Measurements of anti-NP immunoglobulins in the serum from WT and OX40CrePcyt2fl/fl mice at day 7 after NP-OVA + LPS immunization (n = 16, collected from 8 mice). Data are representative of two (a, el) or at least three (bd) independent experiments. Data are mean ± s.e.m. P values are determined by one-way ANOVA (j) or by two-tailed unpaired Student’s t-test (b, c, fi, k, l). NS, not significant; *P < 0.05, **P < 0.01, and ***P < 0.001. Numbers in gates indicate percentage of cells.
Extended Data Figure 10.
Extended Data Figure 10.. Surface PE distribution and CXCR5 expression on B cells are dependent upon the CDP-ethanolamine pathway.
a, Analysis and quantification of the proportions of CXCR5+PE+ cells on mature conventional B cells (B220hiIgDhiIgMlo) or total B220+IgM+ B cells from the spleen, immature B cells (B220+IgM+ cells from the bone marrow (BM)), as well as splenic naïve CD4+ T cells (n = 3 mice). b, Quantification of CXCR5 and PE mean fluorescence intensities (MFIs) among B220+ cells in spleen, peripheral lymph nodes (pLNs), mesenteric lymph nodes (mLNs), and Peyer’s patches (PPs) of wild-type (WT) and Cd19CrePcyt2fl/fl mice (n = 3 mice). c, Proportion of migrated B cells from the spleen of WT and Cd19CrePcyt2fl/fl mice was assessed by flow cytometry after CXCL13 treatment for 3 h (n = 3 mice). d, Two-step model of Tfh cell differentiation. Expression of Bcl6 and other transcription factors in activated CD4+ T cells orchestrates the initiation and commitment to the Tfh program, leading to the induction of chemokine receptor CXCR5 (left cell). Right cell: In Bcl6/CXCR5-expressing Tfh cells, the CDP-ethanolamine pathway (composed of Etnk1, Pcyt2 and Selenoi), which mediates de novo phosphatidylethanolamine (PE) synthesis, acts as a critical posttranscriptional program for the functional maintenance of the Tfh program. Maintenance of the Tfh program is essential for germinal center (GC) responses, plasma cell formation, and antigen-specific immunoglobulin secretion. In contrast, the CDP-choline pathway that promotes phosphatidylcholine (PC) synthesis and the Pisd-dependent decarboxylation of phosphatidylserine (PS) are dispensable for Tfh accumulation, as indicated by gray shading. e, Mechanistically, the CDP-ethanolamine pathway controls Tfh responses by stabilizing CXCR5 surface expression, CXCL13–CXCR5-mediated signaling events and cellular trafficking to B cell follicles. De novo synthesis of PE downstream of the CDP-ethanolamine pathway enables PE to interact with CXCR5 and prevents its targeting for lysosome-mediated degradation. Depletion of the CDP-ethanolamine pathway reduces the stability, accelerates the internalization rate, and decreases the surface recycling of CXCR5. Data are representative of at least two (ac) independent experiments. Data are mean ± s.e.m. P values are determined by two-tailed unpaired Student’s t-test (b, c). NS, not significant; *P < 0.05 and **P < 0.01. Numbers in gates indicate percentage of cells.
Figure 1.
Figure 1.. In vivo CRISPR-Cas9 screening reveals that CDP-ethanolamine pathway is critical for Tfh differentiation.
a, Scatterplot of gene enrichment (n = 6 sgRNAs per gene). b, c, mCherry+ and Ametrine+ sgRNA-transduced SMARTA cells were mixed at 1:2 and transferred into C57BL/6 recipients followed by LCMV infection. Analysis of donor-derived splenic Tfh (CXCR5+SLAM or PSGL-1Ly6C) and Th1 (CXCR5SLAM+ or PSGL-1+Ly6C+) cells at day 7 post-infection (n = 4 mice). d, Summary of CDP-ethanolamine pathway genes in Tfh generation. e, Heatmap of the enrichment of indicated genes ([log2 ratio (input/Tfh)]). f, g, Principal component analysis of lipidome (f) and quantification of PE content (g) in the indicated cells (n = 3 samples, each pooled from multiple mice). h, Distribution and the quantification of SMATRA cells in the splenic follicle at day 3 post-infection (sgNTC, n = 50 sections; sgPcyt2, n = 47 sections). Scale bar, 50 μm. i, Analysis of splenic GC B cells (B220+CD19+Fas+GL7+) and plasma cells (B220CD138+) in LCMV-infected CD45.2+ mice receiving CD45.1+ wild-type or Pcyt2-deficient CXCR5+SLAM Tfh cells (n = 4 mice). Data are representative of one (a, e), two (fi), or at least three (bd) independent experiments. Data are mean ± s.e.m. *P < 0.05, **P < 0.01, and ***P < 0.001. Two-tailed paired Student’s t-test followed by Bonferroni correction (a), one-way ANOVA (c, g, i) or two-tailed unpaired Student’s t-test (h).
Figure 2.
Figure 2.. CDP-ethanolamine pathway regulates CXCR5 expression independently of Bcl6.
a, sgRNA-transduced SMARTA cells were transferred into C57BL/6 recipients followed by LCMV infection. Analysis of donor-derived splenic CXCR5+Bcl6+ cells at day 3 post-infection (left). Right, mean fluorescence intensity (MFI) of Bcl6 and CXCR5 (n = 4 mice). b, SMARTA cells were transduced with indicated retrovirus, followed by adoptive transfer and LCMV infection. Analysis of CXCR5+PD-1+ Tfh cells in donor-derived cells at day 3 post-infection (n = 3 mice). Numbers above the graph indicate the fold changes. c, Analysis of CXCR5 and PD-1 MFI on donor-derived cells at day 2 post-infection (n = 4 mice). d, Proportion of migrated CXCR5+SLAM Tfh cells after 3 h of CXCL13 (n = 4 mice) or CCL21 treatment (n = 6 mice). e, Analysis of frequency of phosphorylated AKT (pAKT-S473)+ in donor-derived cells at day 3 post-infection (n = 4 mice). Data are representative of two (d) or at least three (ac, e) independent experiments. Data are mean ± s.e.m. NS, not significant; *P < 0.05, **P < 0.01, and ***P < 0.001. One-way ANOVA (a) or two-tailed unpaired Student’s t-test (be).
Figure 3.
Figure 3.. PE selectively distributes on the outer layer of Tfh membrane and stabilizes CXCR5.
a, Confocal microscopy and analyses of PE and CXCR5 co-localization and PE mean fluorescence intensity (MFI) on PSGL-1Ly6C Tfh cells and PSGL-1+Ly6C+ Th1 cells (Tfh, n = 99 cells; Th1 n = 85 cells). Scale bar, 10 μm. b, TIRF (total internal reflection fluorescence)–STORM (stochastic optical reconstruction microscopy) analysis and quantification (via NSInC) of PE and CCR7 or CXCR5 co-localization on PSGL-1Ly6C Tfh cells. Scale bar, 1 μm (PE : CCR7, n = 33 cells; PE : CXCR5, n = 25 cells). c, Scanning electron microscopy of PE and CXCR5 co-localization on the outer layer membrane of Tfh cells. Scale bar, 5 μm (n = 12 cells). Yellow rings show discrete islands. d, Image analysis of PE and CXCR5 levels on Tfh and Th1 cells (sgNTC Tfh, n = 120 cells; sgPcyt2 Tfh, n = 157 cells; sgNTC Th1, n = 72 cells; sgPcyt2 Th1, n = 45 cells). Scale bar, 10 μm. e, sgNTC and sgPcyt2-transduced SMARTA cells were supplemented with ether-type PE or diacyl-type PE, followed by adoptive transfer and LCMV infection. Quantification of CXCR5+PD-1+ Tfh cells and CXCR5 MFI on donor-derived cells (n = 5 mice). f, Images of Tfh cell CXCR5 internalization. Scale bar, 5 μm. g, CXCR5 internalization (see Methods; n = 4 mice). h, Immunoblot of CXCR5 in cells treated with cycloheximide (CHX) (n = 2 samples, each pooled from multiple mice). Data are representative of two (c, h) or at least three (a, b, dg) independent experiments. Data are mean ± s.e.m. NS, not significant; *P < 0.05, **P < 0.01, and ***P < 0.001. One-way ANOVA (e) or two-tailed unpaired Student’s t-test (ad, g, h).
Figure 4.
Figure 4.. Genetic ablation of CDP-ethanolamine pathway disrupts humoral immunity.
a, Analysis of percentage of PE+ cells and PE mean fluorescence intensity (MFI, in PE+ cells) on Tfh cells from Peyer’s patches of WT and OX40CrePcyt2fl/fl mice (n = 3 mice). b, Immunohistochemistry of GCs in the mesenteric lymph nodes of WT and OX40CrePcyt2fl/fl mice. Right, GC area size (WT, n = 19 sections; OX40CrePcyt2fl/fl, n = 33 sections) and T cell number in GCs (WT, n = 12 sections; OX40CrePcyt2fl/fl, n = 23 sections). Scale bar, 50 μm. c, Analysis of gp66 tetramer-positive splenic CXCR5+SLAM Tfh and CXCR5SLAM+ Th1 cells in WT and OX40CrePcyt2fl/fl mice at day 7 post-infection (n = 4 mice). d, Analysis of GC B cells (B220+CD19+Fas+GL7+) and plasma cells (B220CD138+) in WT and OX40CrePcyt2fl/fl mice at day 7 post-infection (n = 4 mice). e, Measurements of serum anti-NP immunoglobulins from WT and OX40CrePcyt2fl/fl mice at day 7 after NP-OVA + LPS immunization (n = 16, collected from 8 mice). Data are representative of two (ce) or at least three (a, b) independent experiments. Data are mean ± s.e.m. NS, not significant; *P < 0.05, **P < 0.01, and ***P < 0.001. Two-tailed unpaired Student’s t-test (ae).

References

    1. Crotty ST Follicular Helper Cell Biology: A Decade of Discovery and Diseases. Immunity 50, 1132–1148, (2019). - PMC - PubMed
    1. Johnston RJ et al.Bcl6 and Blimp-1 Are Reciprocal and Antagonistic Regulators of T Follicular Helper Cell Differentiation. Science 325, 1006–1010, (2009). - PMC - PubMed
    1. Nurieva RI et al.Bcl6 Mediates the Development of T Follicular Helper Cells. Science 325, 1001–1005, (2009). - PMC - PubMed
    1. Zeng H et al.mTORC1 and mTORC2 Kinase Signaling and Glucose Metabolism Drive Follicular Helper T Cell Differentiation. Immunity 45, 540–554, (2016). - PMC - PubMed
    1. Chapman NM, Boothby MR & Chi H Metabolic coordination of T cell quiescence and activation. Nat Rev Immunol 20, 55–70, (2020). - PubMed

Online References

    1. Platt RJ et al.CRISPR-Cas9 knockin mice for genome editing and cancer modeling. Cell 159, 440–455, (2014). - PMC - PubMed
    1. Oxenius A, Bachmann MF & Zinkernagel RMH, H. Virus-specific MHC class II-restricted TCR- transgenic mice: effects on humoral and cellular immune responses after viral infection. Eur J Immunol 28, 390–400, (1998). - PubMed
    1. Leonardi R, Frank MW, Jackson PD, Rock CO & Jackowski S Elimination of the CDP-ethanolamine Pathway Disrupts Hepatic Lipid Homeostasis. J Biol Chem 284, 27077–27089, (2009). - PMC - PubMed
    1. Zhang D et al.Macrophages deficient in CTP:Phosphocholine cytidylyltransferase-alpha are viable under normal culture conditions but are highly susceptible to free cholesterol-induced death. J Biol Chem 275, 35368–35376, (2000). - PubMed
    1. Bettini ML, Bettini M, Nakayama M, Guy CS & Vignali DA Generation of T cell receptor-retrogenic mice: improved retroviral-mediated stem cell gene transfer. Nat Protoc 8, 1837–1840, (2013). - PMC - PubMed

Publication types

MeSH terms

Substances