. 2021 Jun 21:12:665041.
doi: 10.3389/fmicb.2021.665041. eCollection 2021.

A Novel SARS-CoV-2 Viral Sequence Bioinformatic Pipeline Has Found Genetic Evidence That the Viral 3' Untranslated Region (UTR) Is Evolving and Generating Increased Viral Diversity

Affiliations

A Novel SARS-CoV-2 Viral Sequence Bioinformatic Pipeline Has Found Genetic Evidence That the Viral 3' Untranslated Region (UTR) Is Evolving and Generating Increased Viral Diversity

Carlos Farkas et al. Front Microbiol. .

Abstract

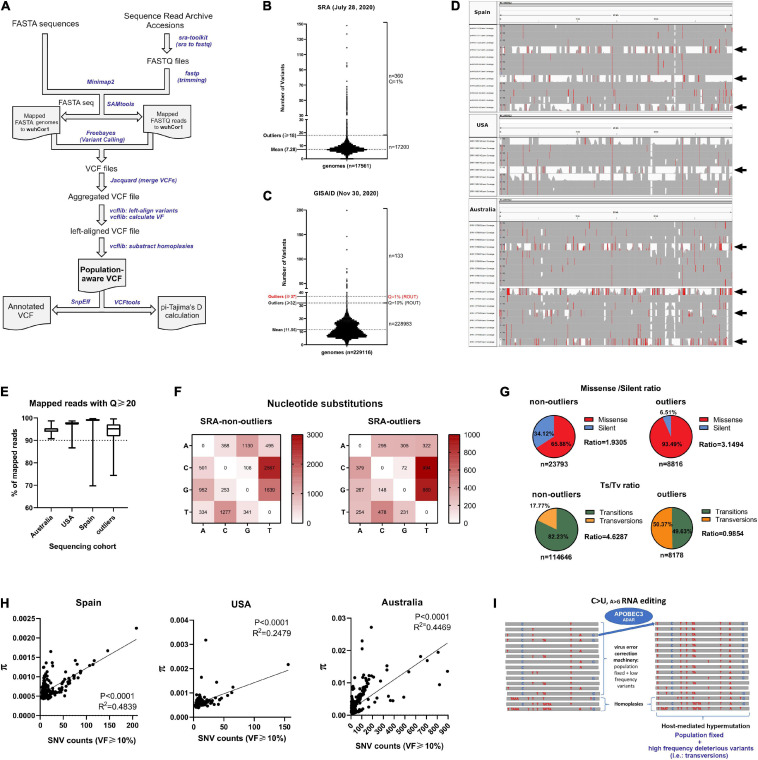
An unprecedented amount of SARS-CoV-2 sequencing has been performed, however, novel bioinformatic tools to cope with and process these large datasets is needed. Here, we have devised a bioinformatic pipeline that inputs SARS-CoV-2 genome sequencing in FASTA/FASTQ format and outputs a single Variant Calling Format file that can be processed to obtain variant annotations and perform downstream population genetic testing. As proof of concept, we have analyzed over 229,000 SARS-CoV-2 viral sequences up until November 30, 2020. We have identified over 39,000 variants worldwide with increased polymorphisms, spanning the ORF3a gene as well as the 3' untranslated (UTR) regions, specifically in the conserved stem loop region of SARS-CoV-2 which is accumulating greater observed viral diversity relative to chance variation. Our analysis pipeline has also discovered the existence of SARS-CoV-2 hypermutation with low frequency (less than in 2% of genomes) likely arising through host immune responses and not due to sequencing errors. Among annotated non-sense variants with a population frequency over 1%, recurrent inactivation of the ORF8 gene was found. This was found to be present in the newly identified B.1.1.7 SARS-CoV-2 lineage that originated in the United Kingdom. Almost all VOC-containing genomes possess one stop codon in ORF8 gene (Q27), however, 13% of these genomes also contains another stop codon (K68), suggesting that ORF8 loss does not interfere with SARS-CoV-2 spread and may play a role in its increased virulence. We have developed this computational pipeline to assist researchers in the rapid analysis and characterization of SARS-CoV-2 variation.

Keywords: 3cpsdummy′UTR; SARS-CoV-2 variants; Tajima’s D-statistic; VCF; nucleotide diversity (π); viral evolution.


Conflict of interest statement

The authors declare that the research was conducted in the absence of any commercial or financial relationships that could be construed as a potential conflict of interest.

Figures

FIGURE 1
FIGURE 1
SARS-CoV-2 genome analysis reveals inter-host diversity that in extreme cases leads to hypermutation. (A) Pipeline overview to process GISAID FASTA genome sequences and Sequence Read Archive datasets. Both inputs are aligned to SARS-CoV-2 reference genome (wuhCor1) and variant calling is performed to obtain a single population-aware VCF file suitable for downstream genetic analysis. Streamlined bioinformatic tools are depicted with blue letters. (B) Major viral frequency variants (via a consensus calling approach) for 17,560 next generation sequencing (NGS) datasets downloaded from SRA, separated by non-outliers (n = 17,200) and outliers (n = 360, Q = 1%, Grubbs’s test). Outlier number and mean of variants are depicted at left. (C) Same as B for 229,124 SARS-CoV-2 GISAID genomes, separated by non-outliers (n = 228,093) and outliers (n = 143, Q = 10%, Grubbs’s test). Outlier number and mean of variants are depicted at left. (D) IGV snapshots of outliers and non-outlier NGS samples from C. Outlier samples are depicted with black arrows, exceeding number of variants from non-outliers. Single nucleotide polymorphisms are depicted in red if nucleotide differs from the reference sequence by greater or equal to 50% of quality weighted reads. (E) Q20 statistics obtained with SeqKit program for mapped reads of 374 NGS datasets from Spain, 215 NGS datasets from United States, 397 NGS datasets from Australia and 360 outlier NGS datasets from SRA. Percentages are depicted in the y-axis. (F) Nucleotide change frequencies from 17,200 SRA NGS aggregated variants (non-outliers, left) and from 360 aggregated outlier variants (right), both annotated with SnpEff program. Frequency boxes are colored from white to dark red as number of changes increases. (G) (Upper) Pie charts depicting missense/silent ratios registered in the non-outliers and outlier NGS samples. Values are denoted as percentages and the total number of variants are denoted in the bottom of the graphs. (Lower) Same as upper, for transitions/transversions ratios (Ts/Tv). (H) Correlation between Average nucleotide diversity (π) provided by inStrain program and SNV counts (VF > 10%) for Spain (n = 374, left), United States (n = 215, middle) and Australian NGS samples (n = 397, right). In the three countries, the two variables tend to increase together (see r-values of Spearman correlation analyses). (I) Proposed model of how APOBEC3G and ADAR complex (with minor contributions) can lead to hypermutation of SARS-CoV-2 (C > U and A > G editing) accompanied by intra-host diversity, homoplasies and increased transversions. In the majority of infections, it is probable that micro diversity is maintained at low frequencies due the action of the virus error correction machinery.
FIGURE 2
FIGURE 2
Non-neutral codon changes actively shape evolution of several SARS-CoV-2 proteins. (A) Nucleotide change frequencies from 229,124 aggregated GISAD genome variants annotated with SnpEff program. Frequency boxes are colored from white to dark red as number of changes increase. (B) Same as A for 133 aggregated GISAID genomes, corresponding to GISAID outlier samples. Frequencies boxes are colored from white to dark red, as the number of changes increases. (C) Missense, non-sense, frameshift, and synonymous number of occurrences in 229,124 GISAID genomes. Significance of comparisons were assessed with Mann-Whitney test (****P < 0.0001, nsP > 0.05). (D) Plot of change frequencies across 20 amino acid changes in SARS-CoV-2. Changes are grouped in six categories and colored from light to dark red, according to the number of changes. (E) Spike protein mutant molecular dynamics. (Left) RMSD values (in nanometers, nm) of 20 ns of simulation of the wild-type N-terminal domain (A222) or mutant domain (V222). Residue positions of the domain respect to the full Spike protein is depicted in light blue. (Middle) Same as left for the wild-type RBD domain of the Spike protein (S477) or mutant RBD domain (N477). Residue positions of the domain with respect to the full Spike protein that is depicted in light blue. (Right) Same as left for the wild-type stalk domain trimmer (V1176) or the mutant domain containing Phenylalanine in position 1176 (F1176).
FIGURE 3
FIGURE 3
(A) Worldwide distribution of Tajima’s D values versus nucleotide diversity (π) for 595 bins of 50 bp in length derived from 229,124 GISAID genomes. The dashed lines correspond to the upper (97.5%) and lower (2.5%) percentiles of the empirical distribution of Tajima’s D for each bin. Genes containing the top three most extreme outlier bins are depicted in blue (in the upper 97.5th percentile) and red (in the lower 2.5th percentile). Also, genes containing the top three most diverse bins are depicted in purple. (B) Number of variants per gene derived from bins in the 97.5th and 2.5th percentile of the empirical distribution of Tajima’s D values from A, respectively. (C) Parts-of-whole plot of non-sense (Stop Codon) frequencies with worldwide viral frequencies over or equal to 1% from 229,124 GISAID genomes until November 30, 2020. ORF8 stop codons are depicted in a range of red colors, ORF3a stop codons are depicted with a range of purple colors, and ORF7a stop codons are depicted with a range of green colors. (D) Variants per gene derived from bins in the 2.5th and 97.5th percentile of the empirical distribution of Tajima’s D values, derived from African (n = 4301), Asian (n = 11,986), Oceanic (n = 17,211), North American (n = 47,658), South American (n = 2325), and European (n = 145,884). GISAID genomes, respectively. (Left) Plot of genes containing bins in the 97.5th percentile of the empirical distribution of Tajima’s D from GISAID genomes in every geographical region, until November 30, 2020. (Right) Plot of genes containing bins in the 2.5th percentile of the empirical distribution of Tajima’s D from GISAID genomes in every geographical region, until November 30, 2020. (E) Viral frequencies (as percentages) arranged per gene from variants contained in the VOC genomes submitted in GISAID until January 17th, 2021. (F) Same plot as (A) for GISAID genomes from the B.1.1.7 lineage submitted in GISAID until January 07, 2021 (left, 9194 genomes), January 17, 2021 (middle, 18,101 genomes), and January 27, 2020 (right, 36,308 genomes).

References

    1. Afgan E., Baker D., Batut B., van den Beek M., Bouvier D., Cech M., et al. (2018). The Galaxy platform for accessible, reproducible and collaborative biomedical analyses: 2018 update. Nucleic Acids Res. 46 W537–W544. - PMC - PubMed
    1. Birra D., Benucci M., Landolfi L., Merchionda A., Loi G., Amato P., et al. (2020). COVID 19: a clue from innate immunity. Immunol. Res. 68 161–168. 10.1007/s12026-020-09137-5 - DOI - PMC - PubMed
    1. Biswas S., Akey J. M. (2006). Genomic insights into positive selection. Trends Genet. 22 437–446. 10.1016/j.tig.2006.06.005 - DOI - PubMed
    1. Chen L., Zhong L. (2020). Genomics functional analysis and drug screening of SARS-CoV-2. Genes. Dis. 7 542–550. 10.1016/j.gendis.2020.04.002 - DOI - PMC - PubMed
    1. Chen S., Zhou Y., Chen Y., Gu J. (2018). fastp: an ultra-fast all-in-one FASTQ preprocessor. Bioinformatics 34 i884–i890. - PMC - PubMed