. 2021 Jun 21:12:702705.
doi: 10.3389/fimmu.2021.702705. eCollection 2021.

Oral Vaccination Approaches for Anti-SHIV Immunity

Affiliations

Oral Vaccination Approaches for Anti-SHIV Immunity

Erandi Velarde de la Cruz et al. Front Immunol. .

Abstract

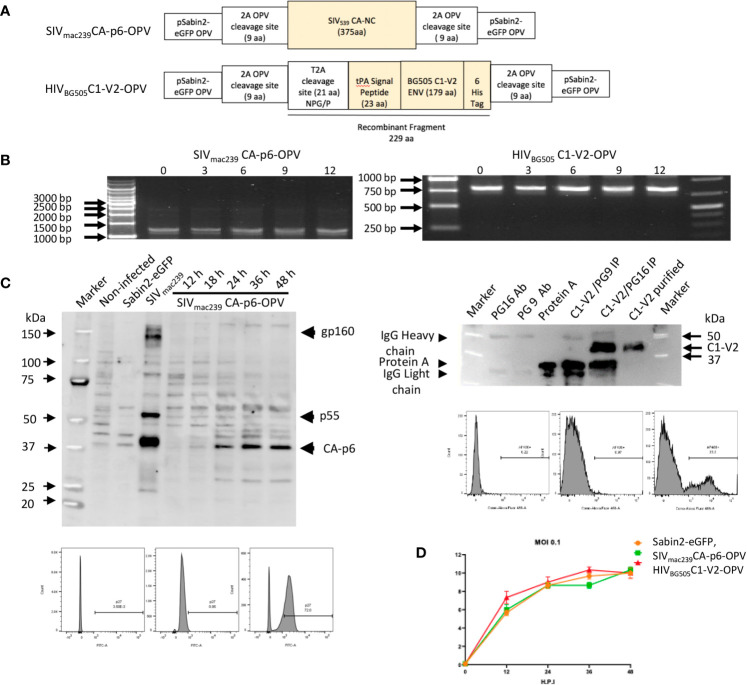
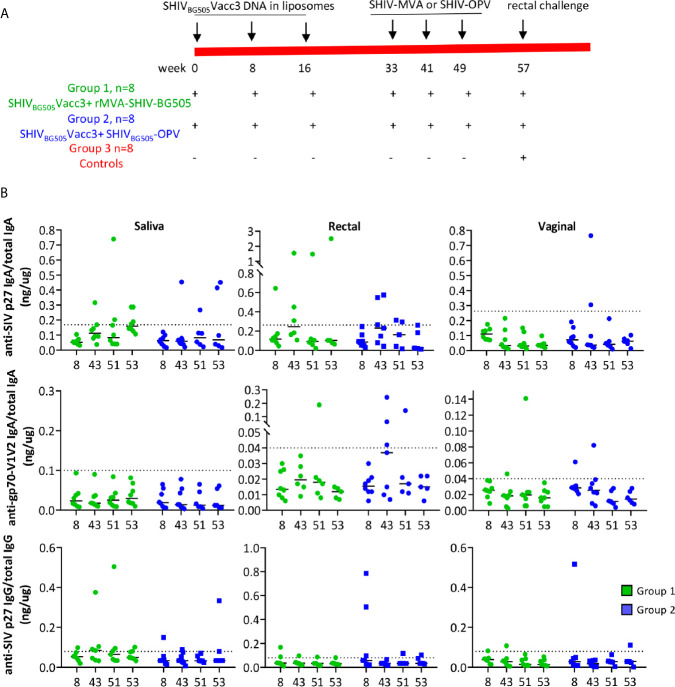
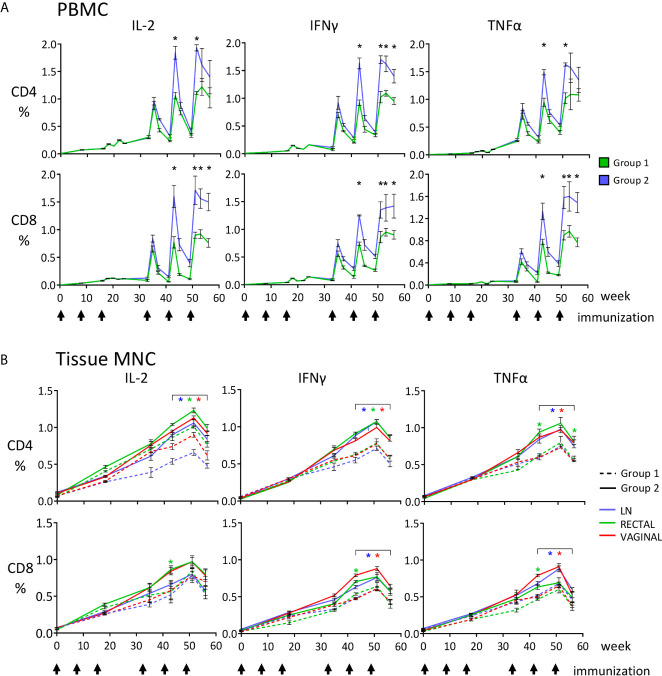
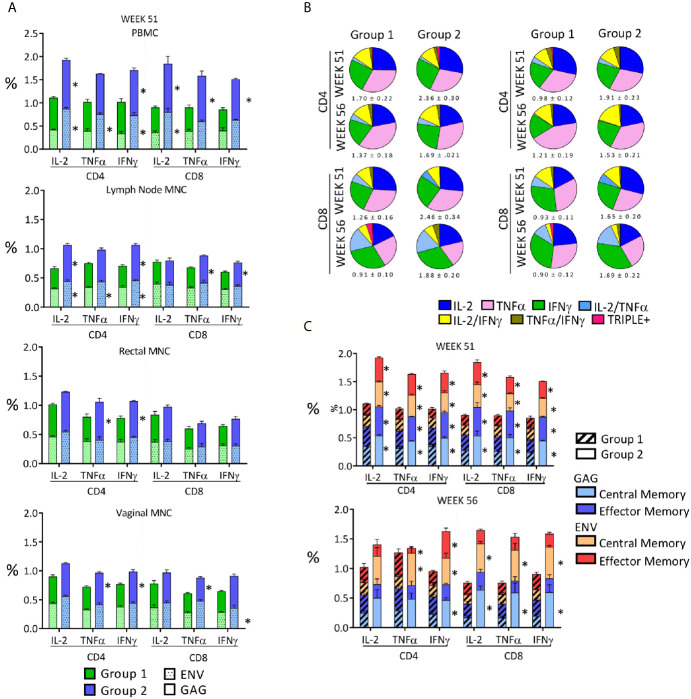
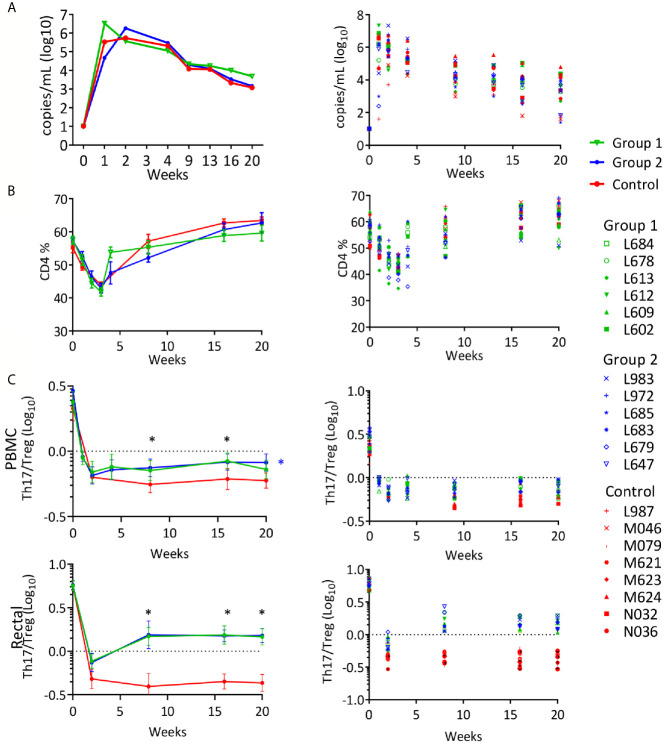
We modified a Sabin Oral Poliovirus Vaccine (OPV) vector to permit secretion of the antigens of interest with the goal of improving anti-HIV Env humoral responses in a SHIV mucosal immunization composed of DNA and recombinant OPVs. We evaluated stimulation of systemic and mucosal cell-mediated and humoral immunity in Rhesus macaques by two regimens, both involving a prime with a SHIVBG505 DNA construct producing non-infectious particles formulated in lipid nanoparticles, administered in the oral cavity, and two different viral vector boostings, administered in the oral cavity and intestinally. Group 1 was boosted with rMVA-SHIVBG505, expressing SIV Gag/Pol and HIVBG505 Env. Group 2 was boosted with a SHIVBG505-OPV vaccine including a non-secreting SIVmac239CA-p6-OPV, expressing Gag CA, NC and p6 proteins, and a HIVBG505C1-V2-OPV, secreting the C1-V2 fragment of HIV EnvBG505, recognized by the broadly neutralizing antibody PG16. A time course analysis of anti-SHIV Gag and Env CD4+ and CD8+ T-cell responses in PBMC and in lymph node, rectal, and vaginal MNC was carried out. Both regimens stimulated significant cell-mediated responses in all compartments, with SHIVBG505-OPV immunization stimulating more significant levels of responses than rMVA- SHIVBG505. Boolean analysis of these responses revealed predominantly monofunctional responses with multifunctional responses also present in all tissues. Stimulation of antibody responses was disappointing in both groups with negative anti-SHIV IgG in plasma, and IgA in salivary, rectal and vaginal secretions being restricted to a few animals. After repeated rectal challenge with SHIVBG505, two Group 1 animals remained uninfected at challenge termination. No significant differences were observed in post-infection viral loads between groups. After the acute phase decline, CD4+ T cell percentages returned to normal levels in vaccinated as well as control animals. However, when compared to controls, vaccinate groups had more significant preservation of PBMC and rectal MNC Th17/Treg ratios, considered the strongest surrogate marker of progression to AIDS. We conclude that the vaccine platforms used in this study are insufficient to stimulate significant humoral immunity at the tested doses and schedule but sufficient to stimulate significant mucosal and systemic cell-mediated immunity, impacting the preservation of key Th17 CD4+ T cells in blood and rectal mucosa.

Keywords: AIDS; HIV; SHIV vaccine; mucosal immunity; oral vaccine; poliovirus vector.


Conflict of interest statement

The authors declare that the research was conducted in the absence of any commercial or financial relationships that could be construed as a potential conflict of interest.

Figures

Figure 1
Figure 1
(A) Schematic diagram of Recombinant OPVs: orange boxes illustrate the SHIV recombinant antigens that are ultimately produced by OPV. The SIVmac239CA-p6 sequence was inserted between two 2A protease cleavage sites in pSabin2-eGFP, replacing gfp to generate SIVmac239CA-p6-OPV. The corresponding protein becomes expressed intracellularly once the cleavage of the OPV polyprotein occurs. The HIVBG505 Env C1-V2 region was cloned linked to tPA signal peptide that permits its secretion to generate HIVBG505C1-V2-OPV. The recombinant fragment amino acid sequence, starting and ending with polio protease cleavage sequences, with polio protease TTY/G and T2A NPG/P cleavage indicated by a bar, and with HIV Env sequence underlined, is the following: GLTTY/GFGHGGGGGGSRLEGSGEGRGSLLTCGDVEENPG/PMDAMKRGLCCVLLLCGAVFVSASAENLWVTVYYGVPVWKDAETTLFCASDAKAYETEKHNVWATHACVPTDPNPQEIHLENVTEEFNMWKNNMVEQMHTDIISLWDQSLKPCVKLTPLCVTLQCTNVTNNITDDMRGELKNCSFNMTTELRDKKQKVYSLFYRLDVVQINENQGNRSNNSNKEYRLINCNTSATQACPKVSFHHHHHHVDGLTTY/GFGH. (B) Stability of passaged recombinant OPVs: RT-PCR to detect recombinant OPV expression in RNA of infected cells after virus passage. Selective passages from 0 to 12 are reported. (C) Left top panel: Western blot of cell lysates from 293T cells: non-infected (lane 2), infected with Sabin2-eGFP (lane 3), transfected with SIVmac239 DNA (lane 4), infected with SIVmac239CA-p6-OPV (lanes 5-9, harvested at 12 to 48 hrs after infection). A SHIV-infected monkey serum was used as primary antibody. Left bottom panels: flow cytometric analysis of 293T infected cells stained with an anti-SIV p27 antibody (unstained, DAPI stained, DAPI+anti-p27 panels). Right top panel: Detection of the HIVBG505C1-V2 fragment by Western blot, probed with anti-HIS mAb: mAb PG16 (lane 2); mAb PG9 (lane 3), Protein A (lane 4), HIVBG505C1-V2 fragment, purified from tissue culture supernatant after HIVBG505C1-V2-OPV infection and immunoprecipitated with NAb PG9 (lane 5) or with NAb PG16. (lane 6), purified HIVBG505C1-V2 (lane 7). Right bottom panels: flow cytometric analysis of 293T infected cells stained with an anti-HIS mAb (unstained, DAPI alone staining, DAPI+anti-HIS staining panels). (D) Growth curve of recombinant OPVs in 293T cells. After 293T cell infection at 0.1 MOI with Sabin2-eGFP, SIVmac239CA-p6-OPV and HIVBG505C1-V2-OPV, supernatants were harvested at time points indicated on the X axis and the corresponding titer, obtained by TCID50 evaluation, is reported on the Y axis.
Figure 2
Figure 2
(A) Vaccination scheme and animal groups. (B) Levels of anti-SIV p27 IgA (top 3 panels), anti-gp70-V1V2 IgA (middle panels) and anti-SIV p27 IgG in saliva (left column), rectal (middle column), and vaginal secretions (right column) were measured by BAMA and normalized relative to concentrations of total IgA or IgG, determined by ELISA. The specific activity (ng IgA or IgG antibody/µg total IgA or IgG, respectively) for individual animals at four time points during vaccination is reported. The dashed line denotes the cut-off for significance and was calculated as the mean specific activity + 3 SD for pre-immunization samples. The specific activity had to exceed the dotted line and be 3 times higher than the animal’s pre-immune sample to be considered significant. A few samples with insufficient total IgA or IgG were not tested for SHIV-specific antibodies.
Figure 3
Figure 3
Quantitative analysis of the anti-SHIV cell-mediated responses measured during the immunization phase, reported as percentages of CD4+ and CD8+ T cells producing IFNγ, TNF-α and IL-2, detected by ICS and flow cytometric analysis upon stimulation with SIV Gag or HIV Env peptide pools. (A) PBMC, asterisks indicate that T-cell percentages (Gag + Env) at the indicated time points are significantly higher for Group 2 (SHIVBG505-DNA+SHIV BG505-OPV, blue) compared to Group 1 (SHIVBG505-DNA+ rMVA-SHIV-BG505, green); (B) LN, rectal and vaginal MNC; the graphs show the total SHIV-specific T-cell responses (Gag + Env) for the two vaccinated groups, Group 1 (dashed line) and Group 2 (solid line). Color refer to the source of samples examined (LN, vaginal or rectal). The color of the asterisks used in panel (B) to report statistical significance matches the color used for the samples in question. Asterisks under brackets indicate that values from week 43 to week 56 are all significantly higher for the specific tissue when Group 2 is compared to Group 1 (p value range: 0.0001-0.039). Between groups comparisons reported in panels (A, B) were carried out by two-tailed, t test or Mann-Whitney U test when the value distribution was non-parametric.
Figure 4
Figure 4
Qualitative analysis of the anti-SHIV cell-mediated responses stimulated by the vaccination. (A) Anti-SIV Gag and Env percentages observed 2 weeks after the last immunization in the two vaccinated groups in PBMC, LN, rectal and vaginal MNC. Asterisks indicate significant difference between Group 1 and Group 2 and are placed adjacent to the relevant column segment. (B) Pie graphs representing the diversity of anti-SHIV CD4+ and CD8+ T-cell responses as relative fractions of the total percentages of positive cells, expressing a IFNγ, TNF-α and IL-2 alone or a combination of them within anti-SIV gag (left panel) or anti-HIV env (right panel) responses. Functional analysis is in biopsies 2 weeks after the last immunization (week 51) and two weeks before challenge (week 56). The total mean percentage and SE of the antigen-specific responses for each analyzed variable is shown below each pie. (C) Central memory (CM) and effector memory (EM) fractions in SHIV-specific cell-mediated T-cell responses present in PBMC on week 51 (2 weeks after last immunization) and week 56 (naïve cells: CD28+CD95-; memory T cells: CD28+CD95+; and effector T cells: CD28-CD95+). The average percentages of anti-Gag and anti-Env T cells in each group are stacked in the column and shaded differently. Asterisks adjacent to column segments indicate a significant difference between Groups 1 and 2 for that segment. Between groups comparisons reported in panels (A, C) were carried out by two-tailed, t test or Mann-Whitney U test if the value distribution was non- parametric (p value range: 0.0001-0.045).
Figure 5
Figure 5
Rectal SHIVBG505 challenge outcome: (A) Viral loads reported as geometric group means (Log10) in the left panel and for each individual animal in the right panel. (B) PBMC CD4+ T-cell levels reported for each group as average percentages (left panel) or as percentages for each animal (right panel) during the course of the infection. (C) Th17/Treg ratio in PBMC (top) and rectal MNC (bottom) CD4+ T cells, reported as group average ± SE (left panel) or as individual values for each animal (right panel) during the course of the infection. Statistical significance among groups was tested with 1-way ANOVA with Sidak’s multiple comparisons test (*p value range: 0.0001-.021). Black asterisks indicate time points when both Group 1 and Group 2 values were significantly greater than those in the control group. The blue asterisk in the PBMC panel indicates significance for Group 2 value vs. control group.

References

    1. Gottardo R, Bailer RT, Korber BT, Gnanakaran S, Phillips J, Shen X, et al. . Plasma IgG to Linear Epitopes in the V2 and V3 Regions of HIV-1 Gp120 Correlate With a Reduced Risk of Infection in the RV144 Vaccine Efficacy Trial. PloS One (2013) 8(9):e75665. 10.1371/journal.pone.0075665 - DOI - PMC - PubMed
    1. Tomaras GD, Haynes BF. Advancing Toward HIV-1 Vaccine Efficacy Through the Intersections of Immune Correlates. Vaccines (2014) 2(1):15–35. 10.3390/vaccines2010015 - DOI - PMC - PubMed
    1. Zolla-Pazner S, deCamp AC, Cardozo T, Karasavvas N, Gottardo R, Williams C, et al. . Analysis of V2 Antibody Responses Induced in Vaccinees in the ALVAC/AIDSVAX HIV-1 Vaccine Efficacy Trial. PloS One (2013) 8(1):e53629. 10.1371/journal.pone.0053629 - DOI - PMC - PubMed
    1. Zolla-Pazner S, Alvarez R, Kong XP, Weiss S. Vaccine-Induced V1V2-Specific Antibodies Control and or Protect Against Infection With HIV, SIV and SHIV. Curr Opin HIV AIDS (2019) 14(4):309–17. 10.1097/COH.0000000000000551 - DOI - PMC - PubMed
    1. Tomaras GD, Plotkin SA. Complex Immune Correlates of Protection in HIV-1 Vaccine Efficacy Trials. Immunol Rev (2017) 275(1):245–61. 10.1111/imr.12514 - DOI - PMC - PubMed

Publication types

MeSH terms