

Effect of the ACAA1 Gene on Preadipocyte Differentiation in Sheep
- PMID: 34234807
- PMCID: PMC8255805
- DOI: 10.3389/fgene.2021.649140
Effect of the ACAA1 Gene on Preadipocyte Differentiation in Sheep
Abstract
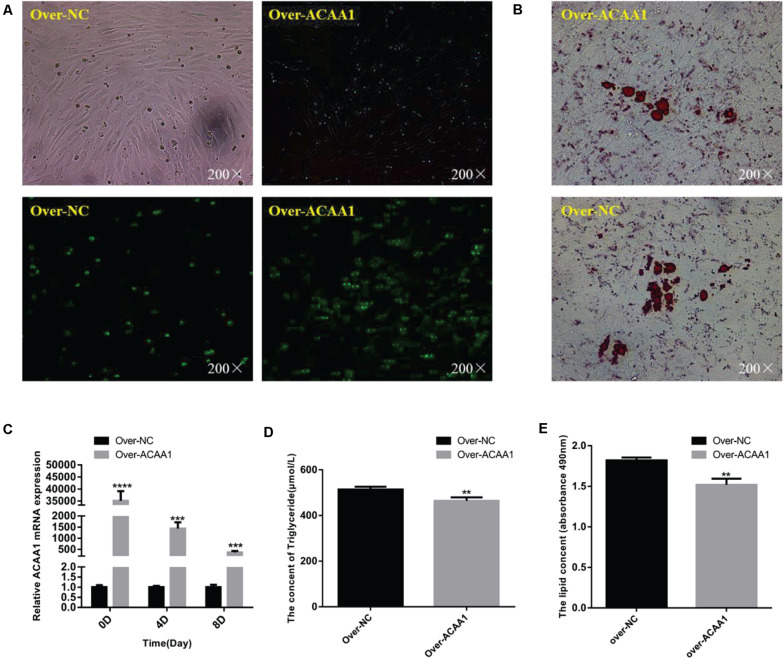
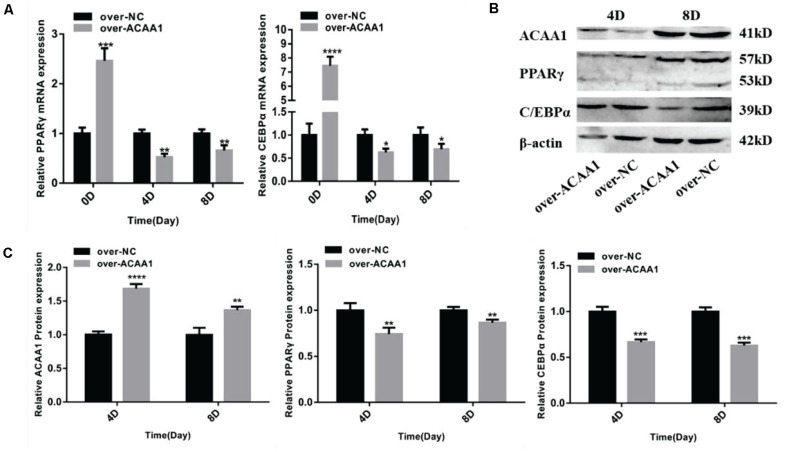
Acetyl-CoA acyltransferase 1 (ACAA1) functions as a key regulator of fatty acid β-oxidation in peroxisomes by catalyzing the cleavage of 3-ketoacyl-CoA to acetyl-CoA and acyl-CoA, which participate in the extension and degradation of fatty acids. Thus, ACAA1 is an important regulator of lipid metabolism and plays an essential role in fatty acid oxidation and lipid metabolism. Our previous study findings revealed that ACAA1 is closely associated with the peroxisome proliferator-activated receptor (PPAR) signaling and fatty acid metabolism pathways, which are involved in fat deposition in sheep, leading to our hypothesis that ACAA1 may be involved in fat deposition by regulating lipid metabolism. However, the associated molecular mechanism remains unclear. In the present study, to assess the potential function of ACAA1 in sheep preadipocyte differentiation, we knocked down and overexpressed ACAA1 in sheep preadipocytes and evaluated the pattern of ACAA1 gene expression during preadipocyte differentiation by qRT-PCR. ACAA1 was significantly expressed in the early stage of adipocyte differentiation, and then its expression decreased. ACAA1 deficiency increased lipid accumulation and the triglyceride content and promoted sheep preadipocyte differentiation, whereas ACAA1 overexpression inhibited adipogenesis and decreased lipid accumulation and the triglyceride content. Simultaneously, we demonstrated that ACAA1 deficiency upregulated the expressions of the adipogenic marker genes PPARγ and C/EBPα in sheep preadipocytes, but ACAA1 overexpression inhibited the expressions of these markers, indicating that ACAA1 affects lipid metabolism by regulating adipogenic marker genes. Our results may promote a better understanding of the regulation of adipogenesis by ACAA1.
Keywords: ACAA1 gene; adipogenesis; lipid metabolism; preadipocyte differentiation; sheep.
Copyright © 2021 Wang, Li, Cao, Xiao, Liu, Jin and Cao.
Conflict of interest statement
The authors declare that the research was conducted in the absence of any commercial or financial relationships that could be construed as a potential conflict of interest.
Figures


Similar articles
-
Effects of SPARCL1 on the proliferation and differentiation of sheep preadipocytes.Adipocyte. 2021 Dec;10(1):658-669. doi: 10.1080/21623945.2021.2010901. Adipocyte. 2021. PMID: 34872433 Free PMC article.
-
MiR-9-5p promotes rabbit preadipocyte differentiation by suppressing leptin gene expression.Lipids Health Dis. 2020 Jun 5;19(1):126. doi: 10.1186/s12944-020-01294-8. Lipids Health Dis. 2020. PMID: 32503618 Free PMC article.
-
miR-130b duplex (miR-130b-3p/miR-130b-5p) negatively regulates goat intramuscular preadipocyte lipid droplets accumulation by inhibiting Krüppel-like factor 3 expression.J Anim Sci. 2023 Jan 3;101:skad184. doi: 10.1093/jas/skad184. J Anim Sci. 2023. PMID: 37279650 Free PMC article.
-
MicroRNA-15a Regulates the Differentiation of Intramuscular Preadipocytes by Targeting ACAA1, ACOX1 and SCP2 in Chickens.Int J Mol Sci. 2019 Aug 20;20(16):4063. doi: 10.3390/ijms20164063. Int J Mol Sci. 2019. PMID: 31434294 Free PMC article.
-
The peroxisome proliferator activated receptors (PPARS) and their effects on lipid metabolism and adipocyte differentiation.Biochim Biophys Acta. 1996 Jul 26;1302(2):93-109. doi: 10.1016/0005-2760(96)00066-5. Biochim Biophys Acta. 1996. PMID: 8695669 Review.
Cited by
-
Identification of Scd5 as a functional regulator of visceral fat deposition and distribution.iScience. 2022 Feb 12;25(3):103916. doi: 10.1016/j.isci.2022.103916. eCollection 2022 Mar 18. iScience. 2022. PMID: 35252813 Free PMC article.
-
Whole Genome Scan Uncovers Candidate Genes Related to Milk Production Traits in Barka Cattle.Int J Mol Sci. 2024 Jun 2;25(11):6142. doi: 10.3390/ijms25116142. Int J Mol Sci. 2024. PMID: 38892330 Free PMC article.
-
Genetics of the phenotypic evolution in sheep: a molecular look at diversity-driving genes.Genet Sel Evol. 2022 Sep 9;54(1):61. doi: 10.1186/s12711-022-00753-3. Genet Sel Evol. 2022. PMID: 36085023 Free PMC article. Review.
-
CircRNA-5335 Regulates the Differentiation and Proliferation of Sheep Preadipocyte via the miR-125a-3p/STAT3 Pathway.Vet Sci. 2024 Feb 4;11(2):70. doi: 10.3390/vetsci11020070. Vet Sci. 2024. PMID: 38393088 Free PMC article.
-
Association analysis between Acetyl-Coenzyme A Acyltransferase-1 gene polymorphism and growth traits in Xiangsu pigs.Front Genet. 2024 May 2;15:1346903. doi: 10.3389/fgene.2024.1346903. eCollection 2024. Front Genet. 2024. PMID: 38756449 Free PMC article.
References
-
- Cao Y. (2017). Comparative Analysis of Whole Genome Methylation and Transcriptome of the Longissimus Dorsi Muscle of Du Han and Small–Tail Han Sheep. Changchun: Jilin University.
-
- Fang X. B. (2017). Identification and Functional Verification of Candidate Genes for Beef Quality Traits Based on Transcriptome and Genome-Wide Methylation Analysis. Changchun: Jilin University.
-
- Fu S., Zhao Y., Li Y., Li G., Chen Y., Li Z., et al. (2018). Characterization of miRNA transcriptome profiles related to breast muscle development and intramuscular fat deposition in chickens. J. Cell. Biochem. 119 7063–7079. - PubMed
LinkOut - more resources
Full Text Sources