. 2021 Jun 30;8(6):202192.
doi: 10.1098/rsos.202192. eCollection 2021 Jun.

The economic potential of metalliferous sub-volcanic brines

Affiliations

The economic potential of metalliferous sub-volcanic brines

Jon Blundy et al. R Soc Open Sci. .

Abstract

The transition to a low-carbon economy will increase demand for a wide range of metals, notably copper, which is used extensively in power generation and in electric vehicles. Increased demand will require new, sustainable approaches to copper exploration and extraction. Conventional copper mining entails energy-intensive extraction of relatively low-grade ore from large open pits or underground mines and subsequent ore refining. Most copper derives ultimately from hot, hydrous magmatic fluids. Ore formation involves phase separation of these fluids to form copper-rich hypersaline liquids (or 'brines') and subsequent precipitation of copper sulfides. Geophysical surveys of many volcanoes reveal electrically conductive bodies at around 2 km depth, consistent with lenses of brine hosted in porous rock. Building upon emerging concepts in crustal magmatism, we explore the potential of sub-volcanic brines as an in situ source of copper and other metals. Using hydrodynamic simulations, we show that 10 000 years of magma degassing can generate a Cu-rich brine lens containing up to 1.4 Mt Cu in a rock volume of a few km3 at approximately 2 km depth. Direct extraction of metal-rich brines represents a novel development in metal resource extraction that obviates the need for conventional mines, and generates geothermal power as a by-product.

Keywords: copper mining; geothermal energy; ore deposits; volcanoes.


Figures

Figure 1.
Figure 1.
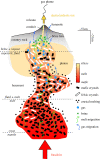
Schematic of a typical transcrustal magmatic system showing features described in the text. Note that proportion of melt and dimensions of crystals and bubbles are exaggerated for clarity. Ascent of melt (green arrows) and fluids (blue arrows) is decoupled, and may be either steady-state (percolative) or episodic. Crustal melting may occur in a thermal aureole around the magmatic system, as shown by black dots. Depths of the crust-mantle transition (Moho), volatile saturation and supercritical fluid phase-separation are denoted by horizontal dashed lines. Sub-volcanic brine lenses, the focus of this paper, occur at the shallow extremity of the system (pale green shading), created and sustained by fluid flow from the underlying system.
Figure 2.
Figure 2.
Phase relations in the system NaCl–H2O calculated using SOWAT [55]. Solid lines show isothermal projections of the solvus that describe coexisting hypersaline liquid (brine) and low-salinity vapour. Upon decompression a single-phase fluid of intermediate density will undergo phase separation when it encounters the solvus. The compositions of coexisting phases depend on pressure and temperature; the compositions of coexisting vapour and hypersaline liquid at 1100 bars and 700°C are shown for reference by the horizontal blue line. An illustrative supercritical magmatic input fluid with 4 wt% NaCleq (as used in the models) is shown by the vertical grey bar. The halite saturation field is delineated in red. Addition of CO2 to the NaCl–H2O system expands the solvus and extends the region of phase separation.
Figure 3.
Figure 3.
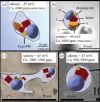
Three-dimensional phase maps of experimental and natural metal-bearing, hypersaline fluid inclusions used to estimate original copper contents. Maps were generated from photomicrographs of hypersaline liquid (L) inclusions from: (a) experiments [25]; (b) a porphyry copper deposit (Bajo de la Alumbrera; [85]); and the Kakkonda deep geothermal system (c, [84]; d, [83]). All inclusions show large halite daughter minerals due to high salinity, along with numerous opaque daughter sulfide minerals (Ccp, chalcopyrite; Mb, molybdenite; x and y are unidentified phases). Inclusions (a) and (b) come from systems with positive confirmation of chalcopyrite daughter minerals and known Cu contents. Pixel maps of the inclusions yield volume estimates for halite (red), sylvite (orange), and opaque daughter crystals along with total volume estimates based on assuming elliptical inclusion geometries and/or thicknesses given by vapour bubble (V) size and shape. Salinity estimates (expressed as wt% NaCleq) for all inclusions based on volume estimates roughly match those reported from fluid inclusion microthermometry. Estimates of the possible volume of chalcopyrite (yellow) (34% Cu) or Cu-bearing Fe-sulfide (brown) (approx. 3.5%) have been compared with total fluid mass in the inclusion to determine the range of Cu concentrations (given in ppm; table 1). For comparison, Cu concentrations from LA-ICPMS analyses of inclusions in (a) and (b) are given in square brackets (with 1 s.d. uncertainty in curved brackets), and are a reasonable match to the estimated Cu contents. No explicit measure of uncertainty is considered but large variations in inclusion thickness from those modelled would result in unrealistic deviations in estimates of inclusion salinity when compared with the measured values.
Figure 4.
Figure 4.
Photomicrographs of representative, quartz-hosted hypersaline (brine) fluid inclusions recovered from drill-core from Soufrière Hills volcano, Montserrat (left) and Larderello geothermal field, Italy (right). For sample details, including depths and well-bore temperatures, see table 1 and text. Brine inclusions in quartz were observed both along apparent crystal growth boundaries and as secondary fracture fill. The brine inclusions contain halite (and occasionally sylvite) daughter minerals and approximately 20–40 vol% vapour bubble. Opaque daughter minerals are readily identified in all but the lowest temperature inclusions trapped under halite-saturated conditions (−H). Some opaque minerals have a triangular shape, and are inferred to be chalcopyrite. Microthermometry data and LA-ICPMS analyses of these inclusions are given in table 1; histograms of microthermometric results are given in electronic supplementary material, figure S1.
Figure 5.
Figure 5.
Solubility of chalcopyrite (as ppm Cu in solution) in hydrothermal solutions as a function of temperature based on equation (10.3) for three representative salinities (4, 10 and 40 wt% NaCl). The figure is based on an empirical fit to solubility curves presented in Fig. 17e of Kouzmanov & Pokrovski [24] for pyrite–magnetite–haematite-saturated fluids with pH = 5 at 0.3 to 1 kbar pressure. Also shown are ranges of homogenization temperatures and Cu contents for brine inclusions from geothermal wells from Montserrat (SHV), Larderello and Kakkonda (data from table 1).
Figure 6.
Figure 6.
Porosity–depth relationships in volcanic-hosted geothermal reservoirs, and volcanic conduits. Geothermal well drill-core data (open and filled black symbols) are redrafted from Fig. 46.14 of Stimac et al. [71], and distinguish between dense (e.g. lavas, intrusives) and fragmental (breccias, tuffs, volcaniclastics) rock types. Blue line shows well-log data for the Unzen conduit taken from Fig. 2 of Ikeda et al. [109]. Red squares show porosities of individual drill-core rock samples from Kakkonda [111]; solid red line shows the depth-porosity relationship adopted in the Kakkonda reservoir model of McGuiness et al. [112]. In this model, porosity is set at a fixed value in a succession of horizontal layers, decreasing from 18.3% in the top layer to 8.5% in the bottom layer, based on the sonic and density log results of Kakkonda well WD-1 series and on an analysis of the electric logs of other Kakkonda wells reported by Sakagawa et al. [113]. The shaded box labelled Kakkonda MT is the range of calculated porosities for the approximately 3.7 km deep, 0.63 to 1.0 S m−1 conductor at Kakkonda [80], as calculated in the text. The boundary between the hydrothermal convective zone and thermal conductive zone in WD-1a well is located at approximately 3.2 km [79] and shown with the grey line. Purple dashed line is the depth-porosity relationship adopted in the brine-lens model of Afanasyev et al. [70].
Figure 7.
Figure 7.
Modelled distribution of salinity, Cu and temperature in the sub-volcanic region for the reference scenario of Afanaysev et al. [70] after 10 000 years of degassing in terms of (from left to right): (a) bulk fluid salinity expressed as molar fraction NaCleq; (b) concentration of dissolved Cu (as ppm Cu) for the no-sulfide case; (c) concentration of dissolved Cu (as ppm Cu) for the unlimited-sulfide case; (d) precipitated Cu for the unlimited-sulfide case, expressed as kg Cu per m3 of rock; and (e) temperature (°C). The conduit radius is 0.33 km, centred on the vertical axis; input flux of fluid (738°C, 4 wt% NaCleq, 700 ppm Cu) is 3 × 10⁹ kg yr−1 originating from 7 km depth. Black dots in all panels indicate halite precipitation. The volume containing hypersaline liquids with greater than 5000 ppm Cu is outlined in black in (b)–(d). Panels have identical vertical and horizontal scales, and are axisymmetric about the left-hand axis.
Figure 8.
Figure 8.
Time evolution (up to 10 000 years) of total mass of dissolved (orange line) and precipitated Cu (dark blue line) for unlimited-sulfide case, and dissolved Cu (pale blue line) for the no-sulfide case. Models are for the reference scenario in figure 7. The total Cu input to the modelled domain is 21 Mt. Copper masses are integrated across the reference volume defined in the text; there is very little stored Cu in the modelled domain beyond this volume. Note the tendency towards steady-state mass of dissolved Cu after 10 000 years.

References

    1. Schipper BW, Lin HC, Meloni MA, Wansleeben K, Heijungs R, van der Voet E. 2018. Estimating global copper demand until 2100 with regression and stock dynamics. Resour. Conserv. Recycl. 132, 28-36. (10.1016/j.resconrec.2018.01.004) - DOI
    1. Valenta RK, Kemp D, Owen JR, Corder GD, Lèbre É. 2019. Re-thinking complex orebodies: consequences for the future world supply of copper. J. Cleaner Prod. 220, 816-826. (10.1016/j.jclepro.2019.02.146) - DOI
    1. Grandell L, Lehtilä A, Kivinen M, Koljonen T, Kihlman S, Lauri LS. 2016. Role of critical metals in the future markets of clean energy technologies. Renew. Energy 95, 53-62. (10.1016/j.renene.2016.03.102) - DOI
    1. Edmonds M, Mather TA, Liu EJ. 2018. A distinct metal fingerprint in arc volcanic emissions. Nat. Geosci. 11, 790. (10.1038/s41561-018-0214-5) - DOI
    1. Hedenquist JW, Lowenstern JB. 1994. The role of magmas in the formation of hydrothermal ore deposits. Nature 370, 519-527. (10.1038/370519a0) - DOI

LinkOut - more resources