. 2021 Jun 10;24(7):102712.
doi: 10.1016/j.isci.2021.102712. eCollection 2021 Jul 23.

Skeletal muscle proteomes reveal downregulation of mitochondrial proteins in transition from prediabetes into type 2 diabetes

Affiliations

Skeletal muscle proteomes reveal downregulation of mitochondrial proteins in transition from prediabetes into type 2 diabetes

Tiina Öhman et al. iScience. .

Abstract

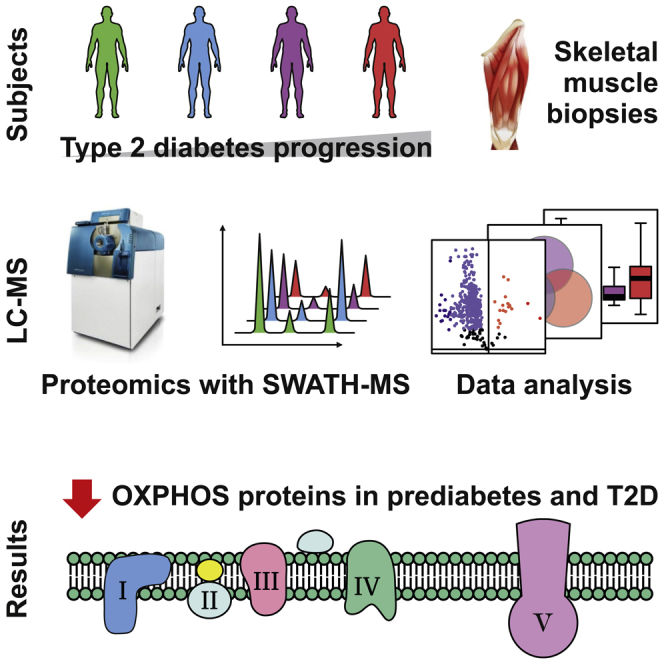
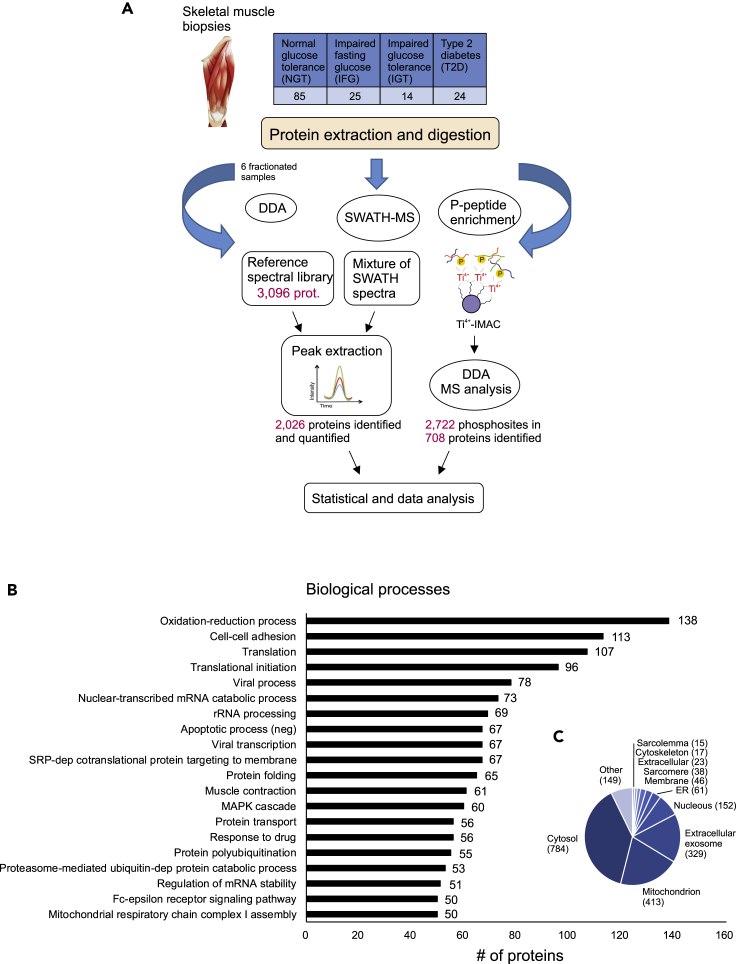
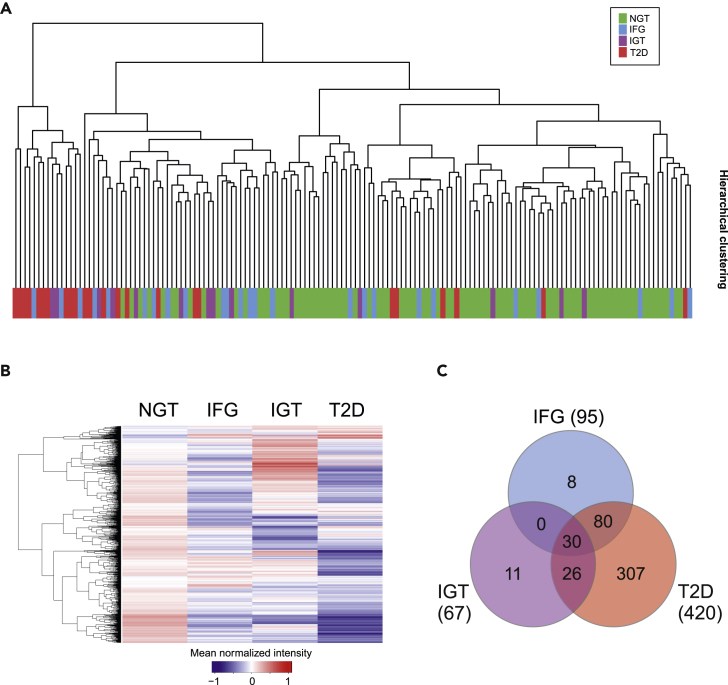
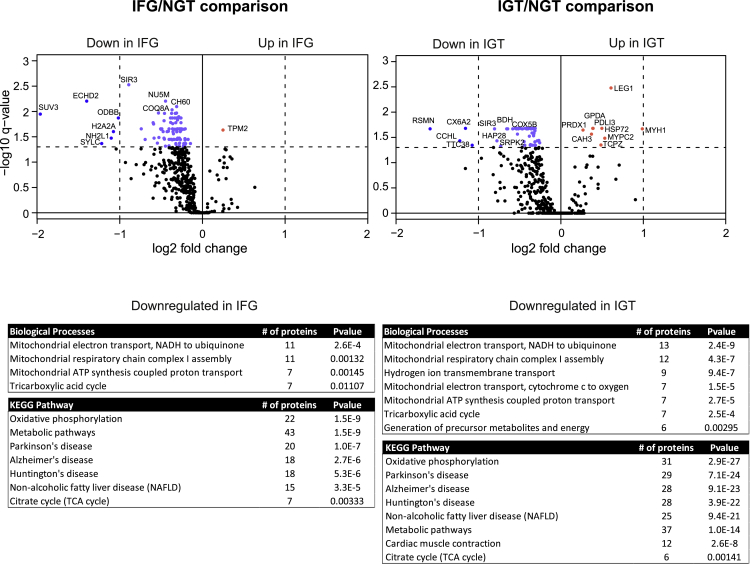
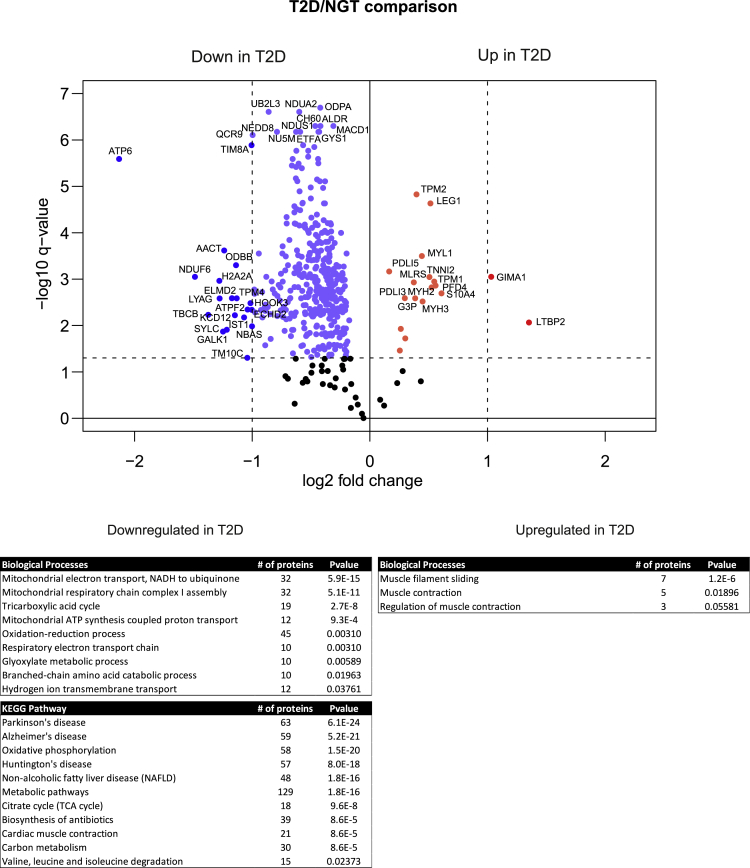
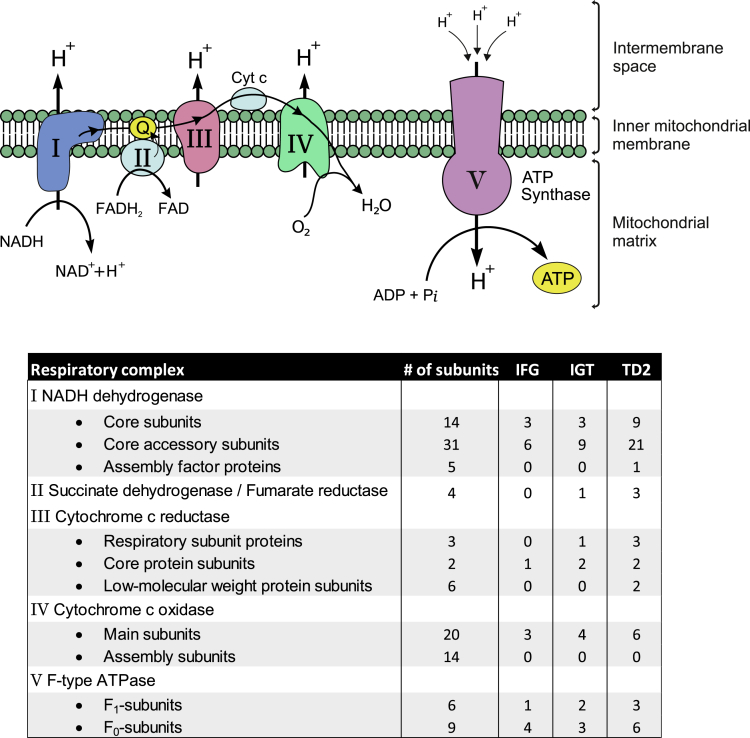
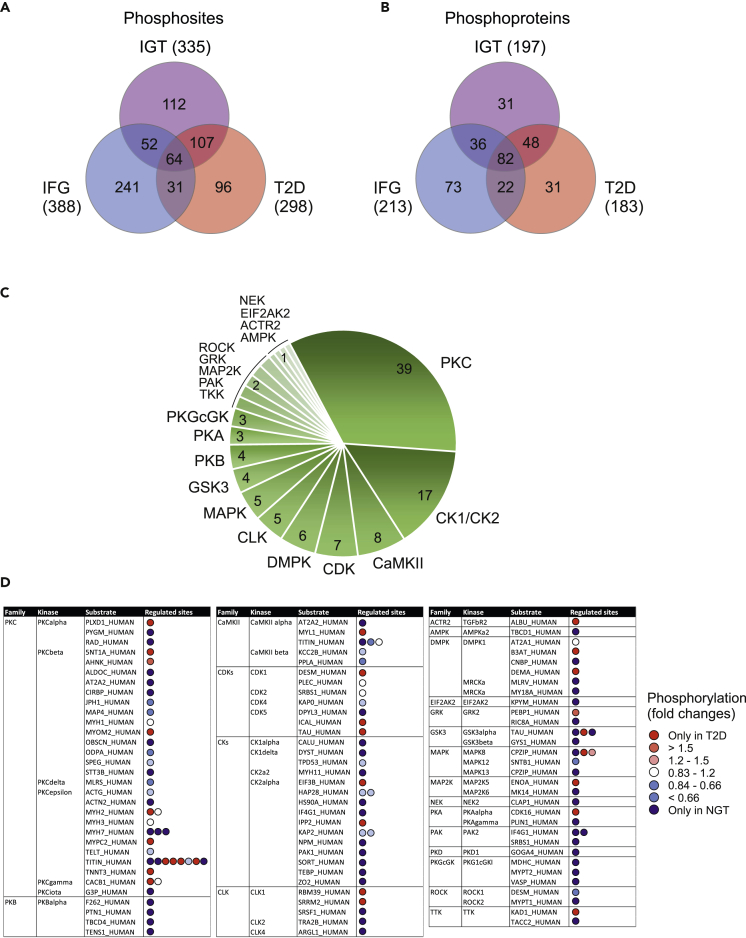
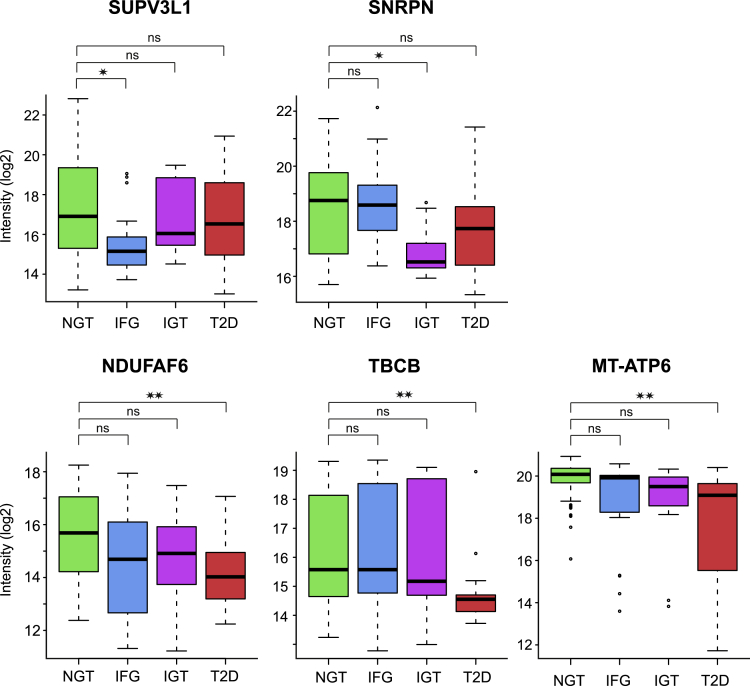
Skeletal muscle insulin resistance is a central defect in the pathogenesis of type 2 diabetes (T2D). Here, we analyzed skeletal muscle proteome in 148 vastus lateralis muscle biopsies obtained from men covering all glucose tolerance phenotypes: normal, impaired fasting glucose (IFG), impaired glucose tolerance (IGT) and T2D. Skeletal muscle proteome was analyzed by a sequential window acquisition of all theoretical mass spectra (SWATH-MS) proteomics technique. Our data indicate a downregulation in several proteins involved in mitochondrial electron transport or respiratory chain complex assembly already in IFG and IGT muscles, with most profound decreases observed in T2D. Additional phosphoproteomic analysis reveals altered phosphorylation in several signaling pathways in IFG, IGT, and T2D muscles, including those regulating glucose metabolic processes, and the structure of muscle cells. These data reveal several alterations present in skeletal muscle already in prediabetes and highlight impaired mitochondrial energy metabolism in the trajectory from prediabetes into T2D.

Keywords: Diabetology; Molecular biology; Proteomics.


Conflict of interest statement

The authors declare no competing interests.

Figures

None
Graphical abstract
Figure 1
Figure 1
Quantitative SWATH-MS analysis of human muscle samples (A) Muscle biopsies were collected from 148 men whose glucose tolerance covered all phenotypes from normal to type 2 diabetes. Muscle proteins were extracted and digested with trypsin. For spectral library generation, the resulting peptides were fractionated and analyzed using data-dependent acquisition mode (DDA). The spectral library built was then used to extract the peptide and the quantification information of the SWATH runs. In addition, six samples from each glucose tolerance group were subjected to phosphopeptide analysis. Statistical analysis and bioinformatics approaches were used to understand the biological relevance of the differentially expressed proteins. (B and C) (B) The DAVID bioinformatics tool was used to classify all 2,026 identified proteins as per their biological processes and to predict cellular location (C).
Figure 2
Figure 2
Changes in skeletal muscle proteome in different glucose tolerance phenotypes (A) Hierarchical clustering of all quantified proteins based on the abundance of the proteome profile. (B) In the Z-score heatmap the expression levels of all 2,026 quantified proteins are shown as the mean of the SWATH peak area for each sample group. (C) Venn diagrams showing the overlap between significantly different proteins in IFG, IGT, and T2D proteomes compared with NGT proteome. The number in brackets indicates how many proteins were significantly altered (q < 0.05) in each sample group.
Figure 3
Figure 3
Comparison between prediabetes and NGT proteomes The volcano plots of differentially expressed muscle proteins between IFG and NGT (left panel) or IGT and NGT (right panel). p-value was set to match q-value < 0.05. The light blue dots indicate significantly down-regulated proteins with FC < 2, and the blue dots with FC > 2. The red dots indicate significantly up-regulated proteins. Down-regulated proteins in the prediabetes samples were categorized according to their biological processes and KEGG pathways using DAVID bioinformatics tool. The most significant events are listed with Benjamini corrected p-value.
Figure 4
Figure 4
Comparison between type 2 diabetes and NGT proteomes The volcano plots of differentially expressed muscle proteins between T2D and NGT. p-value was set to match q-value < 0.05. The light blue dots indicate significantly down-regulated proteins with FC < 2 and the blue dots with FC > 2. The red dots indicate significantly upregulated proteins. Downregulated and upregulated proteins in the T2D samples were categorized as per their biological processes and KEGG pathways using DAVID bioinformatics tool. The most significant events are listed with Benjamini corrected p-value.
Figure 5
Figure 5
Oxidative phosphorylation is downregulated in skeletal muscle in prediabetes and type 2 diabetes The oxidative phosphorylation system (OXPHOS) of the mitochondrial inner membrane is composed of five enzymes (respiratory complexes I–V). All respiratory enzymes consist of several subunits (the total number of subunits shown in the table), and we observed a decrease in most subunits already in prediabetes (IFG, IGT). Number of proteins with significant differences compared with NGT for each sample group is shown in the table.
Figure 6
Figure 6
Phosphorylation in skeletal muscle proteome (A and B) Venn diagram representing the number of phosphosites (A) or phosphoproteins (B) with a significant change in abundance (p-value < 0.05, or observed only in another condition) in the IFG, IGT and T2D sample groups compared with NGT. (C) NetworKIN software was used to predict kinases that are dysregulated in type 2 diabetes. 298 phosphorylated sites that exhibited an alteration in abundance in T2D samples were used as input. A total of 20 distinct kinase families associated with 115 phosphorylated sites was predicted. The numbers indicate the total number of phosphorylation sites linked to the specific kinases. (D) The more specific details about NetworKIN predicted kinase substrates. All the substrates listed here have significant differences between T2D and NGT samples. Red spot means that the substrate is phosphorylated more in T2D samples, indicating more active kinases in T2D. Blue spot indicates more active kinase in NGT samples (more phosphorylation in NGT samples). Some substrate proteins have multiple regulated phosphorylation sites (in sequence order in the figure). Phosphosites are indicated in Table S3.
Figure 7
Figure 7
Unique differentially expressed proteins Box-and-whisker plots of differentially expressed individual proteins that displayed a significantly different abundance (q < 0.05) in the prediabetic or T2D samples compared with the NGT samples. Box-and-whisker plots indicate median and interquartile range; the whiskers extend to the most extreme data point which is no more than 1.5 times the interquartile range from the box. ATP-dependent RNA helicase SUPV3L1 protein expression was uniquely reduced in IFG muscles. Small nuclear ribonucleoprotein-associated protein N (SNRPN) expression was uniquely downregulated in IGT muscles. ATP synthase subunit a (MT-ATP6), NADH dehydrogenase (ubiquinone) complex I, assembly factor 6 (NDUFAF6) and tubulin-folding cofactor B (TBCB) were significantly downregulated only in T2D muscles. ∗ = q < 0.05; ∗∗ = q < 0.01, ns = nonsignificant differences, one-way ANOVA followed by Dunnett's post hoc test with the NGT group as the reference group.

References

    1. American Diabetes Association Improving care and promoting health in populations: standards of medical care in diabetes—2018. Diabetes Care. 2018;41:S7–S12. - PubMed
    1. Batista T.M., Jayavelu A.K., Wewer Albrechtsen N.J., Iovino S., Lebastchi J., Pan H., Dreyfuss J.M., Krook A., Zierath J.R., Mann M., Kahn C.R. A cell-autonomous signature of dysregulated protein phosphorylation underlies muscle insulin resistance in type 2 diabetes. Cell Metab. 2020;32:844–859.e5. - PMC - PubMed
    1. Chae S., Kim S.-J., Do Koo Y., Lee J.H., Kim H., Ahn B.Y., Ha Y.-C., Kim Y.-H., Jang M.G., Koo K.-H. A mitochondrial proteome profile indicative of type 2 diabetes mellitus in skeletal muscles. Exp. Mol. Med. 2018;50:129. - PMC - PubMed
    1. Cline G.W., Petersen K.F., Krssak M., Shen J., Hundal R.S., Trajanoski Z., Inzucchi S., Dresner A., Rothman D.L., Shulman G.I. Impaired glucose transport as a cause of decreased insulin-stimulated muscle glycogen synthesis in type 2 diabetes. N. Engl. J. Med. 1999;341:240–246. - PubMed
    1. Cox J., Mann M. MaxQuant enables high peptide identification rates, individualized p.p.b.-range mass accuracies and proteome-wide protein quantification. Nat. Biotechnol. 2008;26:1367–1372. - PubMed

LinkOut - more resources