The International Workshop on Osteoarthritis Imaging Knee MRI Segmentation Challenge: A Multi-Institute Evaluation and Analysis Framework on a Standardized Dataset
- PMID: 34235438
- PMCID: PMC8231759
- DOI: 10.1148/ryai.2021200078
The International Workshop on Osteoarthritis Imaging Knee MRI Segmentation Challenge: A Multi-Institute Evaluation and Analysis Framework on a Standardized Dataset
Abstract
Purpose: To organize a multi-institute knee MRI segmentation challenge for characterizing the semantic and clinical efficacy of automatic segmentation methods relevant for monitoring osteoarthritis progression.
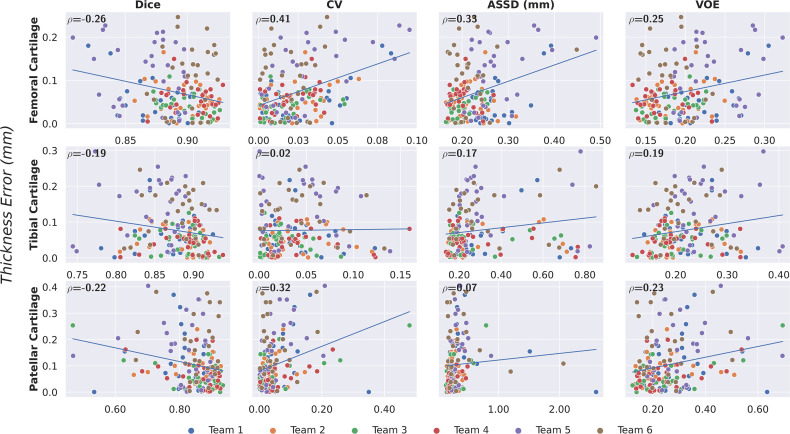
Materials and methods: A dataset partition consisting of three-dimensional knee MRI from 88 retrospective patients at two time points (baseline and 1-year follow-up) with ground truth articular (femoral, tibial, and patellar) cartilage and meniscus segmentations was standardized. Challenge submissions and a majority-vote ensemble were evaluated against ground truth segmentations using Dice score, average symmetric surface distance, volumetric overlap error, and coefficient of variation on a holdout test set. Similarities in automated segmentations were measured using pairwise Dice coefficient correlations. Articular cartilage thickness was computed longitudinally and with scans. Correlation between thickness error and segmentation metrics was measured using the Pearson correlation coefficient. Two empirical upper bounds for ensemble performance were computed using combinations of model outputs that consolidated true positives and true negatives.
Results: Six teams (T 1-T 6) submitted entries for the challenge. No differences were observed across any segmentation metrics for any tissues (P = .99) among the four top-performing networks (T 2, T 3, T 4, T 6). Dice coefficient correlations between network pairs were high (> 0.85). Per-scan thickness errors were negligible among networks T 1-T 4 (P = .99), and longitudinal changes showed minimal bias (< 0.03 mm). Low correlations (ρ < 0.41) were observed between segmentation metrics and thickness error. The majority-vote ensemble was comparable to top-performing networks (P = .99). Empirical upper-bound performances were similar for both combinations (P = .99).
Conclusion: Diverse networks learned to segment the knee similarly, where high segmentation accuracy did not correlate with cartilage thickness accuracy and voting ensembles did not exceed individual network performance.See also the commentary by Elhalawani and Mak in this issue.Keywords: Cartilage, Knee, MR-Imaging, Segmentation © RSNA, 2020Supplemental material is available for this article.
2021 by the Radiological Society of North America, Inc.
Conflict of interest statement
Disclosures of Conflicts of Interest: A.D.D. Activities related to the present article: grants and travel support from the National Science Foundation, the National Institute of Arthritis and Musculoskeletal and Skin Diseases, the National Institute of Biomedical Imaging and Bioengineering, GE Healthcare, and Philips. Activities not related to the present article: grants from the National Institutes of Health. Other relationships: disclosed no relevant relationships. F.C. disclosed no relevant relationships. C. Iriondo disclosed no relevant relationships. A.M. disclosed no relevant relationships. S.J. disclosed no relevant relationships. U.B. disclosed no relevant relationships. M.P. Activities related to the present article: grant from the Independent Research Fund Denmark. Activities not related to the present article: disclosed no relevant relationships. Other relationships: disclosed no relevant relationships. C. Igel Activities related to the present article: grant from the Danish Council for Independent Research. Activities not related to the present article: disclosed no relevant relationships. Other relationships: disclosed no relevant relationships. E.B.D. Activities related to the present article: disclosed no relevant relationships. Activities not related to the present article: stockholder in Biomediq and Cerebriu. Other relationships: disclosed no relevant relationships. S.G. disclosed no relevant relationships. M.Y. disclosed no relevant relationships. X.L. disclosed no relevant relationships. C.M.D. Activities related to the present article: grant from the National Institute of Arthritis and Musculoskeletal and Skin Diseases. Activities not related to the present article: disclosed no relevant relationships. Other relationships: disclosed no relevant relationships. V.J. disclosed no relevant relationships. R.R. disclosed no relevant relationships. G.E.G. Activities related to the present article: grants from the National Institutes of Health. Activities not related to the present article: board member for HeartVista; consultant for Canon; grants from GE Healthcare. Other relationships: disclosed no relevant relationships. B.A.H. Activities related to the present article: grant from the National Institutes of Health. Activities not related to the present article: royalties from patents licensed by Siemens and GE Healthcare; stockholder in LVIS. Other relationships: disclosed no relevant relationships. V.P. disclosed no relevant relationships. A.S.C. Activities related to the present article: grants from the National Institutes of Health, GE Healthcare, and Philips. Activities not related to the present article: board member for BrainKey and Chondrometrics; consultant for Skope, Subtle Medical, Chondrometrics, Image Analysis Group, Edge Analytics, ICM, and Culvert Engineering; stockholder in Subtle Medical, LVIS, and BrainKey; travel support from Paracelsus Medical Private University. Other relationships: disclosed no relevant relationships.
Figures
![Bland-Altman plots for, A, femoral, B, tibial, and, C, patellar
cartilage thickness differences (per scan, Kellgren-Lawrence [KL]
osteoarthritis grade computed at baseline) and, D–F, longitudinal
thickness change (per patient, Kellgren-Lawrence osteoarthritis grade
2–4 at time point 1) for the six networks, compared with the ground
truth. Positive difference values (y-axis) indicate overestimation of
thickness or longitudinal thickness change. Negligible bias (dotted gray
line) was observed for all three tissues among all networks for both
metrics. The 95% limits of error (LoE) (between dashed gray lines) were
broader for cross-sectional thickness difference than longitudinal
differences. The LoE were relatively small for, D, femoral cartilage and, E,
tibial cartilage compared with, F, patellar cartilage, indicating better
longitudinal estimates. There was no systematic trend in networks
underestimating or overestimating longitudinal thickness changes.](https://cdn.ncbi.nlm.nih.gov/pmc/blobs/a15e/8231759/9ca88dde60d4/ryai.2021200078fig5.jpg)
References
-
- Cross M, Smith E, Hoy D, et al. . The global burden of hip and knee osteoarthritis: estimates from the global burden of disease 2010 study. Ann Rheum Dis 2014;73(7):1323–1330. - PubMed
-
- Chaudhari AS, Sandino CM, Cole EK, et al. . Prospective Deployment of Deep Learning in MRI: A Framework for Important Considerations, Challenges, and Recommendations for Best Practices. J Magn Reson Imaging 2020. 10.1002/jmri.27331. Published online August 24, 2020. Accessed September 20, 2020. - DOI - PMC - PubMed
-
- Heimann T, Morrison BJ, Styner MA, Niethammer M, Warfield S. Segmentation of knee images: a grand challenge. In: MICCAI Workshop on Medical Image Analysis for the Clinic: A Grand Challenge, 2010; 207–214. http://www.ski10.org/ski10.pdf.
-
- Draper CE, Besier TF, Gold GE, et al. . Is cartilage thickness different in young subjects with and without patellofemoral pain?. Osteoarthritis Cartilage 2006;14(9):931–937. - PubMed