. 2021 Jul 8;6(13):e141760.
doi: 10.1172/jci.insight.141760.

Ferritin H deficiency deteriorates cellular iron handling and worsens Salmonella typhimurium infection by triggering hyperinflammation

Affiliations

Ferritin H deficiency deteriorates cellular iron handling and worsens Salmonella typhimurium infection by triggering hyperinflammation

David Haschka et al. JCI Insight. .

Abstract

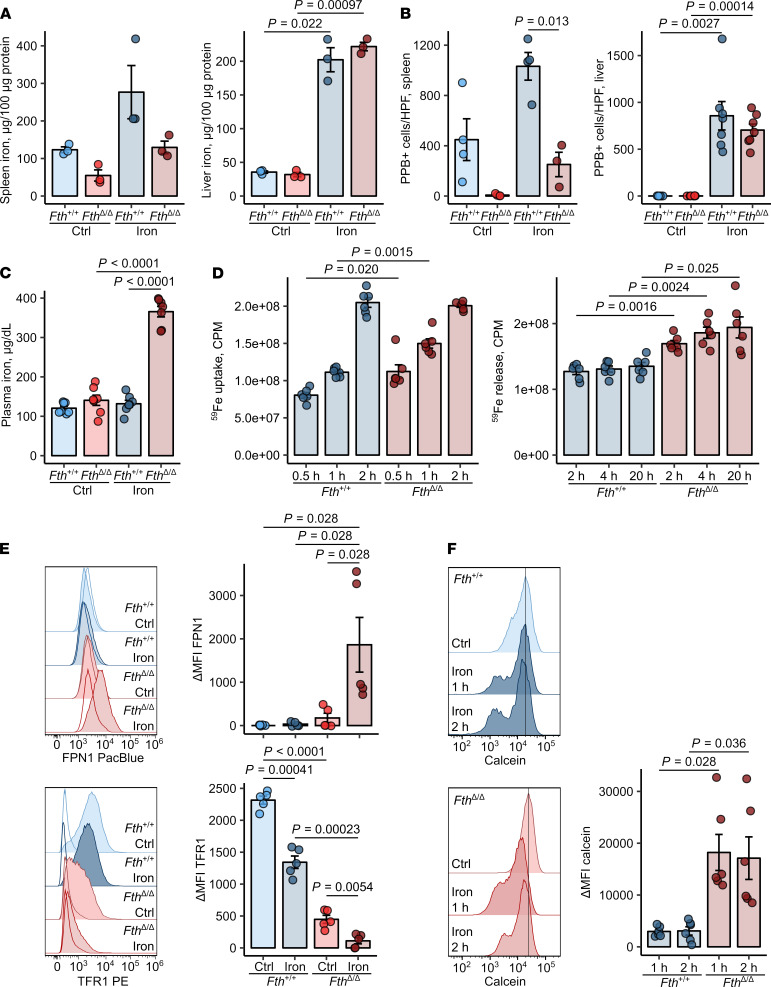
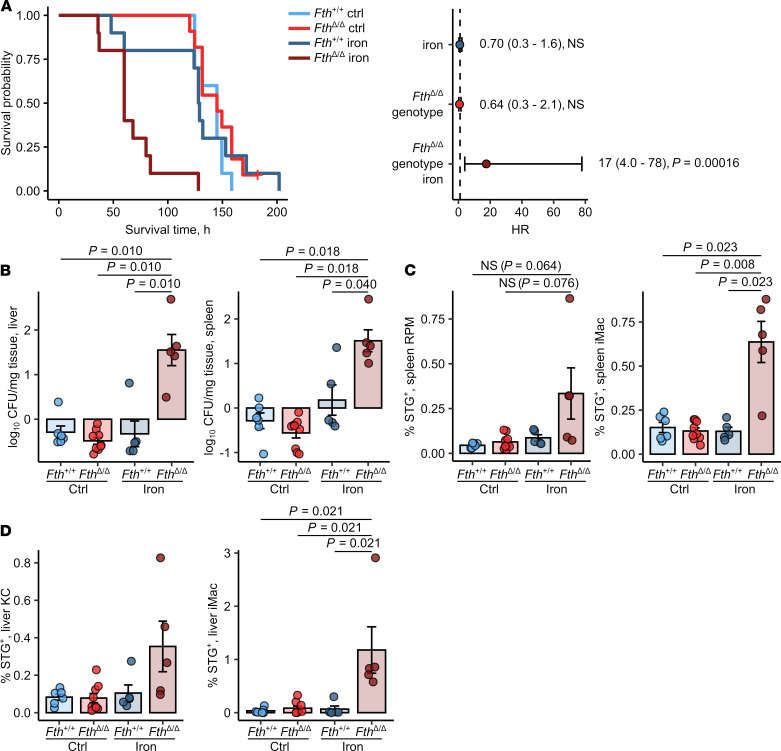
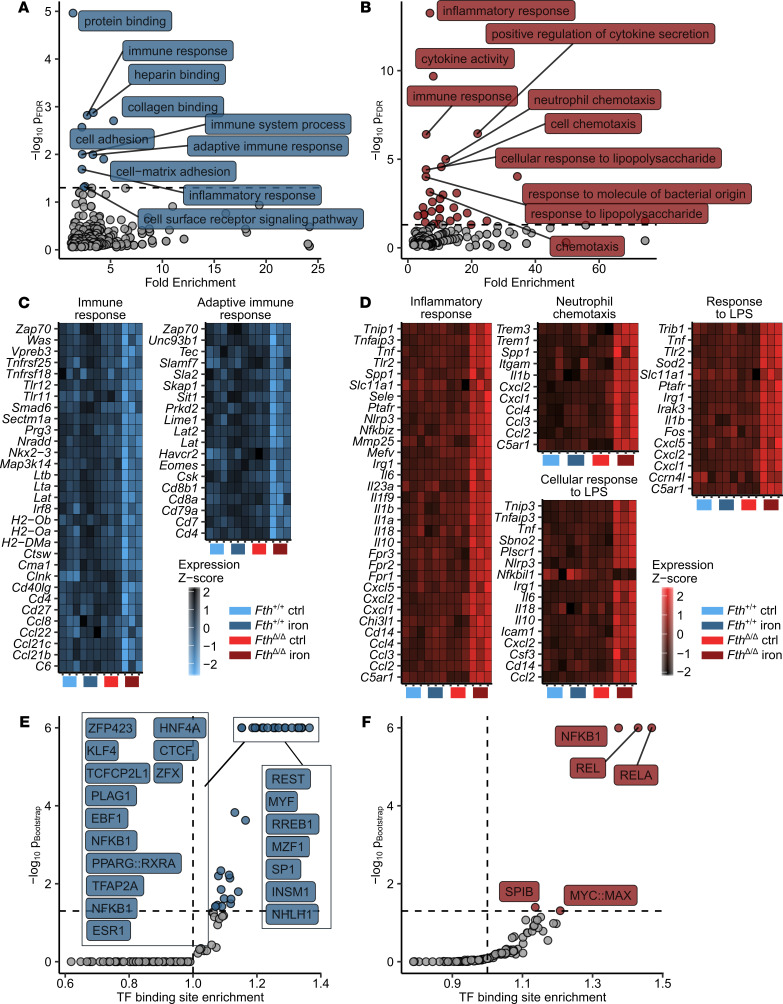
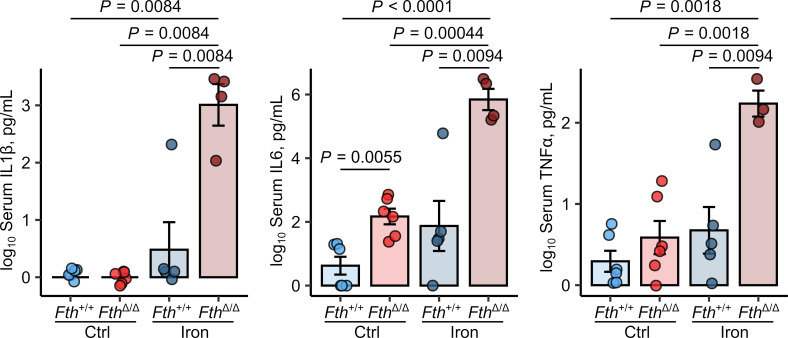
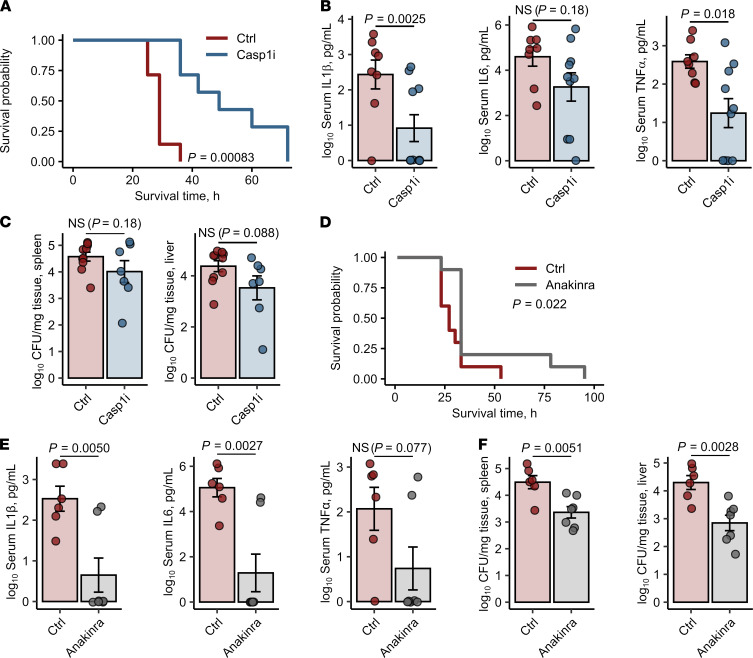
Iron is an essential nutrient for mammals as well as for pathogens. Inflammation-driven changes in systemic and cellular iron homeostasis are central for host-mediated antimicrobial strategies. Here, we studied the role of the iron storage protein ferritin H (FTH) for the control of infections with the intracellular pathogen Salmonella enterica serovar Typhimurium by macrophages. Mice lacking FTH in the myeloid lineage (LysM-Cre+/+Fthfl/fl mice) displayed impaired iron storage capacities in the tissue leukocyte compartment, increased levels of labile iron in macrophages, and an accelerated macrophage-mediated iron turnover. While under steady-state conditions, LysM-Cre+/+Fth+/+ and LysM-Cre+/+Fthfl/fl animals showed comparable susceptibility to Salmonella infection, i.v. iron supplementation drastically shortened survival of LysM-Cre+/+Fthfl/fl mice. Mechanistically, these animals displayed increased bacterial burden, which contributed to uncontrolled triggering of NF-κB and inflammasome signaling and development of cytokine storm and death. Importantly, pharmacologic inhibition of the inflammasome and IL-1β pathways reduced cytokine levels and mortality and partly restored infection control in iron-treated ferritin-deficient mice. These findings uncover incompletely characterized roles of ferritin and cellular iron turnover in myeloid cells in controlling bacterial spread and for modulating NF-κB and inflammasome-mediated cytokine activation, which may be of vital importance in iron-overloaded individuals suffering from severe infections and sepsis.

Keywords: Bacterial infections; Immunology; Infectious disease; Innate immunity.


Conflict of interest statement

Conflict of interest: The authors have declared that no conflict of interest exists.

Figures

Figure 1
Figure 1. Fth deletion in myeloid cells increases cellular labile iron pool and iron turnover in macrophages.
(A–C) Fthfl/fl (Fth+/+) and LysM-Cre Fthfl/fl (FthΔ/Δ) mice were injected i.v. with iron isomaltoside (2 mg elementary Fe/mouse) or left untreated and analyzed 3 days later. (A) Nonheme iron content of the spleen and liver (n = 3 per group). (B) Counts of splenic and hepatic PPB-positive macrophages. Each point denotes mean from at least 3 high-power fields (HPFs) per animal (spleen: Fth+/+ ctrl, Fth+/+ iron, FthΔ/Δ ctrl — n = 4, FthΔ/Δ iron —n = 3; liver: n = 7 per group). (C) Nonheme iron concentrations in serum (n = 7 per group). (D) Iron uptake and release from Fth+/+ and FthΔ/Δ bone marrow–derived macrophages (BMDMs). Iron uptake was measured in cultures stimulated with 5 μM 59Fe3+ (in form of FeCl3) for the indicated time points. Iron release from BMDMs loaded with 5 μM 59Fe3+ into culture supernatant was determined at the indicated time points (uptake and release: n = 6 per group). (E) Surface expression of FPN1 and TFR1 in Fth+/+ and FthΔ/Δ BMDMs cultivated with/without 10 μM Fe3+ (FeCl3) for 12 hours was measured by flow cytometry (n = 5 per group). (F) Calcein-stained Fth+/+ and FthΔ/Δ BMDMs were stimulated with 50 μM Fe3+ (FeCl3) for the indicated time points. Calcein fluorescence expressed as ΔMFI was determined by flow cytometry. Each point denotes single observation (A and CF) or a mean from at least 3 HPFs per animal (B). Bars with whiskers represent mean ± SEM. Statistical significance was assessed with 2-way ANOVA (AC and E), Kruskal-Wallis test (E, FPN1), or repeated-measures 2-way ANOVA (E, TFR1 data, and F) with Benjamini-Hochberg-corrected 2-tailed post hoc t tests (A–F) or Mann-Whitney U tests (E, FPN1). In the plots, post-hoc test P values are indicated.
Figure 2
Figure 2. Loss of FTH in myeloid cells increases susceptibility of iron-loaded mice to Salmonella infection.
Fthfl/fl (Fth+/+) and LysM-Cre Fthfl/fl (FthΔ/Δ) mice were i.v. administered PBS or iron isomaltoside (2 mg elementary Fe per animal) and infected 3 days later with 500 CFU GFP-expressing S. Typhimurium (STG). (A) Surviving fractions of control and iron-loaded Fth+/+ and FthΔ/Δ mice as a function of time after infection (Fth+/+ ctrl, Fth+/+ iron, FthΔ/Δ iron: n = 11, FthΔ/Δ ctrl: n = 10). The forest plots show results of Cox proportional hazard modeling of the data (HR, hazard ratio). (B) The number of GFP-expressing bacteria in the spleen and liver determined by flow cytometry of organ lysates 20 hours after infection (Fth+/+ ctrl: n = 6, Fth+/+ iron: n = 5, FthΔ/Δ ctrl: n = 9, FthΔ/Δ iron: n = 5). (C and D) Bacterial colonization of spleen red-pulp (RPM) and inflammatory macrophages (iMacs) (C) and of liver Kupffer cells (KCs) and iMac (D) 20 hours after was measured by flow cytometry and expressed as percent of STG-positive cells within the parent population (Fth+/+ ctrl: n = 6, Fth+/+ iron: n = 5, FthΔ/Δ ctrl: n = 9, FthΔ/Δ iron: n = 5). In A, data are presented as Kaplan-Meier plot and forest plot with points representing Cox regression estimates and whiskers depicting 95% CI for the estimates. In the other panels, each point denotes a single animal; bars with whiskers represent mean ± SEM. In A, statistical significance was assessed with Cox proportional hazard modeling for genotype, iron, and genotype: iron interaction terms, points in the forest plot are labeled with estimate values, 95% CI and P values. In other panels, statistical significance was assessed with Kruskal-Wallis test and with Benjamini-Hochberg-corrected Mann-Whitney U tests. In the plots, post hoc test P values are indicated.
Figure 3
Figure 3. S. Typhimurium triggers unrestrained expression of proinflammatory NF-κB targets in iron-loaded FthΔ/Δ mice.
Fthfl/fl (Fth+/+) and LysM-Cre Fthfl/fl (FthΔ/Δ) mice were i.v. administered PBS or iron isomaltoside (2 mg elementary Fe per animal) and infected 3 days later with 500 CFU GFP-expressing S. Typhimurium (STG) (n = 3 mice per group). Twelve hours after infection, total spleen RNA was isolated and subjected to a whole transcriptome measurement with gene microarrays. Genes significantly downregulated (PANOVA iron/genotype < 0.05 and estimateiron/genotype < -1.5, n = 893 genes) and upregulated (PANOVA iron/genotype < 0.05 and estimateiron/genotype > 1.5, n = 271 genes) were identified by 2-way ANOVA and linear regression as described in Methods and Supplemental Figure 5. For a list of significant genes with ANOVA P values and regression estimates, see Supplemental Table 1. (A and B) GO term enrichment analysis for genes significantly downregulated (A) and upregulated (B) by the iron/genotype interaction. Significant GO terms are highlighted in blue and red, respectively (downregulated genes: n = 10 significant GO terms, upregulated genes: n = 31 significant GO terms), 10 most significantly enriched GO terms are labeled with their names. For full results of GO term enrichment analysis, see Supplemental Tables 2 and 3. (C and D) Heatmap representation of normalized gene expression values (z score) for genes assigned to selected significantly enriched GO terms. (C) Significantly downregulated genes.(D) Significantly upregulated genes. Color scale corresponds to normalized expression. (E and F) Transcription factor (TF) binding site enrichment analysis for genes significantly downregulated (E) and upregulated (F) by the iron/genotype interaction. For each TF-binding motif, the Benjamini-Hochberg-corrected P value and fold enrichment are plotted. Significant TF-binding motifs are highlighted in blue and red (downregulated genes: n = 35, upregulated genes: n = 5 significant TF binding motifs), 10 most significantly enriched TF-binding motifs are labeled with their names.
Figure 4
Figure 4. S. Typhimurium elicits unbraked cytokine and cellular innate response in iron-loaded FthΔ/Δ mice.
Fthfl/fl (Fth+/+) and LysM-Cre Fthfl/fl (FthΔ/Δ) mice were i.v. administered PBS or iron isomaltoside (2 mg elementary Fe per animal) and infected 3 days later with 500 CFU GFP-expressing S. Typhimurium (STG). The animals were analyzed 20 hours after infection. Serum levels of IL-1β, IL-6, and TNF-α were measured by ELISA (Fth+/+ ctrl: n = 6, Fth+/+ iron: n = 5, FthΔ/Δ ctrl: n = 6, FthΔ/Δ iron: n = 4). Each point denotes single animal; bars with whiskers represent mean ± SEM. Statistical significance was assessed with 2-way ANOVA with Benjamini-Hochberg-corrected 2-tailed post hoc t tests. In the plots, post hoc test P values are indicated.
Figure 5
Figure 5. Inhibition of the inflammasome/IL-1β pathway prevents the S. Typhimurium–induced cytokine storm in iron-loaded FthΔ/Δ mice.
FthΔ/Δ mice were i.v. administered iron isomaltoside (2 mg elementary Fe per animal) and infected 3 days later with 500 CFU GFP-expressing S. Typhimurium (STG). Mice were i.p. injected with the caspase-1 inhibitor Ac-YVAD-cmk (Casp1i, 8 mg/kg, 1 hour after infection, A–C) or the IL-1β receptor antagonist anakinra (25 mg/kg, 3 hours after infection, D–F). The treatment with Ac-YVAD-cmk or anakinra was repeated in 12-hour intervals. Control mice were administered PBS. (A) Surviving animal fractions as a function of time (n = 7 mice per group). (B) Serum levels of IL-1β, IL-6, and TNF-α measured by ELISA 20 hours after infection (Ctrl: n = 10, Casp1i: n = 7). (C) Bacterial burden of the spleen and liver determined by plating of organ lysates (Ctrl: n = 10, Casp1i: n = 7). (D) Surviving animal fractions as a function of time (n = 10 mice per group). (E) Serum levels of IL-1β, IL-6, and TNF-α measured by ELISA 20 hours after infection (n = 7 per group). (F) Bacterial burden of the spleen and liver was determined by plating of organ lysates 20 hours after infection (n = 7 per group). In A and D, data are presented as Kaplan-Meier plots. In other panels, each point denotes single animal, and bars with whiskers represent mean ± SEM. In A and D, statistical significance was assessed with Wilcoxon test. In the other panels, statistical significance was assessed with 2-tailed t test. In the plots, Wilcoxon and t test P value are indicated.

References

    1. Muckenthaler MU, et al. A red carpet for iron metabolism. Cell. 2017;168(3):344–361. doi: 10.1016/j.cell.2016.12.034. - DOI - PMC - PubMed
    1. Koskenkorva-Frank TS, et al. The complex interplay of iron metabolism, reactive oxygen species, and reactive nitrogen species: insights into the potential of various iron therapies to induce oxidative and nitrosative stress. Free Radic Biol Med. 2013;65:1174–1194. doi: 10.1016/j.freeradbiomed.2013.09.001. - DOI - PubMed
    1. Nairz M, et al. Iron and innate antimicrobial immunity-Depriving the pathogen, defending the host. J Trace Elem Med Biol. 2018;48:118–133. doi: 10.1016/j.jtemb.2018.03.007. - DOI - PubMed
    1. Weinberg ED. Nutritional immunity. Host’s attempt to withold iron from microbial invaders. JAMA. 1975;231(1):39–41. - PubMed
    1. Soares MP, Weiss G. The Iron age of host-microbe interactions. EMBO Rep. 2015;16(11):1482–1500. doi: 10.15252/embr.201540558. - DOI - PMC - PubMed

Publication types

MeSH terms