. 2021 Aug 6;20(8):4203-4211.
doi: 10.1021/acs.jproteome.1c00446. Epub 2021 Jul 8.

Ultrafast and Reproducible Proteomics from Small Amounts of Heart Tissue Enabled by Azo and timsTOF Pro

Affiliations

Ultrafast and Reproducible Proteomics from Small Amounts of Heart Tissue Enabled by Azo and timsTOF Pro

Timothy J Aballo et al. J Proteome Res. .

Abstract

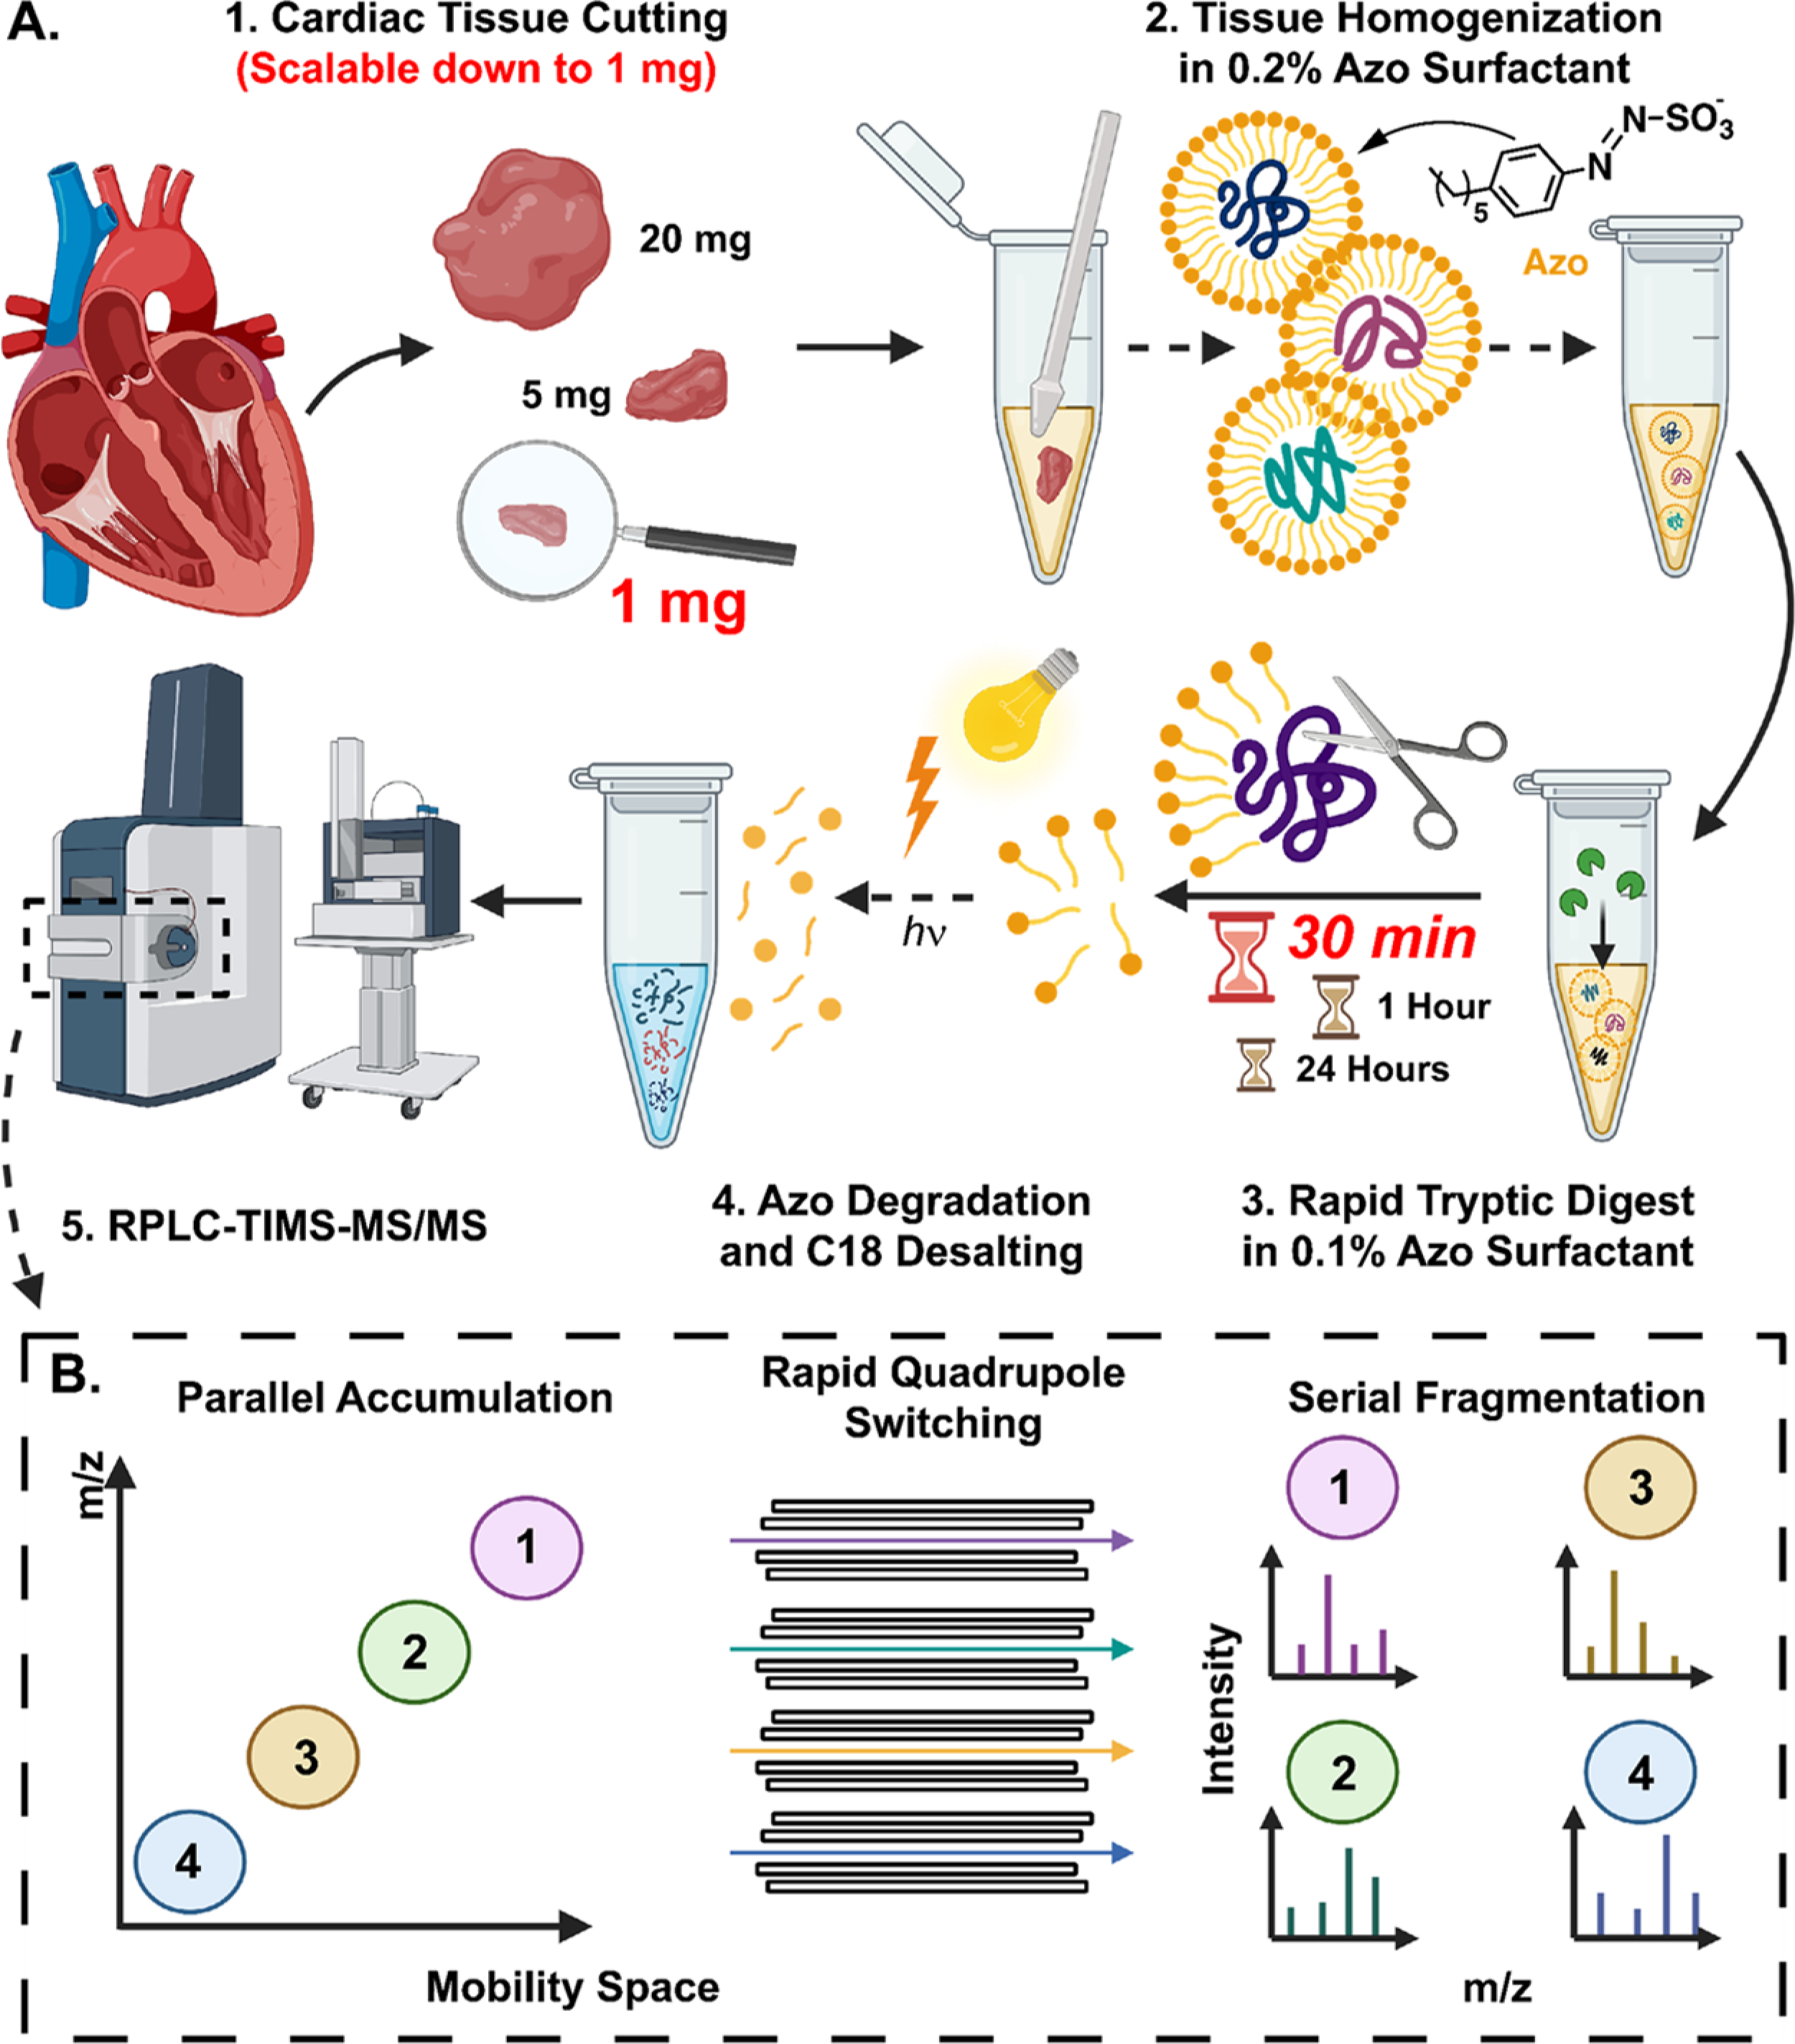
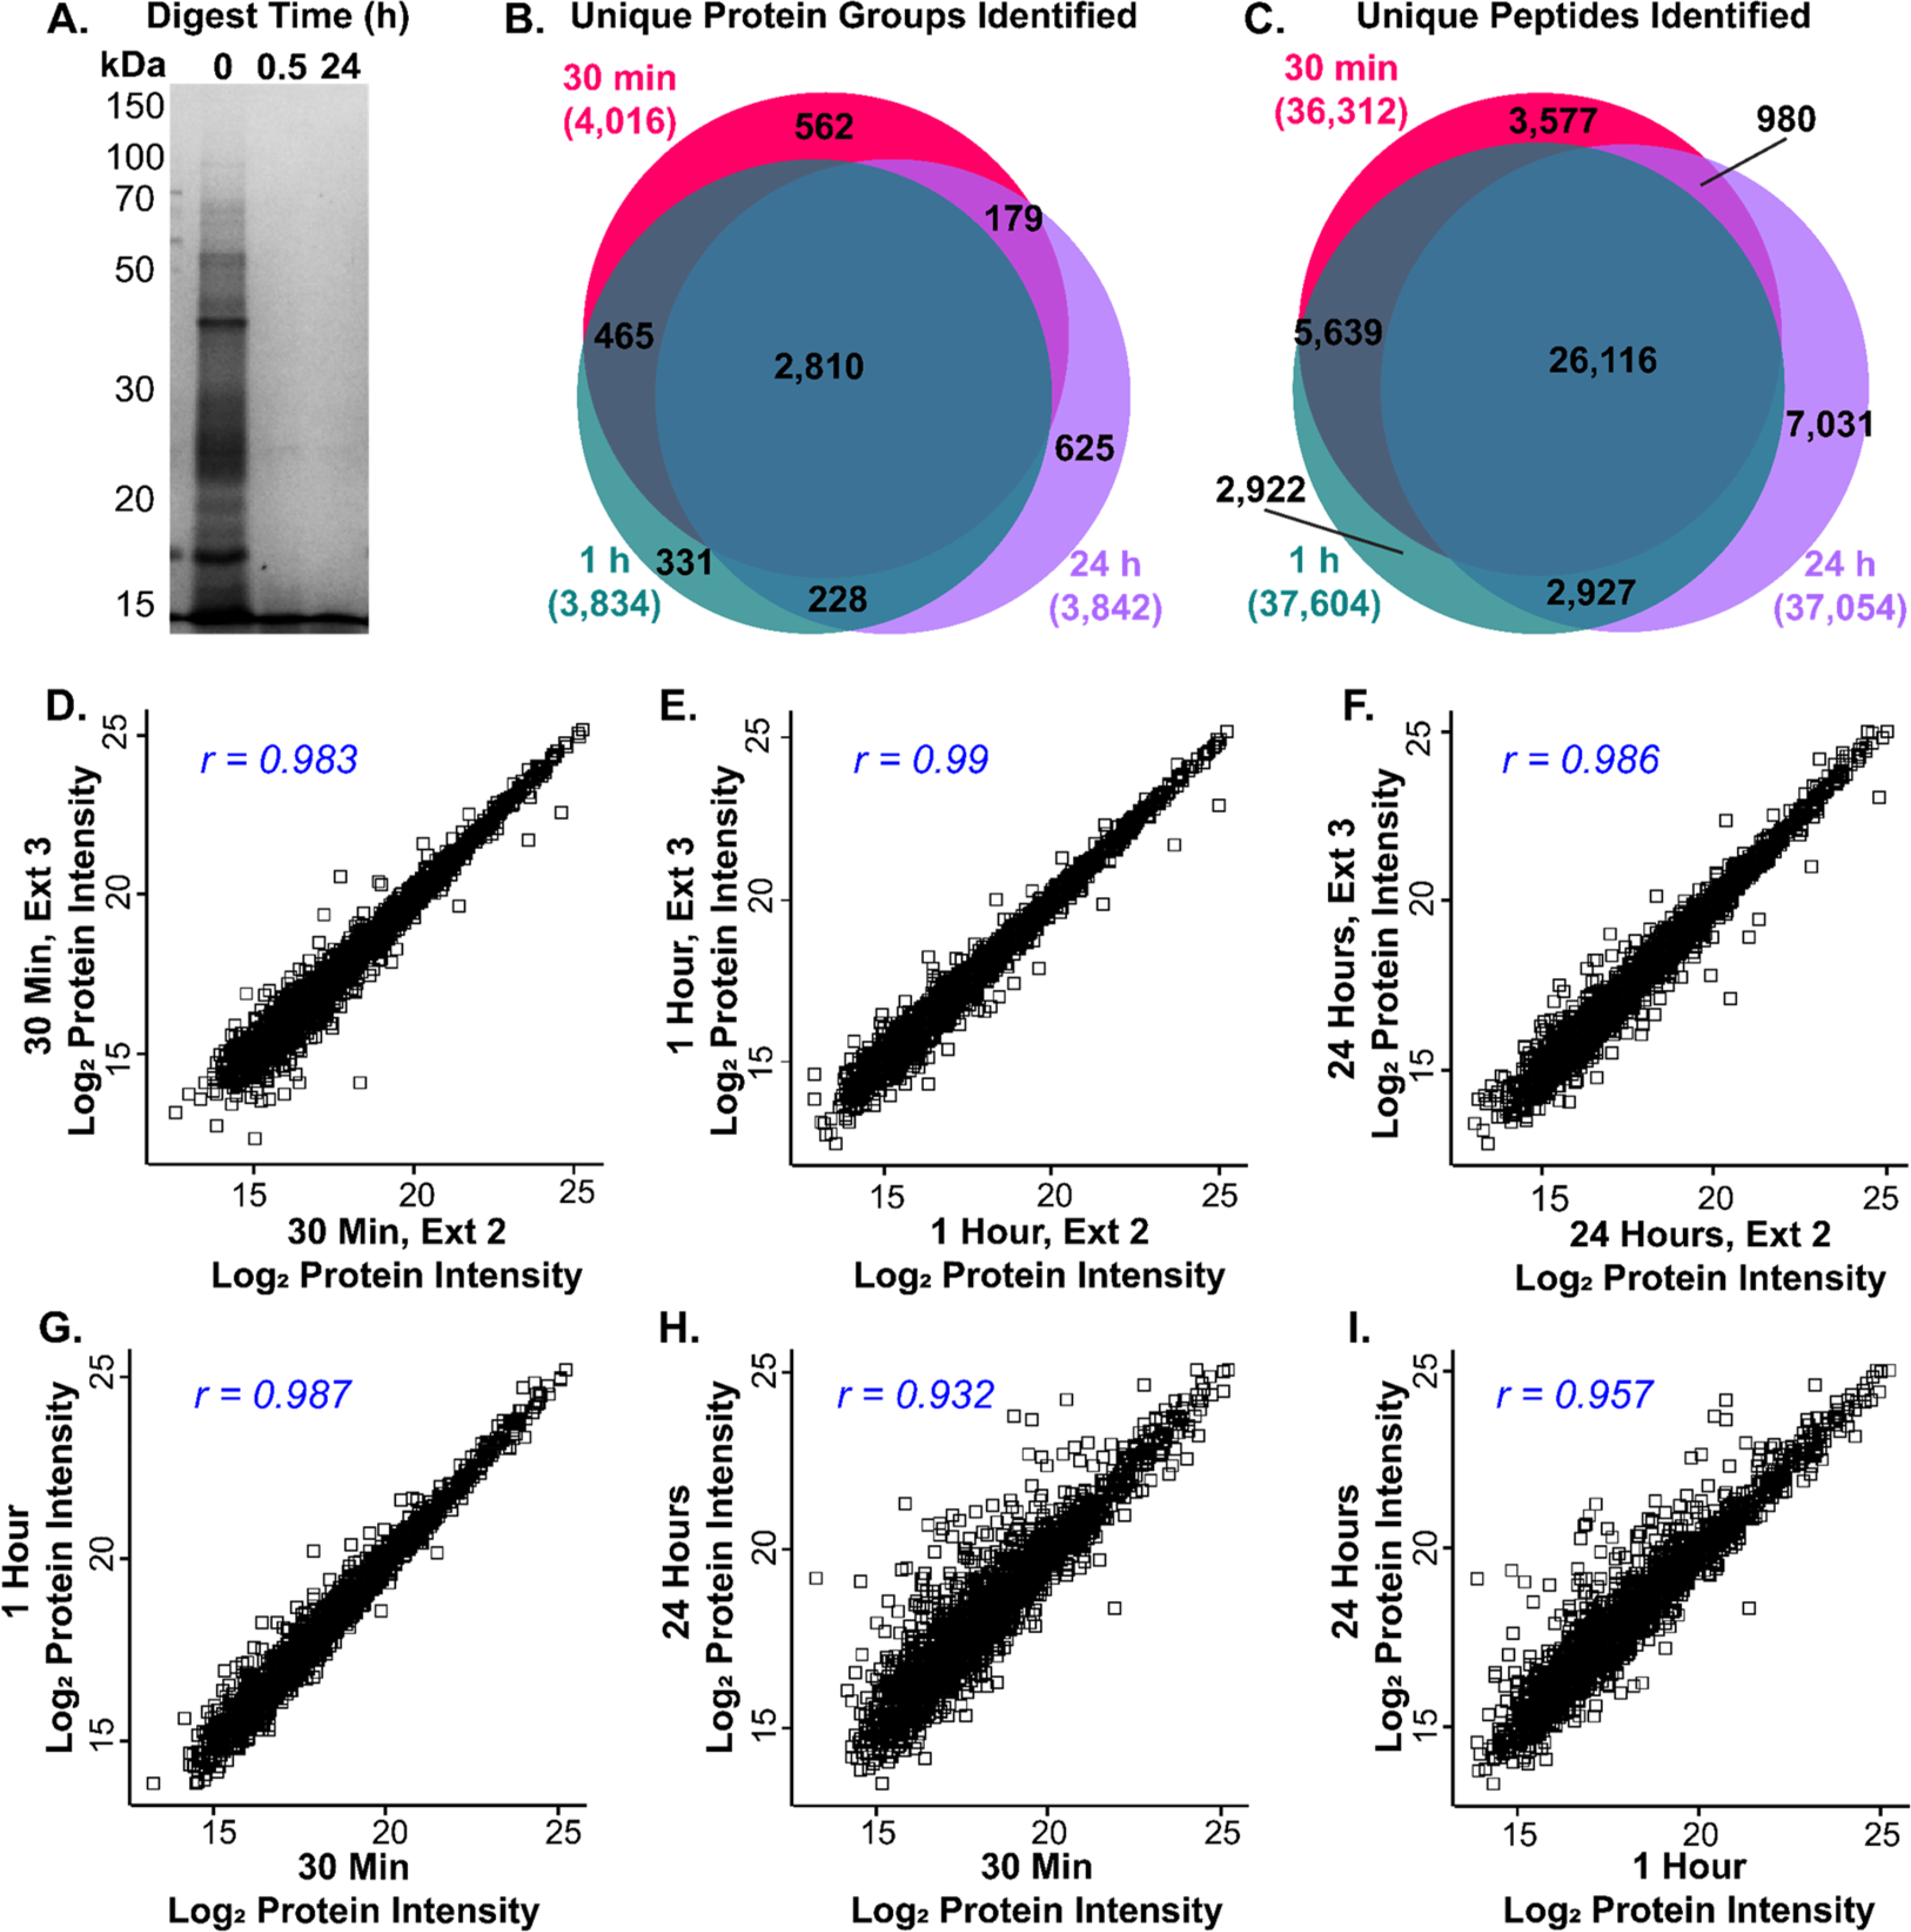
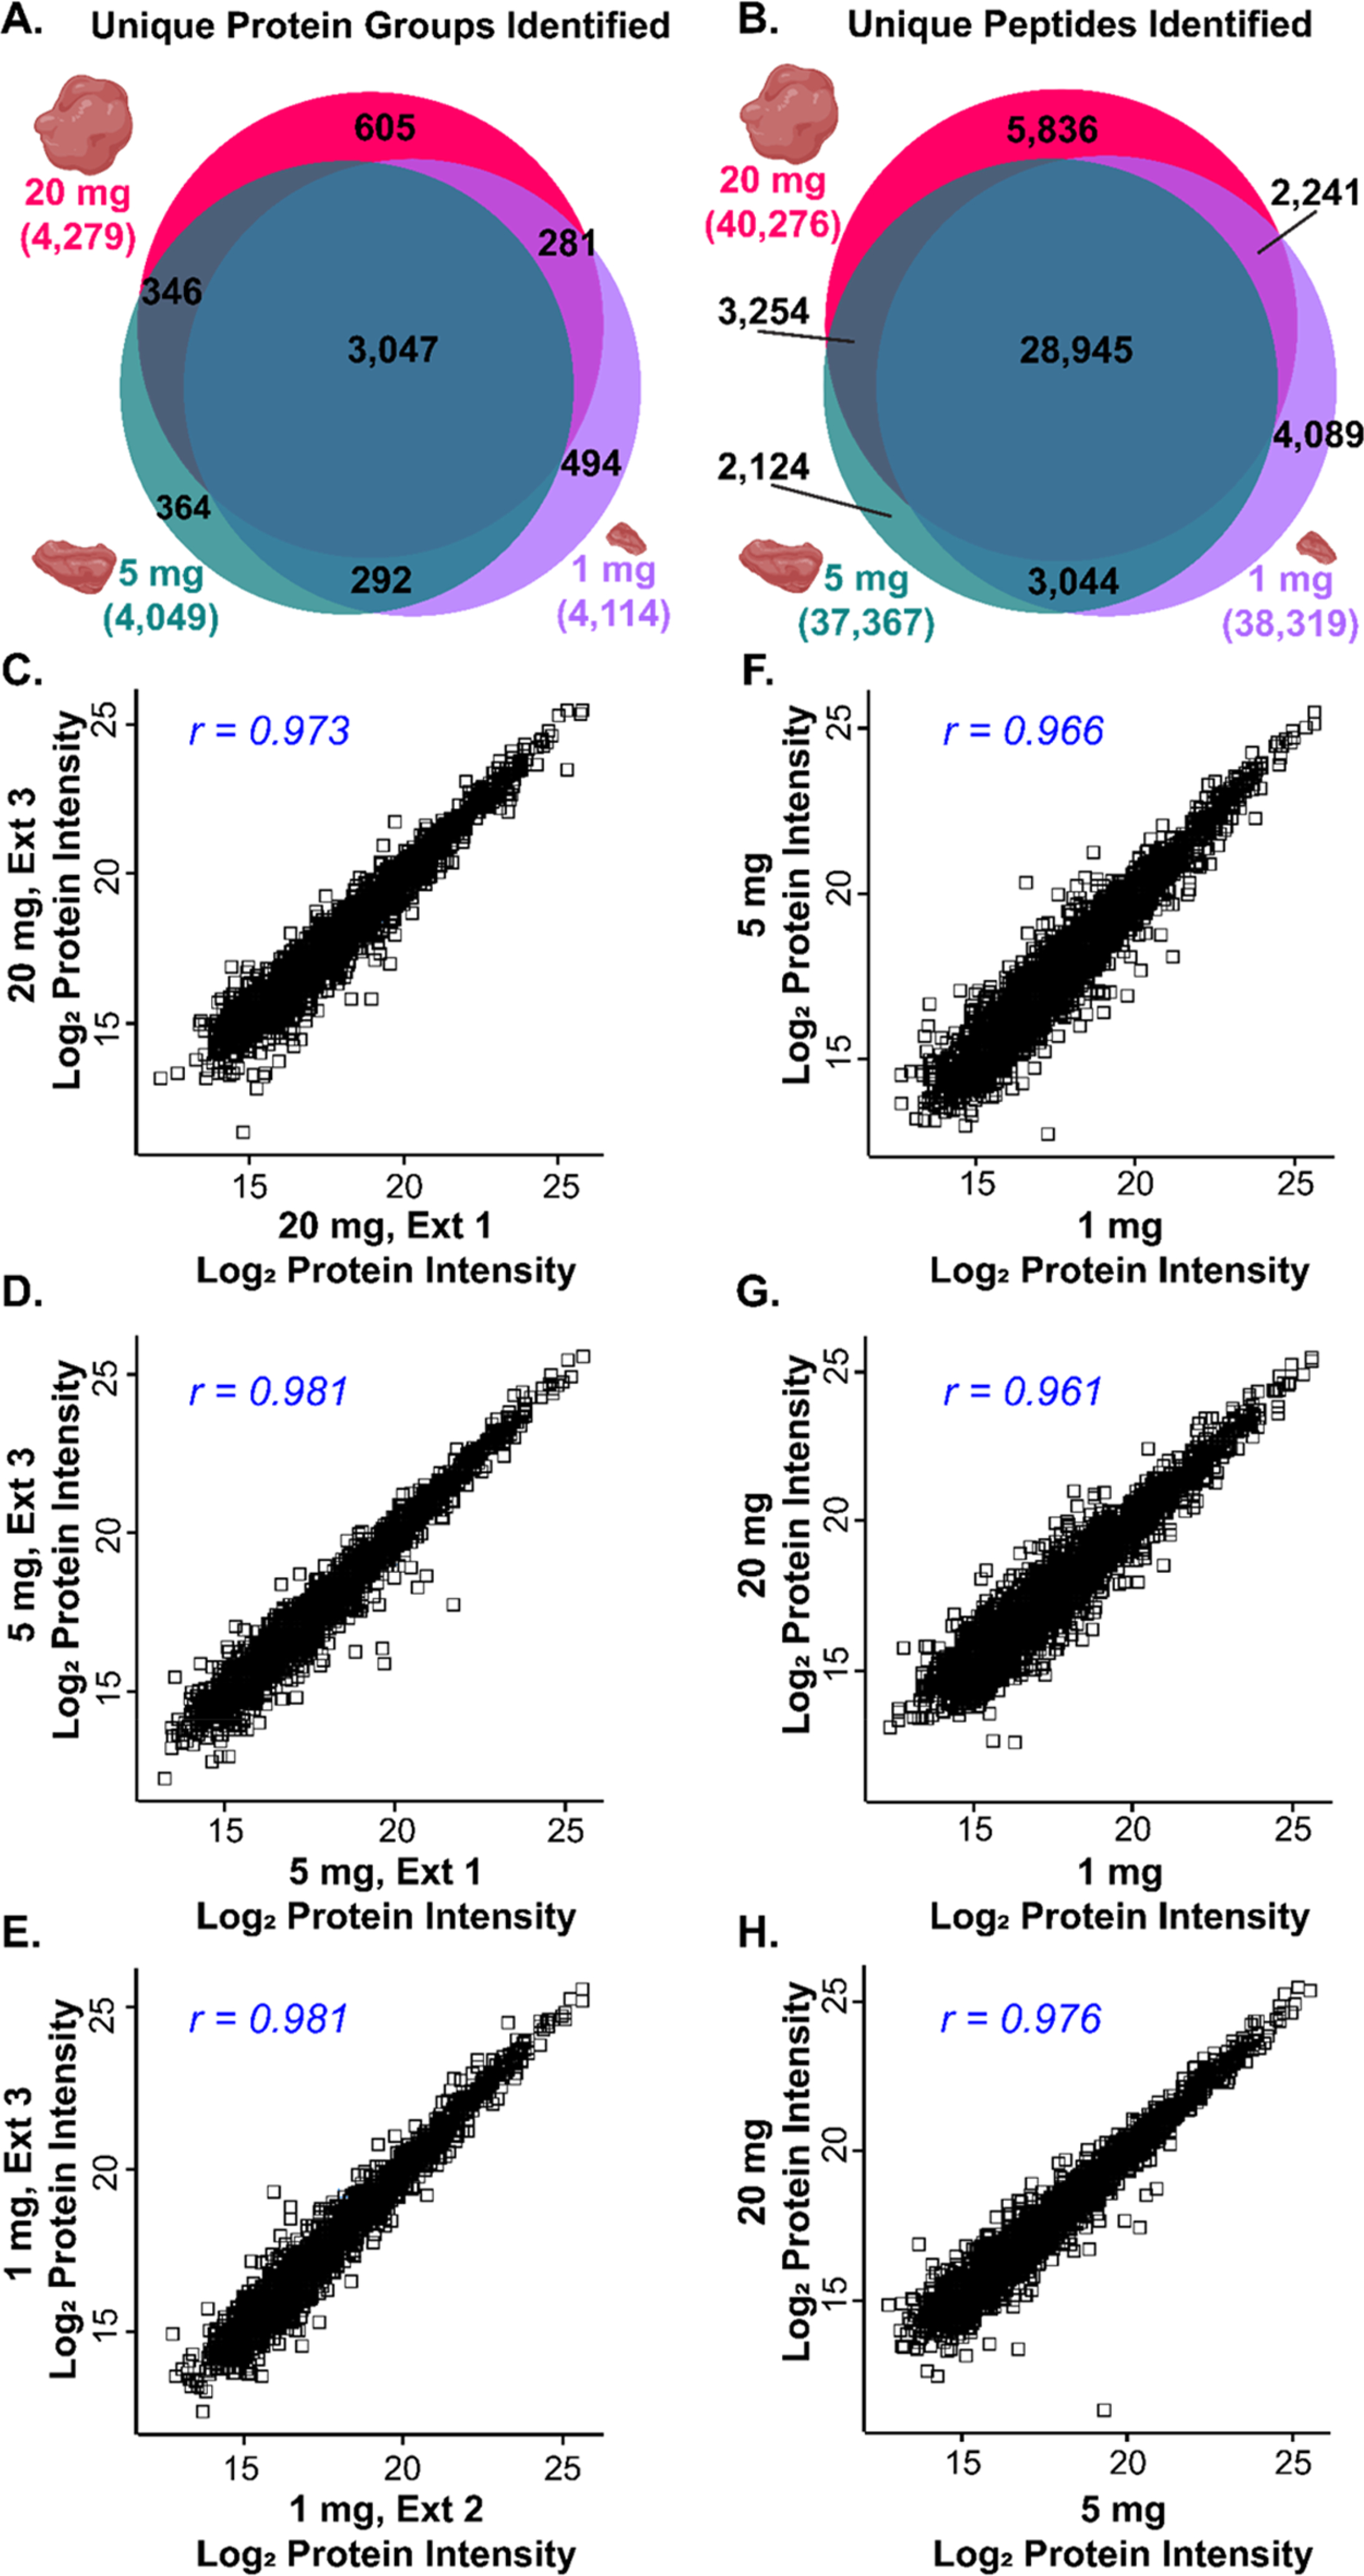
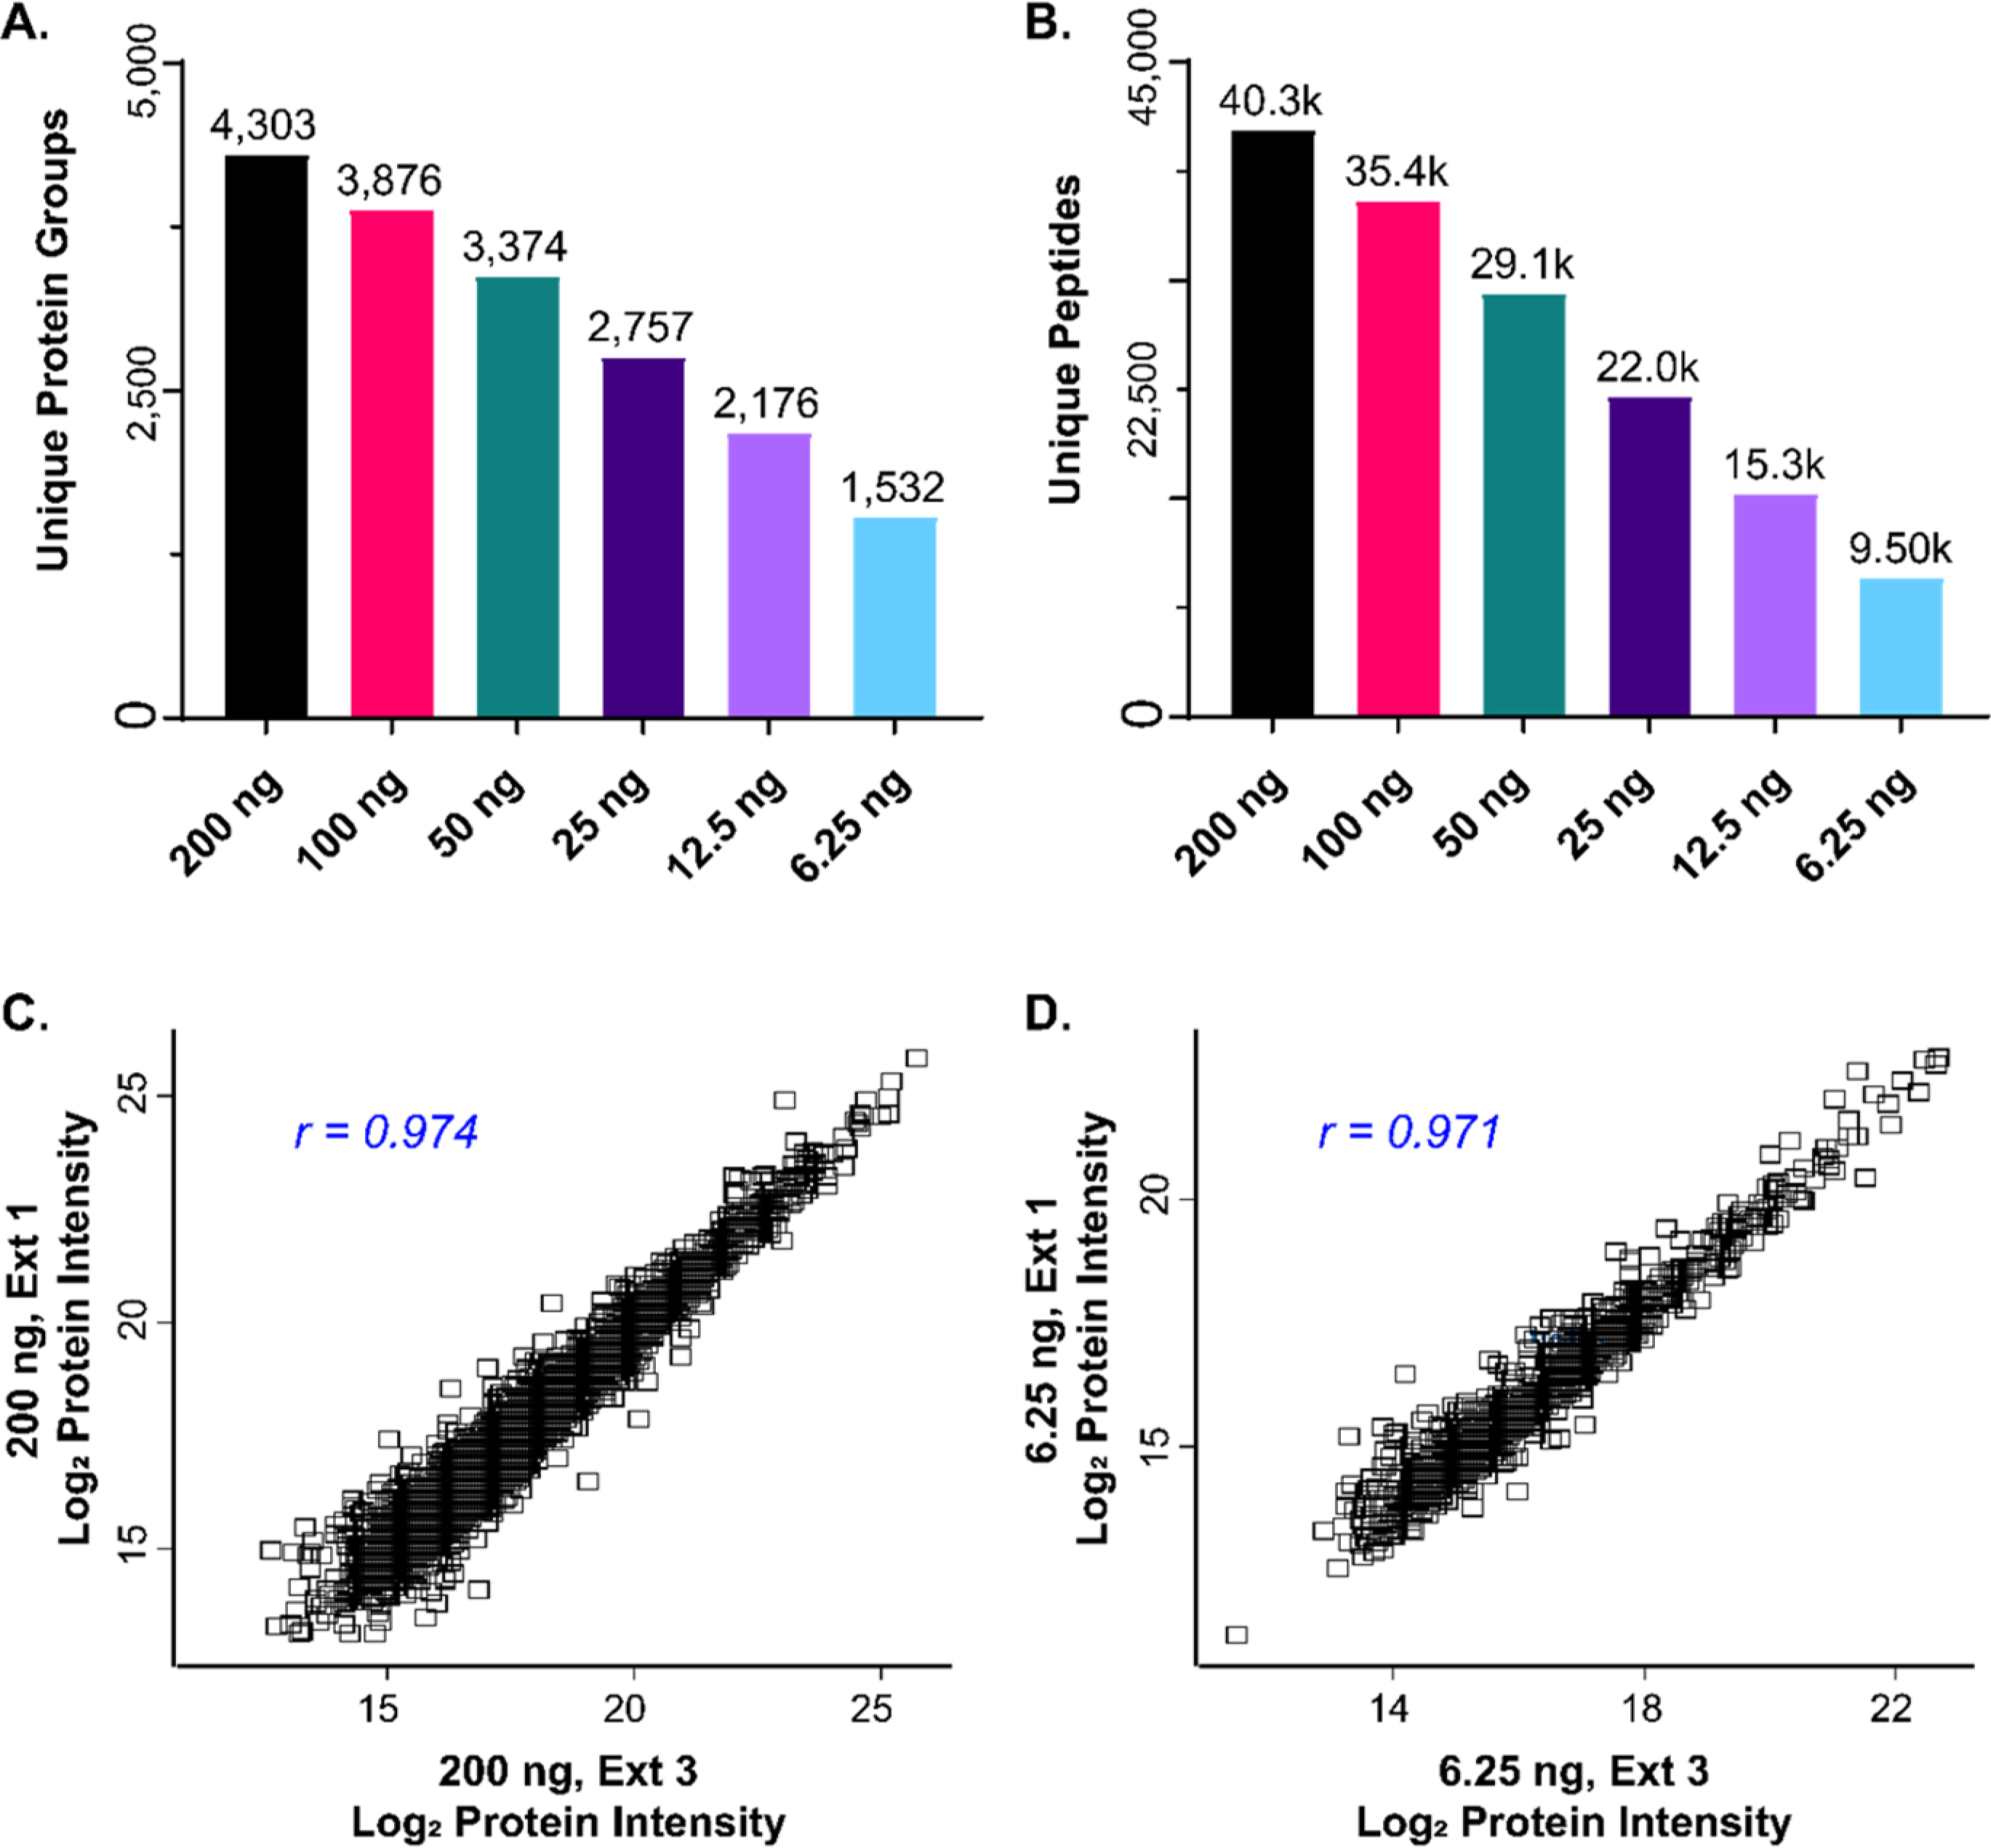
Global bottom-up mass spectrometry (MS)-based proteomics is widely used for protein identification and quantification to achieve a comprehensive understanding of the composition, structure, and function of the proteome. However, traditional sample preparation methods are time-consuming, typically including overnight tryptic digestion, extensive sample cleanup to remove MS-incompatible surfactants, and offline sample fractionation to reduce proteome complexity prior to online liquid chromatography-tandem mass spectrometry (LC-MS/MS) analysis. Thus, there is a need for a fast, robust, and reproducible method for protein identification and quantification from complex proteomes. Herein, we developed an ultrafast bottom-up proteomics method enabled by Azo, a photocleavable, MS-compatible surfactant that effectively solubilizes proteins and promotes rapid tryptic digestion, combined with the Bruker timsTOF Pro, which enables deeper proteome coverage through trapped ion mobility spectrometry (TIMS) and parallel accumulation-serial fragmentation (PASEF) of peptides. We applied this method to analyze the complex human cardiac proteome and identified nearly 4000 protein groups from as little as 1 mg of human heart tissue in a single one-dimensional LC-TIMS-MS/MS run with high reproducibility. Overall, we anticipate this ultrafast, robust, and reproducible bottom-up method empowered by both Azo and the timsTOF Pro will be generally applicable and greatly accelerate the throughput of large-scale quantitative proteomic studies. Raw data are available via the MassIVE repository with identifier MSV000087476.

Keywords: bottom-up proteomics; human heart proteomics; photocleavable surfactant; quantitative proteomics; sample preparation.


Conflict of interest statement

The authors declare no competing financial interest.

Figures

Figure 1.
Figure 1.
Global bottom-up proteomics workflow using Azo and PASEF on the timsTOF Pro. (A) Sample preparation, including (1) tissue cutting (scalable down to 1 mg of tissue), (2) tissue homogenization in Azo, a photocleavable surfactant, (3) rapid tryptic digest (as quick as 30 min), and (4) Azo degradation and C18 desalting prior to (5) RPLC-TIMS-MS/MS. (B) Schematic of PASEF on the timsTOF Pro, demonstrating parallel accumulation of ions, rapid quadrupole mass filter switching, and serial ion fragmentation.
Figure 2.
Figure 2.
Azo promotes rapid and reproducible tryptic digestion for quantitative proteomics. (A) SDS-PAGE showing tryptic digestion efficiency in 0.1% Azo after 0.5 and 24 h of digestion. (B,C) Venn diagrams illustrating overlap in unique protein groups (B), and unique peptides (C) identified by MaxQuant between 30 min, 1 h, and 24 h tryptic digestions (n = 3 technical replicates for each group). (D-F) Scatterplots of Log2 LFQ protein intensities showing high reproducibility between replicates from 30 min (D), 1 h (E), and 24 h (F) tryptic digestions. Pearson correlation coefficients are shown in the top left corner of each panel. (G-I) Scatterplots of Log2 LFQ protein intensities showing high reproducibility between averaged replicates from 30 min digestions plotted against 1 h digestions (G), 30 min digestions plotted against 24 h digestions (H), and 1 h digestions plotted against 24 h digestions (I) with Pearson correlation coefficients shown in the top left corner of each panel (n = 3 technical replicates for each group).
Figure 3.
Figure 3.
Reproducible protein identification and quantitation from small amounts of tissue. (A,B) Venn diagrams illustrating overlap in unique protein groups (A), and unique peptides (B) identified by MaxQuant between 20, 5, and 1mg of tissue (n = 3 technical replicates for each group). (D Scatterplots of Log2 LFQ protein intensities showing high reproducibility between replicates from 20 mg (D), 5 mg (E), and 1 mg (F) tissue extractions. Pearson correlation coefficients are shown in the top left corner of each panel. (G–I) Scatterplots of Log2 LFQ protein intensities showing high reproducibility between averaged replicates from 1 mg extractions plotted against 5 mg extractions (G), 1 mg extractions plotted against 20 mg extractions (H), and 5 mg extractions plotted against 20 mg extractions (I) with Pearson correlation coefficients shown in the top left corner of each panel (n = 3 technical replicates for each group).
Figure 4.
Figure 4.
LFQ analysis with high reproducibility from low sample loading amounts on the timsTOF Pro. (A,B) Bar charts showing the total number of unique protein groups (A), and unique peptides (B), identified by MaxQuant from injections of 200, 100, 50, 25, 12.5, and 6.25 ng of digested peptide (n = 3 technical replicates for each group), respectively. Total number of identifications are displayed above each bar. (C,D) Scatterplots of Log2LFQ protein intensities showing high reproducibility between replicates from 200 ng (C) and 6.25 ng (D) injections. Pearson correlation coefficients are shown in the top left corner of each panel.

References

    1. Zhang Y; Fonslow BR; Shan B; Baek M-C; Yates JR 3rd Protein analysis by shotgun/bottom-up proteomics. Chem. Rev. 2013, 113 (4), 2343–2394. - PMC - PubMed
    1. Gillet LC; Leitner A; Aebersold R Mass Spectrometry Applied to Bottom-Up Proteomics: Entering the High-Throughput Era for Hypothesis Testing. Annu. Rev. Anal. Chem. 2016, 9 (1), 449–472. - PubMed
    1. Aebersold R; Mann M Mass-spectrometric exploration of proteome structure and function. Nature 2016, 537 (7620), 347–355. - PubMed
    1. Weston LA; Bauer KM; Hummon AB Comparison of bottom-up proteomic approaches for LC-MS analysis of complex proteomes. Anal. Methods 2013, 5 (18), 4615–4621. - PMC - PubMed
    1. Kuljanin M; Dieters-Castator DZ; Hess DA; Postovit L-M; Lajoie GA Comparison of sample preparation techniques for large-scale proteomics. Proteomics 2017, 17 (1–2), 1600337. - PubMed

Publication types