. 2021 Jul 8;16(7):e0240957.
doi: 10.1371/journal.pone.0240957. eCollection 2021.

Relationships between climate and phylogenetic community structure of fossil pollen assemblages are not constant during the last deglaciation

Affiliations

Relationships between climate and phylogenetic community structure of fossil pollen assemblages are not constant during the last deglaciation

Kavya Pradhan et al. PLoS One. .

Abstract

Disentangling the influence of environmental drivers on community assembly is important to understand how multiple processes influence biodiversity patterns and can inform understanding of ecological responses to climate change. Phylogenetic Community Structure (PCS) is increasingly used in community assembly studies to incorporate evolutionary perspectives and as a proxy for trait (dis)similarity within communities. Studies often assume a stationary relationship between PCS and climate, though few studies have tested this assumption over long time periods with concurrent community data. We estimated two PCS metrics-Nearest Taxon Index (NTI) and Net Relatedness index (NRI)-of fossil pollen assemblages of Angiosperms in eastern North America over the last 21 ka BP at 1 ka intervals. We analyzed spatiotemporal relationships between PCS and seven climate variables, evaluated the potential impact of deglaciation on PCS, and tested for the stability of climate-PCS relationships through time. The broad scale geographic patterns of PCS remained largely stable across time, with overdispersion tending to be most prominent in the central and southern portion of the study area and clustering dominating at the longitudinal extremes. Most importantly, we found that significant relationships between climate variables and PCS (slope) were not constant as climate changed during the last deglaciation and new ice-free regions were colonized. We also found weak, but significant relationships between both PCS metrics (i.e., NTI and NRI) and climate and time-since-deglaciation that also varied through time. Overall, our results suggest that (1) PCS of fossil Angiosperm assemblages during the last 21ka BP have had largely constant spatial patterns, but (2) temporal variability in the relationships between PCS and climate brings into question their usefulness in predictive modeling of community assembly.


Conflict of interest statement

The authors have declared that no competing interests exist.

Figures
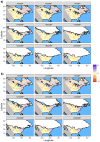
Fig 1
Fig 1. Spatial pattern of phylogenetic community structure through time.
a) Net Relatedness Index (NRI) and b) Nearest Taxon Index (NTI) for the study area through time (for clarity only a subset of time periods are plotted). Maps were calculated using Inverse Distance Weighted interpolation using actual NRI and NTI values from cells with pollen occurrences. Higher values (purple shading) indicate more clustered communities (organisms are more related) and lower values (red shading) indicate overdispersed communities (organisms are less related). Ice sheet extent at each time period is represented with a white polygon.
Fig 2
Fig 2. Relationship between net relatedness index (NRI) and three climate variables and their change through time according to the three fitted models.
Gray shading in the scatter plots represents the count of points falling in each bin (hexagons). The panels on the left (a, c, e) represent the overall relationship according to ordinary least square regression when pooling all time periods (Stable-Relationship; orange lines). The panels on the right (b, d, f) show the relationship between NRI and climate variables as estimated with the data for a subset of time periods, with green lines representing Stable-Slope Model, blue lines representing Changed-Relationship Model, and the orange line showing the overall relationship from panels on the left for comparison. Note that each model is fitted to data for all time periods and hence a single adjusted R2 and p-value for each model is presented in the same colors as the lines. Shaded areas represent the confidence intervals at 95% for the regression lines.
Fig 3
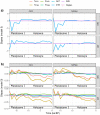
Fig 3. Model intercepts through time.
Intercepts of OLS and SAR models for each variable plotted across time for a) Stable-Slope and b) Changed-Relationship models. Tmin = minimum temperature of the coldest month; Tmax = maximum temperature of the warmest month; Pmin = minimum precipitation of the driest month; Pmax = maximum precipitation of the wettest month; AET = mean yearly actual evapotranspiration; ETR = mean yearly ratio of actual and potential evapotranspiration; WDI = mean yearly water deficit index; DEGLAC = time-since-deglaciation.
Fig 4
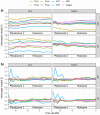
Fig 4. Model slopes through time.
Slopes of OLS and SAR models for each variable plotted across time for the Changed-Relationship models. Slopes represent increments on the PCS metric by one-unit increments in each independent variable, hence, units differ among variables. Note that for readability a) contains slopes for ETR while b) shows slopes for all other variables as the magnitude of slope values for ETR was much greater than that of other variables. Tmin = minimum temperature of the coldest month; Tmax = maximum temperature of the warmest month; Pmin = minimum precipitation of the driest month; Pmax = maximum precipitation of the wettest month; AET = mean yearly actual evapotranspiration; ETR = mean yearly ratio of actual and potential evapotranspiration; WDI = mean yearly water deficit index; DEGLAC = time-since-deglaciation.
Fig 5
Fig 5. Pattern of time-since-deglaciation on net relatedness index (NRI) and nearest taxon index (NTI).
Each cell in the heatmap represents the average a) NRI or b) NTI value for cells of a particular time-since-deglaciation at a particular time period. Black squares indicate absence of the particular time-since-deglaciation class for that time period. The second row of heatmaps represent the average of residuals for c) NRI and d) NTI with the effect of climate variables taken into account using multiple regression models that included all climate variables. Purple shading represents higher PCS values (PCS > 0) and, hence, clustered community structure, whereas red shading represents lower PCS (PCS < 0) values and, hence, overdispersed community structure.

References

    1. Jackson ST, Overpeck JT. Responses of plant populations and communities to environmental changes of the late Quaternary. Paleobiology. 2000;26: 194–220.
    1. Shuman B, Newby P, Huang Y, Webb T III. EVIDENCE FOR THE CLOSE CLIMATIC CONTROL OF NEW ENGLAND VEGETATION HISTORY. Ecology. 2004;85: 1297–1310. doi: 10.1890/02-0286 - DOI
    1. Lebrija-Trejos E, Pérez-García EA, Meave JA, Bongers F, Poorter L. Functional traits and environmental filtering drive community assembly in a species-rich tropical system. Ecology. 2010;91: 386–398. Available: https://esajournals.onlinelibrary.wiley.com/doi/abs/10.1890/08-1449.1 - DOI - PubMed
    1. Blonder B, Nogués-Bravo D, Borregaard MK, Donoghue JC 2nd, Jørgensen PM, Kraft NJB, et al.. Linking environmental filtering and disequilibrium to biogeography with a community climate framework. Ecology. 2015;96: 972–985. doi: 10.1890/14-0589.1 - DOI - PubMed
    1. Williams JW, Jackson ST. Novel climates, no-analog communities, and ecological surprises. Front Ecol Environ. 2007;5: 475–482. Available: file://localhost/Users/jessicablois/Documents/Work/Papers/2007/Williams/Frontiers%20in%20Ecology%20and%20the%20Environment%202007%20Williams.pdf papers://3B9B6E65-F46E-438D-9F57-36DC033A5A66/Paper/p17355