

Association of blood pressure after peritoneal dialysis initiation with the decline rate of residual kidney function in newly-initiated peritoneal dialysis patients
- PMID: 34237104
- PMCID: PMC8266121
- DOI: 10.1371/journal.pone.0254169
Association of blood pressure after peritoneal dialysis initiation with the decline rate of residual kidney function in newly-initiated peritoneal dialysis patients
Abstract
Background: Lower blood pressure (BP) levels are linked to a slower decline of kidney function in patients with chronic kidney disease (CKD) without kidney replacement therapy. However, there are limited data on this relation in peritoneal dialysis (PD) patients. Here we evaluated the association of BP levels with the decline of residual kidney function (RKF) in a retrospective cohort study.
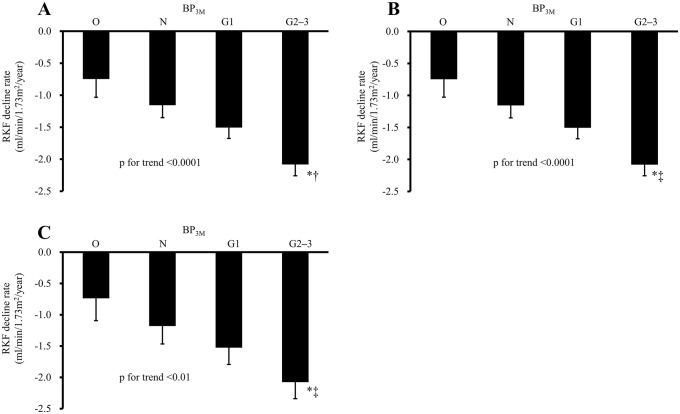
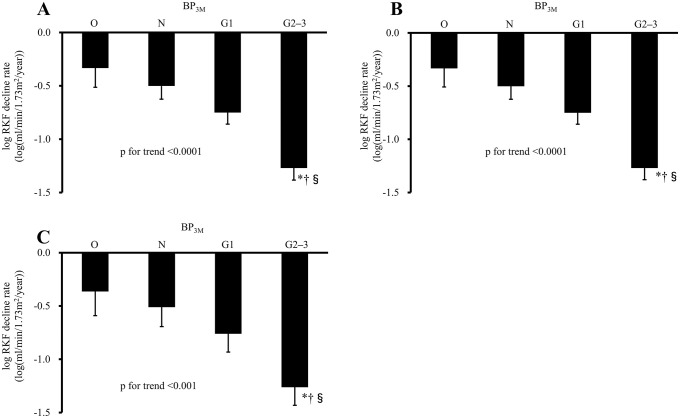
Methods: We enrolled 228 patients whose PD was initiated between 1998 and 2014. RKF was measured as the average of creatinine and urea clearance in 24-hr urine collections. We calculated the annual decline rate of RKF by determining the regression line for individual patients. RKF is thought to decline exponentially, and thus we also calculated the annual decline rate of logarithmic scale of RKF (log RKF). We categorized the patients' BP levels at 3 months after PD initiation (BP3M) into four groups (Optimal, Normal & High normal, Grade 1 hypertension, Grade 2 & 3 hypertension) according to the 2018 European Society of Cardiology and European Society of Hypertension Guidelines for the management of arterial hypertension.
Results: The unadjusted, age- and sex-adjusted, and multivariable-adjusted decline rate of RKF and log RKF decreased significantly with higher BP3M levels (P for trend <0.01). Compared to those of the Optimal group, the multivariable-adjusted odds ratios (95% confidence interval) for the faster side of the median decline rate of RKF and log RKF were 4.04 (1.24-13.2) and 5.50 (1.58-19.2) in the Grade 2 and 3 hypertension group, respectively (p<0.05).
Conclusions: Higher BP levels after PD initiation are associated with a faster decline in RKF among PD patients.
Conflict of interest statement
The authors have declared that no competing interests exist.
Figures
Similar articles
-
Rate of Decline of Residual Kidney Function Before and After the Start of Peritoneal Dialysis.Perit Dial Int. 2016 May-Jun;36(3):334-9. doi: 10.3747/pdi.2016.00024. Epub 2016 Apr 4. Perit Dial Int. 2016. PMID: 27044795 Free PMC article.
-
Rate of decline in residual kidney function pre and post peritoneal dialysis initiation: A post hoc analysis of the IDEAL study.PLoS One. 2020 Nov 16;15(11):e0242254. doi: 10.1371/journal.pone.0242254. eCollection 2020. PLoS One. 2020. PMID: 33196667 Free PMC article.
-
Association Between Residual Kidney Function and Visit-to-Visit Blood Pressure Variability in Peritoneal Dialysis Patients.Adv Perit Dial. 2015;31:49-53. Adv Perit Dial. 2015. PMID: 26714389
-
Rationale and Strategies for Preserving Residual Kidney Function in Dialysis Patients.Am J Nephrol. 2019;50(6):411-421. doi: 10.1159/000503805. Epub 2019 Oct 18. Am J Nephrol. 2019. PMID: 31630148 Review.
-
The importance of residual kidney function in haemodialysis patients.Nephrology (Carlton). 2018 Dec;23(12):1073-1080. doi: 10.1111/nep.13427. Nephrology (Carlton). 2018. PMID: 29920874 Review.
Cited by
-
Peritoneal Dialysis for Potential Kidney Transplant Recipients: Pride or Prejudice?Medicina (Kaunas). 2022 Feb 1;58(2):214. doi: 10.3390/medicina58020214. Medicina (Kaunas). 2022. PMID: 35208541 Free PMC article. Review.
-
Influencing factors for residual kidney function in incident peritoneal dialysis patients: a systematic review and meta-analysis.Ren Fail. 2023;45(2):2286328. doi: 10.1080/0886022X.2023.2286328. Epub 2023 Nov 30. Ren Fail. 2023. PMID: 38036948 Free PMC article.
References
-
- Maiorca R, Brunori G, Zubani R, Cancarini GC, Manili L, Camerini C, et al.. Predictive value of dialysis adequacy and nutritional indices for mortality and morbidity in CAPD and HD patients. A longitudinal study. Nephrol Dial Transplant. 1995; 10:2295–2305. doi: 10.1093/ndt/10.12.2295 - DOI - PubMed
-
- Termorshuizen F, Dekker FW, van Manen JG, Korevaar JC, Boeschoten EW, Krediet RT; NECOSAD Study Group. Relative contribution of residual renal function and different measures of adequacy to survival in hemodialysis patients: An analysis of the Netherlands Cooperative Study on the Adequacy of Dialysis (NECOSAD)-2. J Am Soc Nephrol. 2004; 15:1061–1070. doi: 10.1097/01.asn.0000117976.29592.93 - DOI - PubMed
