. 2021 Jul 8;17(7):e1009697.
doi: 10.1371/journal.ppat.1009697. eCollection 2021 Jul.

Listeria monocytogenes infection rewires host metabolism with regulatory input from type I interferons

Affiliations

Listeria monocytogenes infection rewires host metabolism with regulatory input from type I interferons

Duygu Demiroz et al. PLoS Pathog. .

Abstract

Listeria monocytogenes (L. monocytogenes) is a food-borne bacterial pathogen. Innate immunity to L. monocytogenes is profoundly affected by type I interferons (IFN-I). Here we investigated host metabolism in L. monocytogenes-infected mice and its potential control by IFN-I. Accordingly, we used animals lacking either the IFN-I receptor (IFNAR) or IRF9, a subunit of ISGF3, the master regulator of IFN-I-induced genes. Transcriptomes and metabolite profiles showed that L. monocytogenes infection induces metabolic rewiring of the liver. This affects various metabolic pathways including fatty acid (FA) metabolism and oxidative phosphorylation and is partially dependent on IFN-I signaling. Livers and macrophages from Ifnar1-/- mice employ increased glutaminolysis in an IRF9-independent manner, possibly to readjust TCA metabolite levels due to reduced FA oxidation. Moreover, FA oxidation inhibition provides protection from L. monocytogenes infection, explaining part of the protection of Irf9-/- and Ifnar1-/- mice. Our findings define a role of IFN-I in metabolic regulation during L. monocytogenes infection. Metabolic differences between Irf9-/- and Ifnar1-/- mice may underlie the different susceptibility of these mice against lethal infection with L. monocytogenes.


Conflict of interest statement

The authors declare no competing interests.

Figures
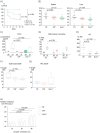
Fig 1
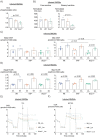
Fig 1. Irf9-/- and Ifnar1-/- mice differ in the level of protection from L. monocytogenes infection.
(A) Kaplan-Meier plots showing survival of mice after infection with 106 L. monocytogenes for 10 days. P values were calculated using log-rank test and corrected for multiple testing using Bonferroni-Holm correction. (B) Bacterial loads of spleen and liver three days post-infection. (C) CCL2 levels measured from the plasma of mice one day after PBS injection or L. monocytogenes infection using Luminex-based multiplex bead array. The figure shows the pool of two experiments (Number of uninfected mice used wt = 10; Irf9-/- = 10; Ifnar1-/- = 8 and one-day infected mice wt = 9; Irf9-/- = 9; Ifnar1-/- = 8) (D) Flow cytometric analysis of inflammatory monocytes derived from peritoneal lavage of mice one day after PBS injection or L. monocytogenes infection. (E) Alanine aminotransferase (ALT) levels measured in plasma three days post-infection. (F) Percentage of total splenocyte (n = 6 for all genotypes) and (G) PEC (n = 4, 5 and 6, respectively) death gated from single cells of mice one day post-infection, quantified using flow cytometry. Each data point represents one biological replicate. Minimum number of mice used per condition is four. The median values are shown with lines. Whiskers show 5–95 percentile. P values for CFU graphs were calculated using log10 transformed CFU values. For all statistical analysis ANOVA was performed and corrected for multiple testing with Tukey or Dunnett’s post-hoc test. (H) In vitro CFU assay showing log 2 transformed number of viable L. monocytogenes after 1h, 2h or 8h of infection per well. Each data point represents one biological replicate. Bars show the mean values. P values were calculated using two-way ANOVA and corrected for multiple testing with Dunnett’s post-hoc test. n represents the number of mice used for the specified experiment. nd: not detected.
Fig 2
Fig 2. L. monocytogenes infection and Ifnar1 deficiency lead to glutaminolysis and FAO changes in BMDMs.
(A) Quantification of ACC phosphorylation of BMDMs 6h post-infection. P value was calculated using ANOVA with Geisser-Greenhouse correction. (B) Extracted ion count (EIC) levels of carnitine and stearoyl carnitine normalized to tubulin levels as detected by WB of BMDM lysates 6h post-infection. P value was calculated using ANOVA corrected for multiple testing with Tukey’s post-hoc test. (C) OCR (Oxygen Consumption Rate) and (D) ECAR (Extracellular Acidification Rate) of wt, Irf9-/- and Ifnar1-/- BMDMs uninfected or 6h post- infection. Each data point represents one biological replicate. Bars show the mean values. P values were calculated using two-way ANOVA and corrected for multiple testing with Sidak and Dunnett’s post-hoc tests. Bars show the mean values. Mean OCR of four replicates of (E) Etomoxir- and (F) BPTES-treated L. monocytogenes infected BMDMs. The inhibitors were added at the time point indicated by the arrow. OCR differences (shown with braces) were calculated using OCR values measured at 73 min (addition of Rotenone/Antimycin) and 53 min (indicated with dashed lines).
Fig 3
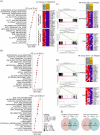
Fig 3. Transcriptome changes in L. monocytogenes-infected mouse livers demonstrate regulation of genes related to FA metabolism and OXPHOS.
GSEA of RNAseq data from livers of mice one day post-infection. Dot plots of GSEA results showing the first 20 enriched pathways in (A) infected compared to uninfected wt with the heatmaps of top 15 genes with the highest enrichment score of inflammatory response and IFN alpha response pathways, (B) infected Irf9-/- and Ifnar1-/- compared to infected wt. Color and size of the dots represent adjusted p values and the number of the genes represented from a certain gene set, respectively. The x-axes were calculated by the sum of the core-enriched genes divided by its set size and ordered decreasingly. The y-axis represents the corresponding gene set name. GSEA enrichment plots for OXPHOS and FA metabolism of infected (C) Irf9-/- and (D) Ifnar1-/- compared to infected wt with the heatmaps of top 15 genes with the highest enrichment score of OXPHOS and FA metabolism pathways. (E) Venn diagrams showing the number of genes enriched in infected Irf9-/- and Ifnar1-/- compared to infected wt in OXPHOS and FA metabolism pathways. unt: untreated, Lm: L. monocytogenes infected.
Fig 4
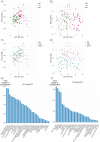
Fig 4. L. monocytogenes infection and IFN-I signaling induce metabolic changes in the liver.
PCA plots of metabolites quantified by targeted LC-MS/MS from livers of (A-B) uninfected, one-day- or three-day-infected and (C-D) wt, Irf9-/- and Ifnar1-/- mice. Percentage of total variance is indicated in the axis label. Bar graphs showing contribution of each metabolite to clustering in (E) PC1 versus PC2 and (F) PC3 versus PC4. The values are corrected for liver weight, genotype, sex of the mouse and time point effects. ANCOVA test was performed. Contrib.: contribution, PC: Principal component.
Fig 5
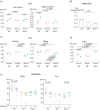
Fig 5. L. monocytogenes infection and IFN-I signaling cause changes in TCA cycle, FA and glutamine metabolism intermediates of liver.
Corrected EIC (extracted ion counts) of metabolites of (A) FAO, (C) TCA cycle and (D) GABA plotted in Fig 4. The values and false discovery rate p values were calculated using values corrected for liver weight, sex of the mouse and experimental variation effects. ANCOVA test was performed. (B) Quantification of ACC phosphorylation as determined by western blot. Bars show the mean values. Each data point represents one western blot replicate of one-day infected mouse liver lysates. Error bars show minimum and maximum values. P value was calculated using ANOVA with Dunnett’s and Geisser-Greenhouse correction. (E) Bacterial loads of spleen and liver of etomoxir-treated mice three days post-infection. P values were calculated using two-tailed Mann-Whitney t-test.
Fig 6
Fig 6. Model of Listeria monocytogenes-induced metabolic rewiring.
(A) Listeria monocytogenes (Lm) induced-IFN-I regulate FA import into the mitochondria. Absence of autocrine IFNAR1 signalling leads to decreased fatty acid oxidation (FAO) in Irf9-/- and Ifnar1-/- BMDMs and livers, and also reduced TCA cycle intermediate levels and oxidative phosphorylation (OXPHOS) as well as increased glutaminolysis exclusively in Ifnar1-/- BMDMs and livers.

References

    1. WHO. WHO estimates of the global burden of foodborne diseases: foodborne disease burden epidemiology reference group 2007–2015. WHO estimates of the global burden of foodborne diseases: foodborne disease burden epidemiology reference group 2007–2015. 2015. p. 255. Available: https://www.who.int/foodsafety/publications/foodborne_disease/fergreport...
    1. Eisenreich W, Heesemann J, Rudel T, Goebel W. Metabolic host responses to infection by intracellular bacterial pathogens. Front Cell Infect Mi. 2013;3: 24. doi: 10.3389/fcimb.2013.00024 - DOI - PMC - PubMed
    1. Chambers MC, Song KH, Schneider DS. Listeria monocytogenes Infection Causes Metabolic Shifts in Drosophila melanogaster. Plos One. 2012;7: e50679. doi: 10.1371/journal.pone.0050679 - DOI - PMC - PubMed
    1. Ayres JS, Schneider DS. The Role of Anorexia in Resistance and Tolerance to Infections in Drosophila. Plos Biol. 2009;7: e1000150. doi: 10.1371/journal.pbio.1000150 - DOI - PMC - PubMed
    1. Wang A, Huen SC, Luan HH, Yu S, Zhang C, Gallezot J-D, et al.. Opposing Effects of Fasting Metabolism on Tissue Tolerance in Bacterial and Viral Inflammation. Cell. 2016;166: 1512–1525.e12. doi: 10.1016/j.cell.2016.07.026 - DOI - PMC - PubMed

Publication types