

The structural connectome and motor recovery after stroke: predicting natural recovery
- PMID: 34237143
- PMCID: PMC8370413
- DOI: 10.1093/brain/awab082
The structural connectome and motor recovery after stroke: predicting natural recovery
Abstract
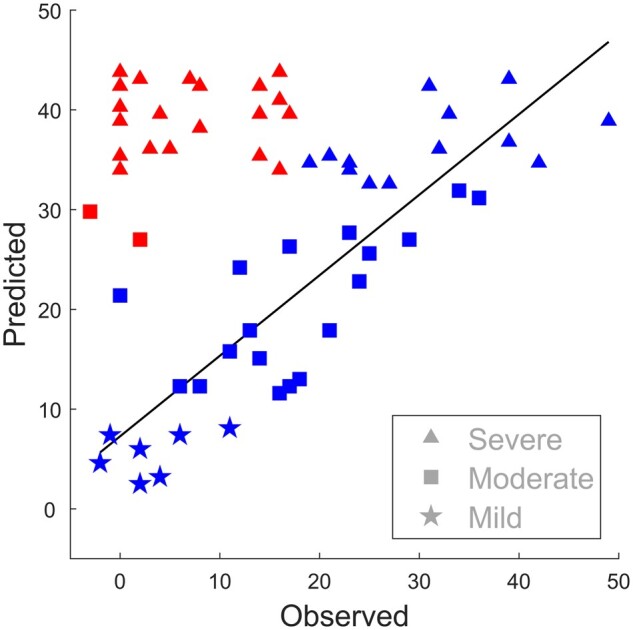
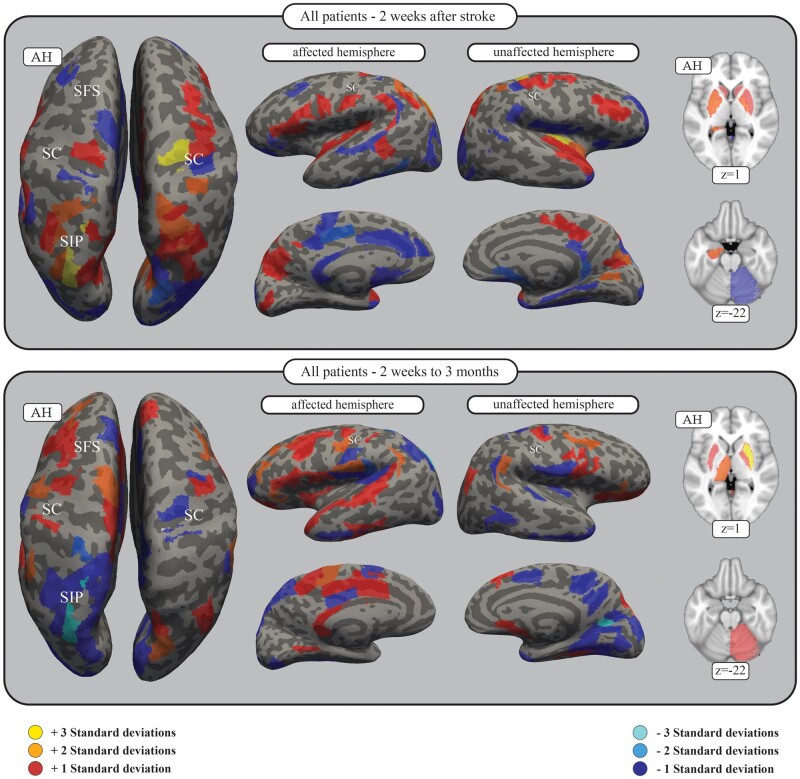
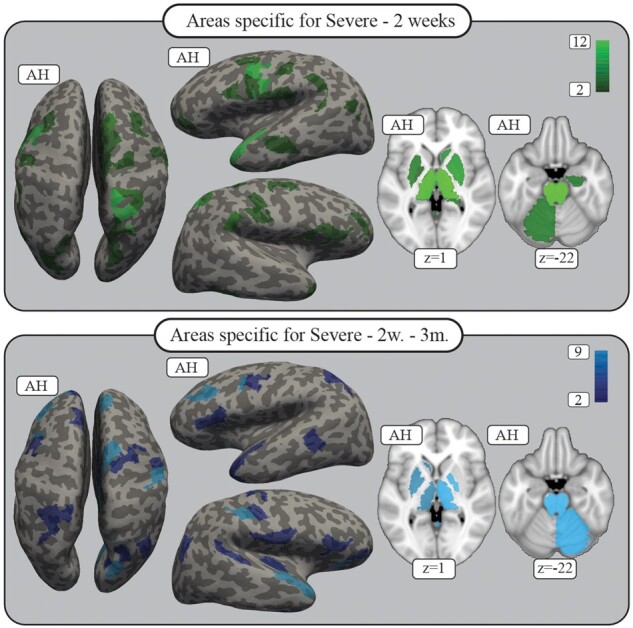
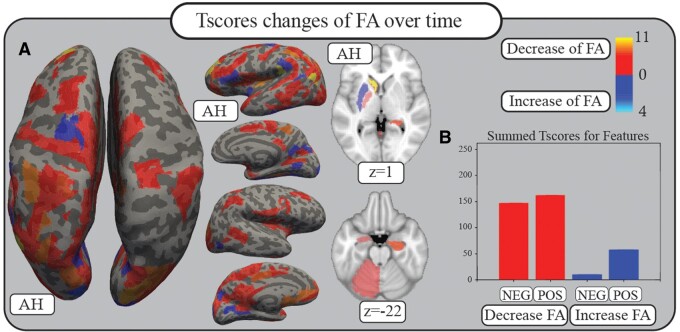
Stroke patients vary considerably in terms of outcomes: some patients present 'natural' recovery proportional to their initial impairment (fitters), while others do not (non-fitters). Thus, a key challenge in stroke rehabilitation is to identify individual recovery potential to make personalized decisions for neuro-rehabilitation, obviating the 'one-size-fits-all' approach. This goal requires (i) the prediction of individual courses of recovery in the acute stage; and (ii) an understanding of underlying neuronal network mechanisms. 'Natural' recovery is especially variable in severely impaired patients, underscoring the special clinical importance of prediction for this subgroup. Fractional anisotropy connectomes based on individual tractography of 92 patients were analysed 2 weeks after stroke (TA) and their changes to 3 months after stroke (TC - TA). Motor impairment was assessed using the Fugl-Meyer Upper Extremity (FMUE) scale. Support vector machine classifiers were trained to separate patients with natural recovery from patients without natural recovery based on their whole-brain structural connectomes and to define their respective underlying network patterns, focusing on severely impaired patients (FMUE < 20). Prediction accuracies were cross-validated internally, in one independent dataset and generalized in two independent datasets. The initial connectome 2 weeks after stroke was capable of segregating fitters from non-fitters, most importantly among severely impaired patients (TA: accuracy = 0.92, precision = 0.93). Secondary analyses studying recovery-relevant network characteristics based on the selected features revealed (i) relevant differences between networks contributing to recovery at 2 weeks and network changes over time (TC - TA); and (ii) network properties specific to severely impaired patients. Important features included the parietofrontal motor network including the intraparietal sulcus, premotor and primary motor cortices and beyond them also attentional, somatosensory or multimodal areas (e.g. the insula), strongly underscoring the importance of whole-brain connectome analyses for better predicting and understanding recovery from stroke. Computational approaches based on structural connectomes allowed the individual prediction of natural recovery 2 weeks after stroke onset, especially in the difficult to predict group of severely impaired patients, and identified the relevant underlying neuronal networks. This information will permit patients to be stratified into different recovery groups in clinical settings and will pave the way towards personalized precision neurorehabilitative treatment.
Keywords: connectivity; diffusion; recovery; stroke; structural.
© The Author(s) (2021). Published by Oxford University Press on behalf of the Guarantors of Brain.
Figures
Similar articles
-
Parietofrontal motor pathways and their association with motor function after stroke.Brain. 2015 Jul;138(Pt 7):1949-60. doi: 10.1093/brain/awv100. Epub 2015 May 1. Brain. 2015. PMID: 25935722
-
Recovery-related indicators of motor network plasticity according to impairment severity after stroke.Eur J Neurol. 2017 Oct;24(10):1290-1299. doi: 10.1111/ene.13377. Epub 2017 Aug 18. Eur J Neurol. 2017. PMID: 28833921
-
Brain network topology early after stroke relates to recovery.Brain Commun. 2022 Feb 22;4(2):fcac049. doi: 10.1093/braincomms/fcac049. eCollection 2022. Brain Commun. 2022. PMID: 35274100 Free PMC article.
-
Diffusion tensor imaging as a prognostic biomarker for motor recovery and rehabilitation after stroke.Neuroradiology. 2017 Apr;59(4):343-351. doi: 10.1007/s00234-017-1816-0. Epub 2017 Mar 14. Neuroradiology. 2017. PMID: 28293701 Review.
-
Connectivity-based approaches in stroke and recovery of function.Lancet Neurol. 2014 Feb;13(2):206-16. doi: 10.1016/S1474-4422(13)70264-3. Lancet Neurol. 2014. PMID: 24457190 Review.
Cited by
-
Localized network damage related to white matter hyperintensities is linked to worse outcome after severe stroke.Neurol Res Pract. 2025 Aug 19;7(1):57. doi: 10.1186/s42466-025-00416-w. Neurol Res Pract. 2025. PMID: 40830511 Free PMC article.
-
Toward individualized medicine in stroke-The TiMeS project: Protocol of longitudinal, multi-modal, multi-domain study in stroke.Front Neurol. 2022 Sep 26;13:939640. doi: 10.3389/fneur.2022.939640. eCollection 2022. Front Neurol. 2022. PMID: 36226086 Free PMC article.
-
Prediction of post-stroke motor recovery benefits from measures of sub-acute widespread network damages.Brain Commun. 2023 Mar 1;5(2):fcad055. doi: 10.1093/braincomms/fcad055. eCollection 2023. Brain Commun. 2023. PMID: 36938525 Free PMC article.
-
The role of corticospinal and extrapyramidal pathways in motor impairment after stroke.Brain Commun. 2022 Nov 21;5(1):fcac301. doi: 10.1093/braincomms/fcac301. eCollection 2023. Brain Commun. 2022. PMID: 36601620 Free PMC article.
-
A global effort to benchmark predictive models and reveal mechanistic diversity in long-term stroke outcomes.bioRxiv [Preprint]. 2025 Feb 17:2024.10.17.618691. doi: 10.1101/2024.10.17.618691. bioRxiv. 2025. PMID: 39464108 Free PMC article. Preprint.
References
-
- Stinear CM.Prediction of motor recovery after stroke: advances in biomarkers. Lancet Neurol. 2017;16:826–836. - PubMed
-
- Ward NS.Restoring brain function after stroke – bridging the gap between animals and humans. Nat Rev Neurol. 2017;13:244–255. - PubMed
-
- Stinear CM, Byblow WD, Ackerley SJ, Smith MC, Borges VM, Barber PA.. Proportional motor recovery after stroke: Implications for trial design. Stroke. 2017;48:795–798. - PubMed
-
- Winters C, van Wegen EEH, Daffertshofer A, Kwakkel G.. Generalizability of the proportional recovery model for the upper extremity after an ischemic stroke. Neurorehabil Neural Repair. 2015;29:614–622. - PubMed
Publication types
MeSH terms
LinkOut - more resources
Full Text Sources
Medical
