. 2021 Aug 5;184(16):4329-4347.e23.
doi: 10.1016/j.cell.2021.06.023. Epub 2021 Jul 7.

Molecular topography of an entire nervous system

Affiliations

Molecular topography of an entire nervous system

Seth R Taylor et al. Cell. .

Abstract

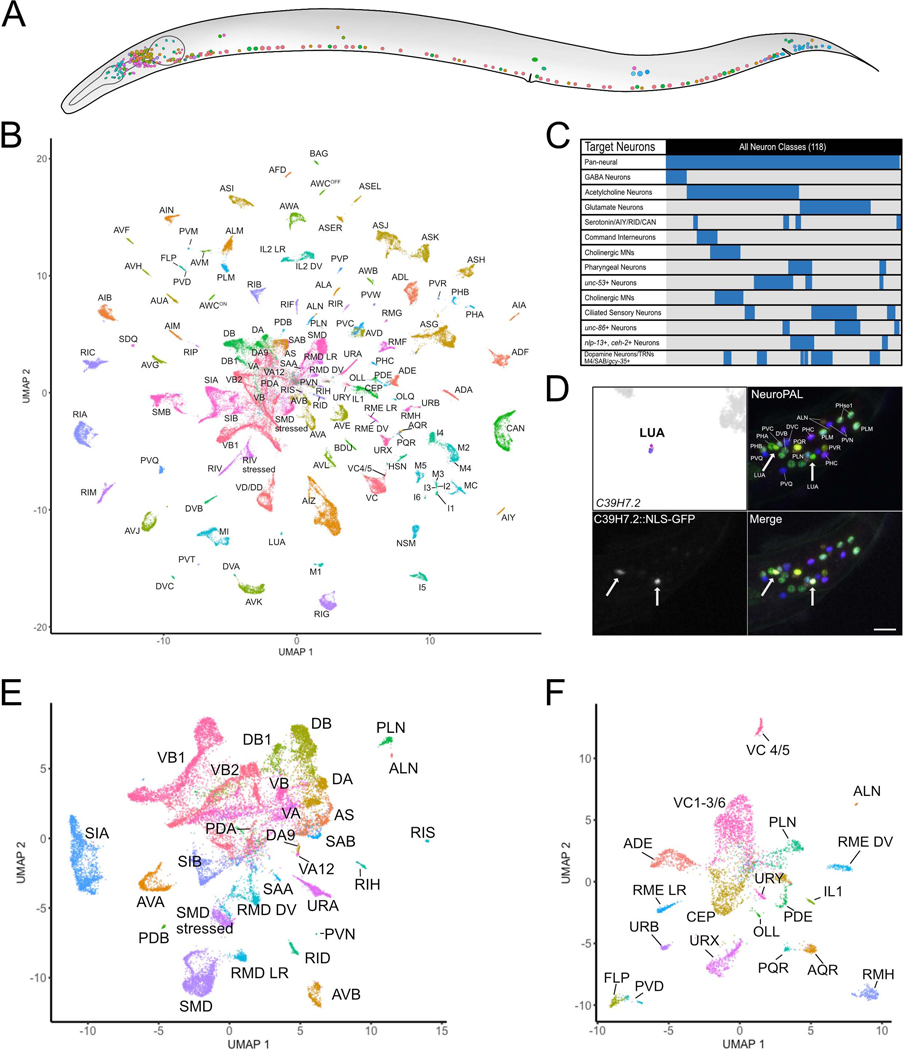
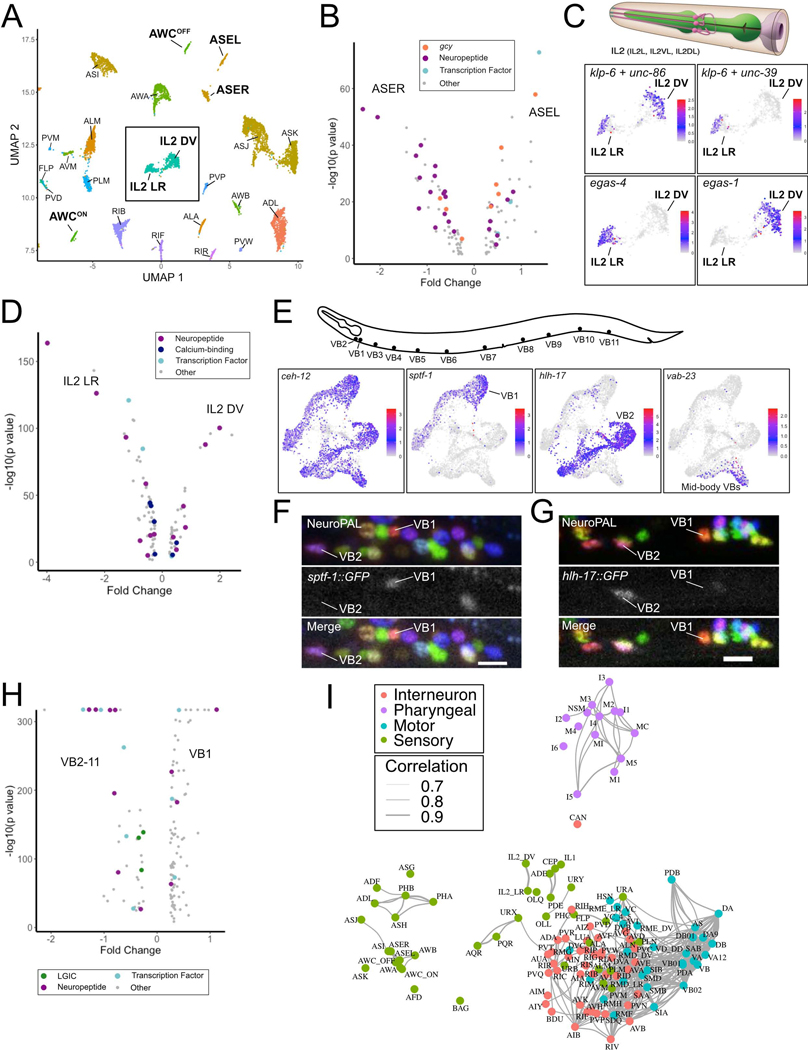
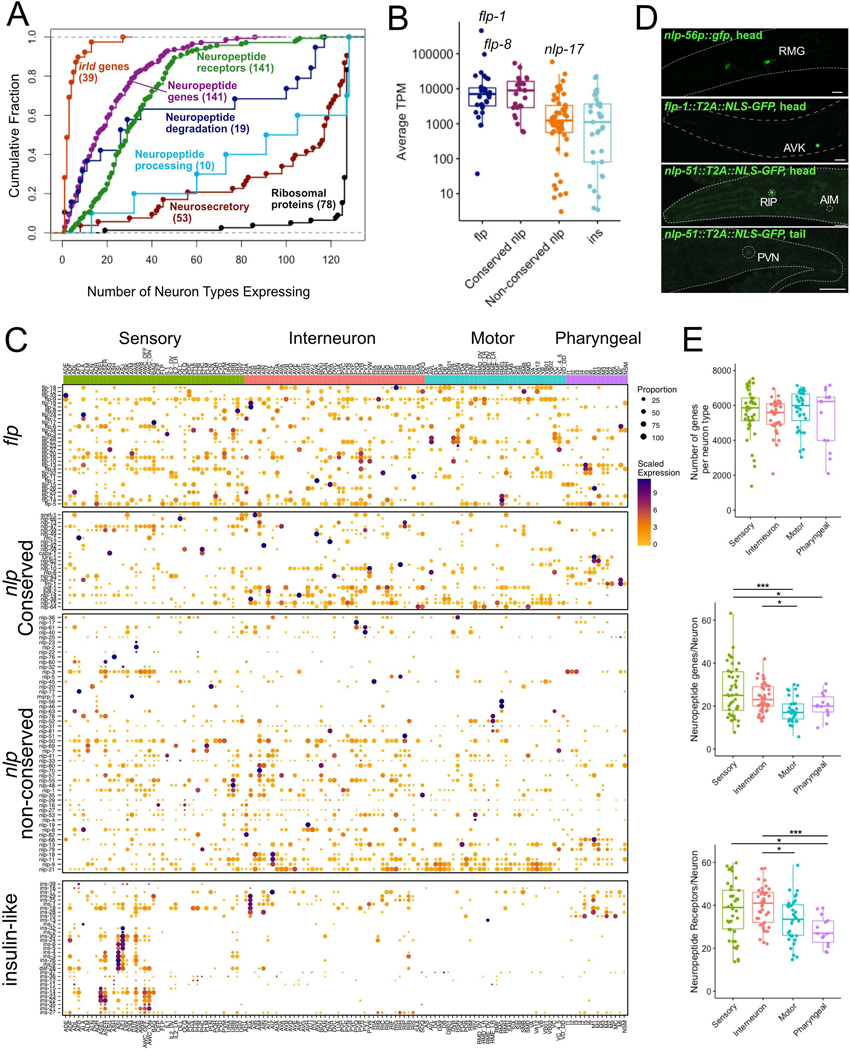
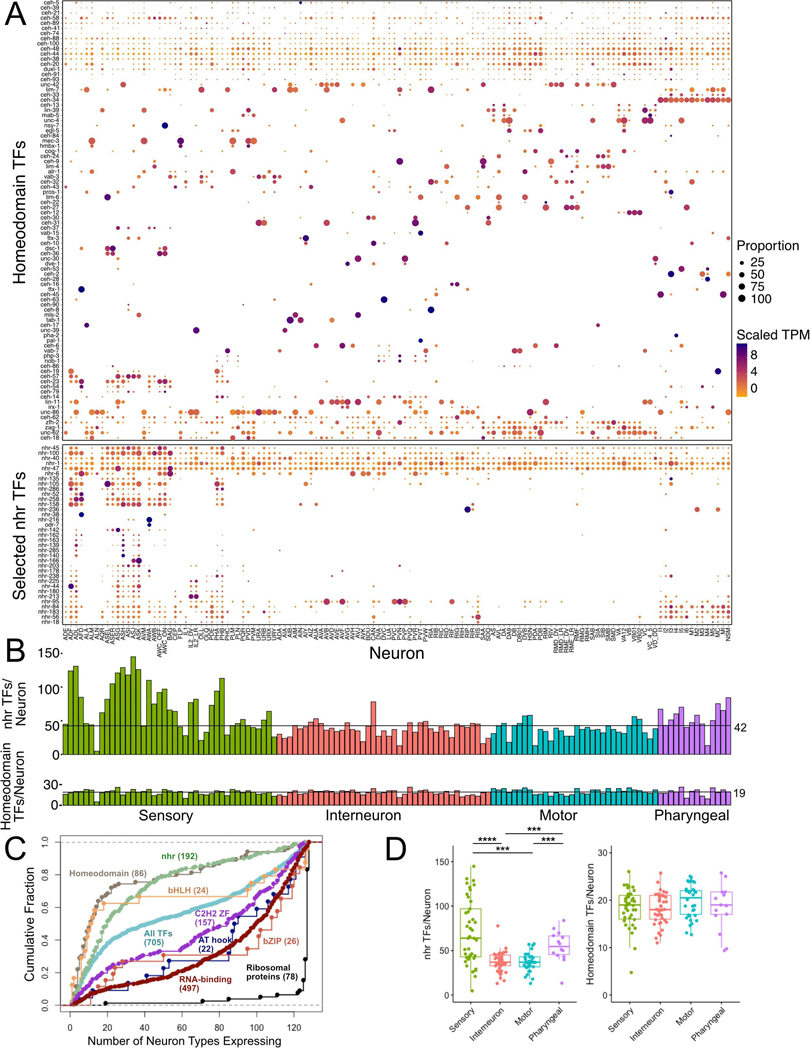
We have produced gene expression profiles of all 302 neurons of the C. elegans nervous system that match the single-cell resolution of its anatomy and wiring diagram. Our results suggest that individual neuron classes can be solely identified by combinatorial expression of specific gene families. For example, each neuron class expresses distinct codes of ∼23 neuropeptide genes and ∼36 neuropeptide receptors, delineating a complex and expansive "wireless" signaling network. To demonstrate the utility of this comprehensive gene expression catalog, we used computational approaches to (1) identify cis-regulatory elements for neuron-specific gene expression and (2) reveal adhesion proteins with potential roles in process placement and synaptic specificity. Our expression data are available at https://cengen.org and can be interrogated at the web application CengenApp. We expect that this neuron-specific directory of gene expression will spur investigations of underlying mechanisms that define anatomy, connectivity, and function throughout the C. elegans nervous system.

Keywords: C. elegans; RNA-seq; cell adhesion molecules; connectome; gene regulatory motifs; neuron; neuropeptides; single-cell.


Conflict of interest statement

Declaration of interests The authors declare no competing interests.

Figures

Figure 1.
Figure 1.. All known neuron types in the C. elegans nervous system are identified as individual clusters of scRNA-seq profiles.
A) All neuron types in the mature C. elegans hermaphrodite. B) UMAP projection of 70,296 neurons with all neuron types and sub-types of ten anatomically defined classes. Neuron identities were assigned based on the expression of known marker genes (Table S1, Figure S3). C) Graphical representation of neurons targeted in individual experiments. D) (top left) The LUA cluster exclusively expressed C39H7.2. Confocal image showing expression of transcriptional reporter C39H7.2::NLS-GFP in LUA neurons (LUAL and LUAR) (arrows) in tail region of NeuroPAL strain. Scale bar = 10 μm. E) Sub-UMAP of central group of cells in B. Clusters are annotated by cell types. F) Sub-UMAP of several commingled neurons in B that clearly separates closely related neuron types (e.g., FLP vs PVD) into individual clusters. See also Figure S1, S2, S3.
Figure 2.
Figure 2.. Identification of neuron sub-types.
A) UMAP of neurons with molecularly distinct subtypes (bold labels) from neuronal UMAP (Figure 1B). Inset denotes IL2 DV and IL2 LR clusters. B) Volcano plot of differentially expressed genes (FDR < 0.05) for ASER vs ASEL. Guanylyl cyclases (gcy), neuropeptides, and transcription factors are marked. C) (Top) 3 pairs of IL2 sensory neurons (IL2L/R, IL2VL/R, IL2DL/R) from WormAtlas. (Bottom) UMAP inset from A showing normalized expression of marker genes for all IL2 neurons (klp-6, unc-86), IL2 LR (unc-39, egas-4) and IL2 DV (egas-1). D) Volcano plot of differentially expressed genes (FDR < 0.05) between IL2 sub-types. E) (Top) VB motor neuron soma in the ventral nerve cord. (Bottom) sub-UMAPs of VB neurons highlighting VB marker (ceh-12) and genes (sptf-1, hlh-17, vab-23) expressed in specific VB sub-clusters. F) Confocal images in NeuroPAL show sptf-1::GFP expression in VB1 but not VB2 and G) selective expression of hlh-17::GFP in VB2 but not VB1. Scale bars = 10 μm. H) Volcano plot of differentially expressed genes (LGICs –ligand-gated ion channels) (FDR < 0.05) for VB1 vs all other VB neurons. I) C. elegans neuron types in a force-directed network by transcriptomic similarities. Colors denote distinct neuron modalities and widths of edges (Pearson correlation coefficients > 0.7) show strengths of transcriptome similarity between each pair of neuron types. See also Figure S4.
Figure 3.
Figure 3.. Expression of neuropeptide signaling genes.
A) Cumulative distribution plot of neuron types expressing different classes of neuropeptide signaling genes. Each dot is a gene, genes expressed in the same number of neuron types overlap. Numbers in parentheses denote the sum of genes in each category. B) Average expression (TPM) for neuropeptide subfamilies across neuron types. flp-1, flp-8, nlp-17 are highly expressed. Boxplot spans 25th percentile, median and 75th percentile. C) Heatmap (rows) for flp (FMRFamide-related peptide), nlp (neuropeptide-like protein) and ins (insulin-like peptide) subfamilies across 128 neuron types (columns) grouped by functional/anatomical modalities (Sensory, Interneuron, Motor, Pharyngeal). Conserved nlp genes are shown separately. Rows are clustered within each family. Circle diameter denotes the proportion of neurons in each cluster that expresses a given gene. D) GFP reporters confirm selective expression of nlp-56 (promoter fusion) in RMG, flp-1 (CRISPR reporter) in AVK, and nlp-51 (CRISPR reporter) in RIP, with weaker expression in PVN and AIM. Scale bars = 10 μm. E) Number of all genes (top), neuropeptides (middle) and neuropeptide receptors (bottom) per neuron, grouped by neuron modality. Boxes are interquartile ranges. ANOVA, with Tukey post-hoc comparisons for neuropeptide receptors, Kruskal-Wallis test for other comparisons. *p < 0.05, ***p < 0.001. See also Figure S6, Data S1.
Figure 4.
Figure 4.. Expression of transcription factor families.
A) Heatmap of homeodomain and representative subset of nuclear hormone receptor (nhr) transcription factors (TFs) across 128 neuron types (columns) grouped by neuron modality. TFs are clustered for each subfamily. Circle diameter represents the proportion of neurons in each cluster that expresses a given gene. B) Bar graphs of number of nhr and Homeodomain TFs in each neuron type, grouped by neuron modality. C) Cumulative distribution of number of neuron types expressing Homeodomain, bHLH, nhr, C2H2 ZF (Zinc Finger), AT hook, bZIP transcription factor (TF) families, RNA binding proteins and ribosomal proteins (see also Figure 3A). D) Quantitative comparison of TFs per neuron for nhr (left) and Homeodomain TFs (right) shows enrichment in sensory neurons for nhrs, but no differences for Homeodomains. Boxplots are median and interquartile range (25th – 75th percentile), Kruskal-Wallis. ***p < 0.001, ****p < 0.0001. See also Data S1.
Figure 5.
Figure 5.. Comparison of bulk and single-cell RNA-Seq.
A) Heatmap for enrichment of scRNA-Seq neuron-type marker genes (Methods) (columns) in bulk RNA-Seq data for each neuron type (ASG, AVG, AWB, AWA, AVE, PVD, DD, VD) vs expression in all neurons. P-values < 0.001 for all comparisons except for AVE markers (all comparisons p-value > 0.05). B) Split violin plot quantifying detection of different RNA classes in bulk and scRNA-seq data sets for neuron types in A. C-D) Heatmaps showing the number of differentially expressed genes (C) and differential splicing events (D) in pairwise comparisons of bulk RNA-seq datasets. E) Gene model and alternative splicing for mca-3. Inset, Sashimi plot shows alternative splicing of specific exon (arrowhead) in ASG vs VD. F) Gene model and alternative splicing of mbk-2. Inset, Sashimi plot shows detection of previously undescribed, alternatively spliced exon (arrowhead) in AWA but not in DD or pan neuronal bulk RNA-Seq. For Sashimi plots in E and F, vertical bars represent exonic reads and arcs indicate the number of junction-spanning reads. See also Table S4.
Figure 6.
Figure 6.. Cis-regulatory elements in neuronal transcriptomes.
A) FIRE results for AWA neuron, featuring the motif logo, location (5’ or 3’), mutual information, z-scores from randomization-based statistical test and matching transcription factors. Genes were grouped into seven bins based on relative expression from lowest (left) to highest (right). Heatmap denotes over-representation (yellow) or under-representation (blue) of each motif (rows) in genes within each bin. Significant over-representation is indicated by red outlines, whereas significant under-representation is indicated by blue outlines. Transcription factors in red are expressed in AWA. B) Heatmap for enrichment of clustered motifs (rows) in each neuron class (columns). Red denotes enrichment in genes with highest relative expression, whereas blue indicates enrichment in genes with lowest relative expression (see Methods). Color intensity represents log10(p-value) from hypergeometric test. Motif families and neurons are ordered by similarity. Color bar across x-axis indicates neuron modality. Arrows denote motif families featured in panel D. C) Volcano plot showing log fold ratio and -log10 p-value for all motif family-neuron associations. Significant associations with p-value < 1e-5 and log fold ratio > 0.5 (3111) or < −0.5 (774) are noted. D) Eight selected motif families with significant associations with neurons from panel C: Motif families: E-box motifs (85 and 215), motifs for nhrs (100), homeodomains (246), and a previously undescribed motif (243). Asterisks denote significant associations. See also Figure S7.
Figure 7.
Figure 7.. Differential expression of cell adhesion molecules among neurons and their presynaptic partners.
A) (Left) The C. elegans nerve ring. (Right) AIA ring interneuron. From WormAtlas. B) Neurons with presynaptic input to AIA (right) and neurons with membrane contact but no synapses with AIA (left). C) Heatmap of 20 cell adhesion molecule (CAM) gene pairs with highest log fold change in AIA + presynaptic inputs vs AIA + non-synaptic adjacent neurons (right of vertical red line). 20 CAM gene pairs with highest log fold change in AIA + non-synaptic adjacent neurons vs AIA + presynaptic partners (left of vertical red line). Arrows denote gene pairs common for AIA and AIY (panel E). D) Correlation matrix for CAM usage (see text) across all neurons in the nerve ring (84 neuron types). Arrows indicate AIA and AIY (correlation = 0.568). E) Heatmap as in C, for AIY. Arrows denote gene pairs common for AIA and AIY. F) Membrane adjacency matrix was grouped by nerve ring strata (each outlined with red box) (Moyle et al., 2021). Within each stratum, neurons were ordered according to CAM usage correlations (see panel H). G) Strata ordering as in F was imposed upon the chemical connectome revealing that most synapses are detected between neurons within the same stratum. H) The CAM usage correlation matrix (as in D) was grouped by strata, then sorted by similarity within each stratum. CAM usage is broadly shared for neurons in strata 1 and 4. Stratum 3 shows two distinct populations. See also Methods S1.

Similar articles

Cited by

References

    1. 10X Genomics (2017). Application Note - Transcriptional Profiling of 1.3 Million Brain Cells with the Chromium Single Cell 3’ Solution.
    1. Adorjan I, Tyler T, Bhaduri A, Demharter S, Finszter CK, Bako M, Sebok OM, Nowakowski TJ, Khodosevich K, Møllgård K, et al. (2019). Neuroserpin expression during human brain development and in adult brain revealed by immunohistochemistry and single cell RNA sequencing. J. Anat. 235, 543–554. - PMC - PubMed
    1. Albertson DG, and Thomson JN (1976). The pharynx of Caenorhabditis elegans. Philos. Trans. R. Soc. Lond. B. Biol. Sci. 275, 299–325. - PubMed
    1. Allen AM, Neville MC, Birtles S, Croset V, Treiber CD, Waddell S, Goodwin SF, and Mann RS (2020). A single-cell transcriptomic atlas of the adult Drosophila ventral nerve cord. Elife 9, e54074. - PMC - PubMed
    1. Arzalluz-Luqueángeles, and Conesa A. (2018). Single-cell RNAseq for the study of isoform-show is that possible? Genome Biol. 110. - PMC - PubMed

Publication types

MeSH terms