. 2021 Jul 22;184(15):3899-3914.e16.
doi: 10.1016/j.cell.2021.05.023. Epub 2021 Jul 7.

Translocated microbiome composition determines immunological outcome in treated HIV infection

Affiliations

Translocated microbiome composition determines immunological outcome in treated HIV infection

Krystelle Nganou-Makamdop et al. Cell. .

Abstract

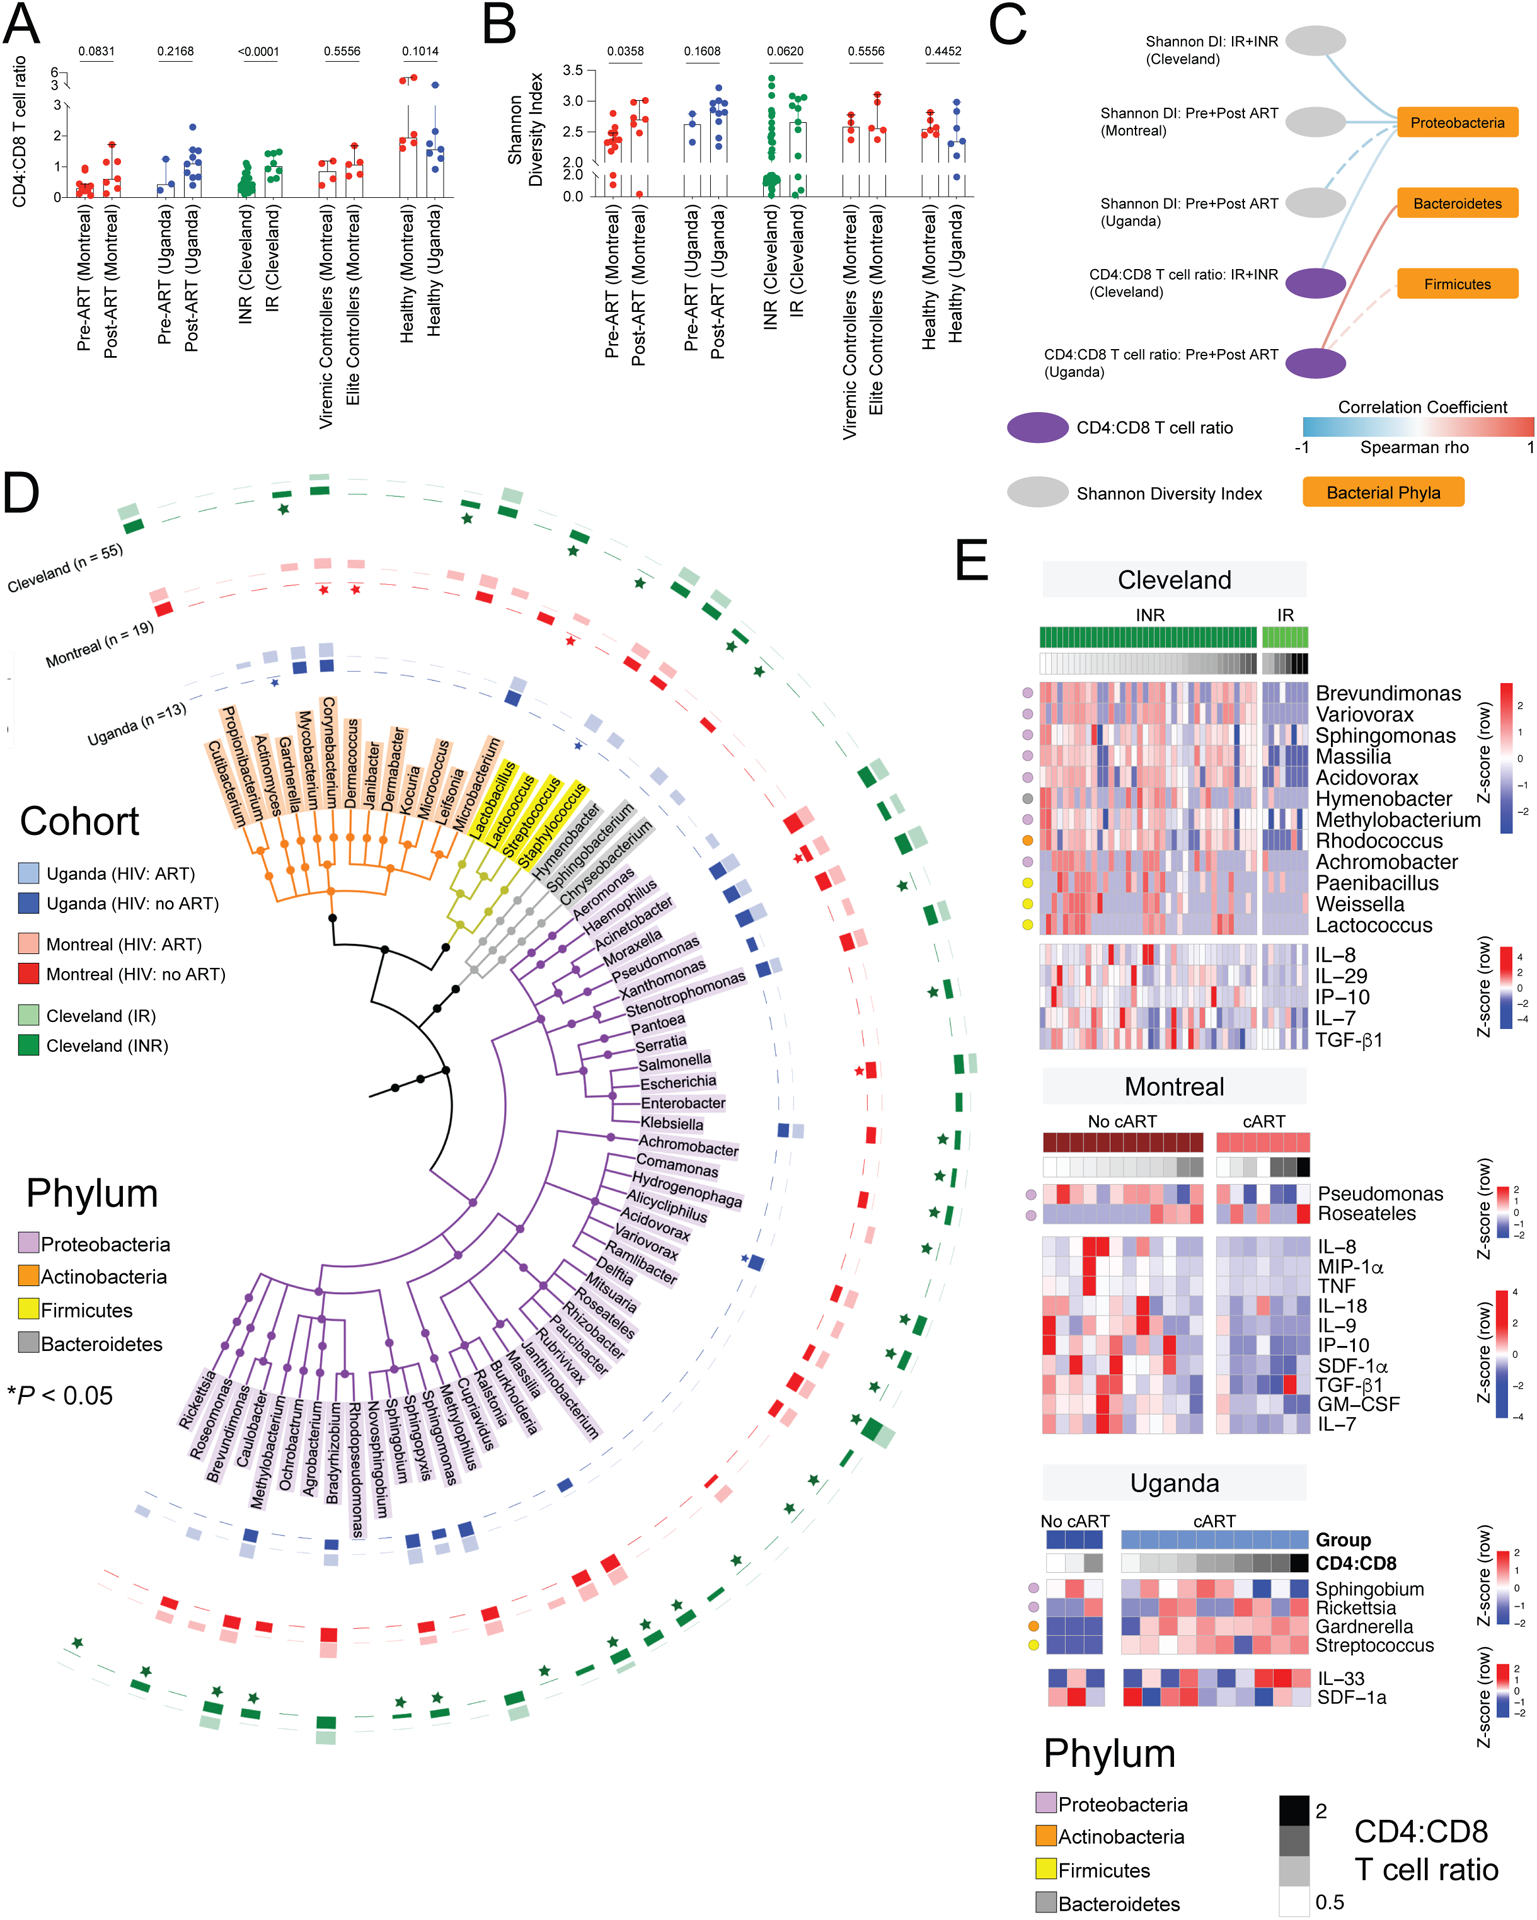
The impact of the microbiome on HIV disease is widely acknowledged although the mechanisms downstream of fluctuations in microbial composition remain speculative. We detected rapid, dynamic changes in translocated microbial constituents during two years after cART initiation. An unbiased systems biology approach revealed two distinct pathways driven by changes in the abundance ratio of Serratia to other bacterial genera. Increased CD4 T cell numbers over the first year were associated with high Serratia abundance, pro-inflammatory innate cytokines, and metabolites that drive Th17 gene expression signatures and restoration of mucosal integrity. Subsequently, decreased Serratia abundance and downregulation of innate cytokines allowed re-establishment of systemic T cell homeostasis promoting restoration of Th1 and Th2 gene expression signatures. Analyses of three other geographically distinct cohorts of treated HIV infection established a more generalized principle that changes in diversity and composition of translocated microbial species influence systemic inflammation and consequently CD4 T cell recovery.

Keywords: HIV; antiretroviral therapy; inflammation; microbiome; systems biology.


Conflict of interest statement

Declaration of interests The authors declare no competing interests.

Figures

Figure 1.
Figure 1.. Three independent plasma cytokine clusters differently correlate with each other and with CD4:CD8 T cell ratio.
(A) Principal component analysis bi-plot of plasma cytokine levels. Filled circles represent individual participants; color codes represent timepoints on cART. Arrows reflect the loading of each cytokine and the length of the arrows approximates the variance of the cytokines contributing to the distinction between timepoints. (B-D) Three independent clusters of cytokines as determined by the gap-statistic approach (B: cluster 1; C: cluster 2; D: cluster 3). The y-axis represents the log10 concentration in pg/ml and the red line denotes median levels over time. The blue line denotes median value of 20 HIV-uninfected Ugandans. (E) Summarized cytokine levels per cluster over time. In panels B-E, filled circles represent individual participants; pink and blue shading indicate significant increase and decrease respectively (P < 0.05). (F) Association between CD4:CD8 T cell ratio and the cytokine clusters from baseline to month 12, and from month 12 to month 24. Pink and blue shading represent positive and negative correlation with change in CD4:CD8 T cell ratio respectively (P < 0.05, Spearman’s test). Only significantly altered timepoints are represented.
Figure 2.
Figure 2.. The diversity of microbial nucleic acids in plasma changes overtime and the abundances in Actinobacteria, Bacteroidetes and Firmicutes correlate with each other and inversely with the abundance of Proteobacteria.
(A) Beta-diversity assessed using the Bray-Curtis (BC) distance of the abundances (TPM) and hierarchical clustering on the BC distance using average linkage clustering. (B) Alpha-diversity assessed using the Shannon diversity index over time. Each dot represents a participant and color key for participants is the same as in Figure 1. Pink and blue shading indicate significant increase and decrease respectively (P < 0.05; paired Wilcoxon rank-sum test). (C) Box and jitter plots of the abundance of microbial nucleic acids identified as bacterial, eukaryotic and viral. Timepoints are presented in separate grids; colored dots represent individual participants. Pie-charts represent relative abundances at each timepoint. (D) Correlation heatmap of the phyla Proteobacteria, Actinobacteria, Bacteroidetes and Firmicutes. The color gradient represents the Spearman correlation coefficient at P < 0.05.
Figure 3.
Figure 3.. The relative abundance of the predominant genus Serratia correlates with higher inflammation.
(A) Genus level abundances of Proteobacteria, Actinobacteria, Bacteroidetes and Firmicutes calculated as the median TPM across all timepoints for each genus. Columns represent individual participants and rows represent genera. Circles size denotes log10(median abundance across time). (B) Projection-based integrative analysis between the abundance of Serratia and cluster 1–3 cytokines. (C) Pearson correlation (based on the projection-based integrative analysis) between ratio of Serratia to other bacteria (phyla Proteobacteria, Actinobacteria, Bacteroidetes and Firmicutes) and cluster 1–3 cytokines. In panels B and C, pink and blue edges respectively indicate significant positive or negative Pearson correlation (P < 0.05). (D) PCA analysis bi-plot of in vitro cytokine responses to bacterial stimuli (B. fragilis, C. ihumii, L. plantarum, LPS, P. aeruginosa and S. marcescens). Filled circles represent individual donors and are color-coded by the stimuli. Arrows reflect the loading of each cytokine and the length of the arrows approximates the variance of the cytokines contributing to the distinction between stimuli. (E) Box and jitter plots of supernatant cytokine concentrations after in vitro stimulation with bacteria.
Figure 4.
Figure 4.. Elevated Serratia ratio associates with higher inflammatory gene signatures.
(A-C) Heatmaps of gene expression of distinct pathways measured in sorted monocytes and T cells at months 0, 3, 12 and 24 on cART. Rows represent enriched genes and columns represent individual participants. Color gradient shows the z-scored gene expression across samples; red and blue indicate increased and decreased expression between timepoints respectively. The Serratia ratio (Log2 Serratia/Others) per sample is shown as a color gradient bar (red = high ratio; blue = low ratio) and the summarized cluster cytokine expression is represented by bar plots above the heatmaps. A: Inflammatory response pathways in sorted monocytes; B: Th1, Th2 and Th17 gene signatures in sorted T cells; C: Metabolic pathways including hypoxia, glycolysis and mitochondrial function-associated genes in sorted monocytes. *Carnitine synthesis refers to genes involved in carnitine synthesis and transfer of acetyl groups into mitochondria. (D) Spearman correlation network of the Serratia ratio, plasma metabolites, SLEA z-score of the transcriptional metabolic pathways and CD4:CD8 T cell ratio across baseline and months 3, 12 and 24 at P < 0.05. Carnitines abbreviations: DPC - docosapentaenoylcarnitine (C22), AC - arachidonoylcarnitine (C20), DLC - dihomo-linolenoylcarnitine (C20), EC - eicosenoylcarnitine (C20), LC - eicosenoylcarnitine (C20), OC - oleoylcarnitine (C18), PC - palmitoylcarnitine (C16). Edges represent significant positive (red) and negative (blue) correlations; the color gradient indicates the strength of the correlation coefficient. Edge to the acylcarnitines = average correlation coefficient across all acylcarnitines.
Figure 5.
Figure 5.. Chord diagram of the relationships between Serratia ratio, transcriptional gene signatures, plasma cytokines, plasma metabolites and CD4:CD8 T cell ratio.
Red and blue lines represent significant positive and negative correlations respectively (Spearman’s test P < 0.05) and darker shades indicate greater correlation coefficient. Thick lines indicate correlation with CD4:CD8 T cell ratio. Abbreviations: LC-Acylcarnitines – long-chain acylcarnitines; MFAO - Mitochondrial Fatty Acid Oxidation; OxPhos - Oxidative Phosphorylation; Carnitine synthesis and Transfer of acetyl groups into mitochondria; TF targets – transcription factor targets.
Figure 6.
Figure 6.. Bacterial nucleic acids and inflammation in plasma of the independent cohorts associate with CD4:CD8 T cell ratio.
(A) CD4:CD8 T cell ratio and (B) Shannon diversity index of plasma nucleic acids. IR: immune responders; INR: immune non-responders. (C) Correlation between abundances of Actinobacteria, Bacteroidetes, Firmicutes, Proteobacteria, the Shannon diversity index and CD4:CD8 T cell ratio. Edges represent significant positive (red) and negative (blue) correlations; the color gradient indicates the strength of the correlation coefficient. (D) Taxonomy tree of all genera with abundance >0 TPM. Each genus label and tree leaf is colored based on bacterial phyla annotation. Bar plots in the concentric circles represent log(TPM+1) value for each genus in IR/INR or pre/post-cART cohorts; an asterisk denotes genera with P < 0.05. (E) Heatmaps of significant associations (P < 0.05) between CD4:CD8 T cell ratio and plasma cytokine levels (Z-score row normalized pg/mL) or abundances of bacterial genera (Z-score row normalized log(TPM+1)). Colored circles to the left of the heatmaps show phyla annotations for each genus.

References

    1. Acosta-Rodriguez EV, Napolitani G, Lanzavecchia A, and Sallusto F (2007). Interleukins 1beta and 6 but not transforming growth factor-beta are essential for the differentiation of interleukin 17-producing human T helper cells. Nat Immunol 8, 942–949. - PubMed
    1. Antiretroviral Therapy Cohort C (2008). Life expectancy of individuals on combination antiretroviral therapy in high-income countries: a collaborative analysis of 14 cohort studies. Lancet 372, 293–299. - PMC - PubMed
    1. Antonelli LR, Mahnke Y, Hodge JN, Porter BO, Barber DL, DerSimonian R, Greenwald JH, Roby G, Mican J, Sher A, et al. (2010). Elevated frequencies of highly activated CD4+ T cells in HIV+ patients developing immune reconstitution inflammatory syndrome. Blood 116, 3818–3827. - PMC - PubMed
    1. Bettelli E, Carrier Y, Gao W, Korn T, Strom TB, Oukka M, Weiner HL, and Kuchroo VK (2006). Reciprocal developmental pathways for the generation of pathogenic effector TH17 and regulatory T cells. Nature 441, 235–238. - PubMed
    1. Bolger AM, Lohse M, and Usadel B (2014). Trimmomatic: a flexible trimmer for Illumina sequence data. Bioinformatics 30, 2114–2120. - PMC - PubMed

Publication types

MeSH terms