. 2021;12(5):1809-1830.
doi: 10.1016/j.jcmgh.2021.07.001. Epub 2021 Jul 6.

Human AGR2 Deficiency Causes Mucus Barrier Dysfunction and Infantile Inflammatory Bowel Disease

Collaborators, Affiliations

Human AGR2 Deficiency Causes Mucus Barrier Dysfunction and Infantile Inflammatory Bowel Disease

Ahmad A Al-Shaibi et al. Cell Mol Gastroenterol Hepatol. 2021.

Erratum in

  • Corrections.
    [No authors listed] [No authors listed] Cell Mol Gastroenterol Hepatol. 2024;17(4):670. doi: 10.1016/j.jcmgh.2024.02.005. Epub 2024 Feb 21. Cell Mol Gastroenterol Hepatol. 2024. PMID: 38383221 Free PMC article. No abstract available.

Abstract

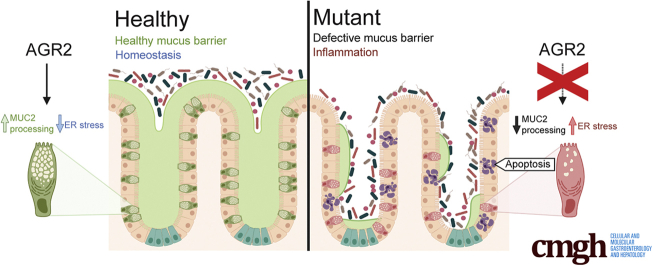
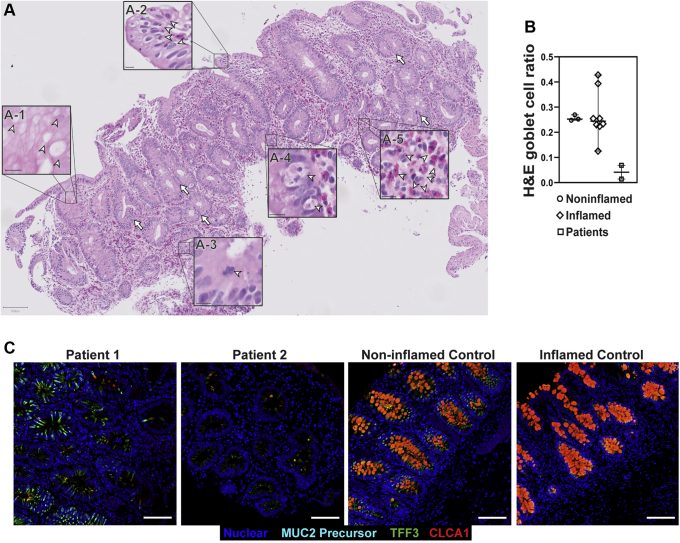
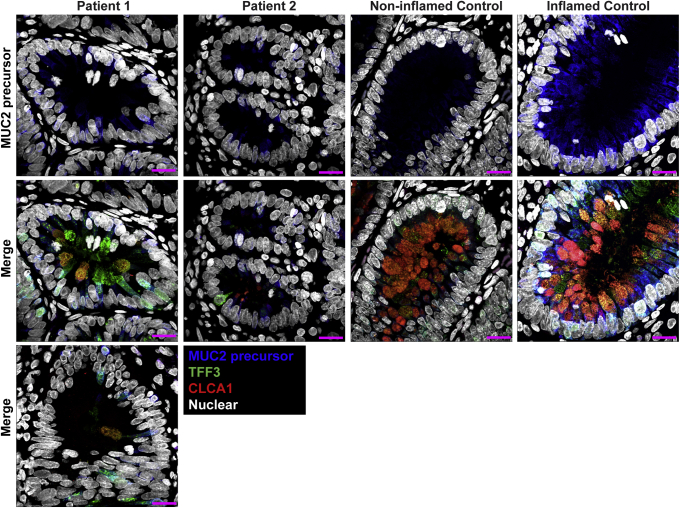
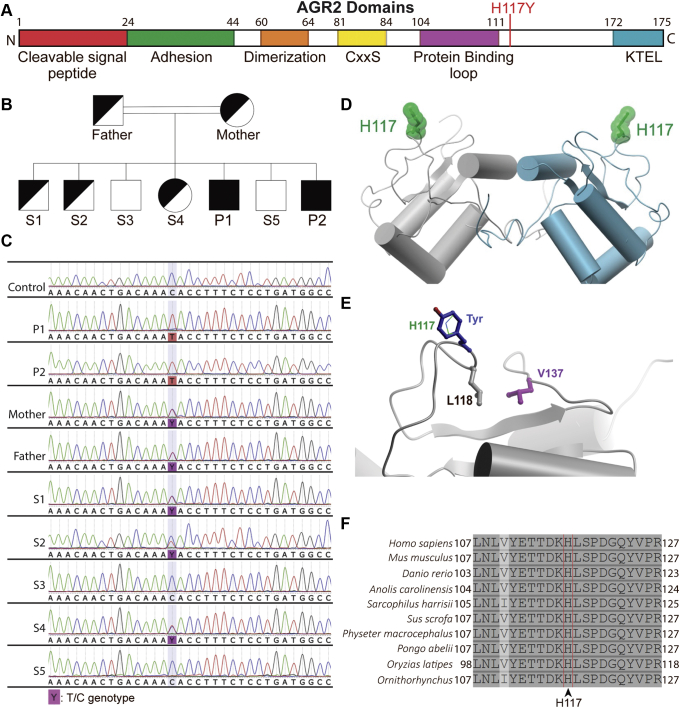
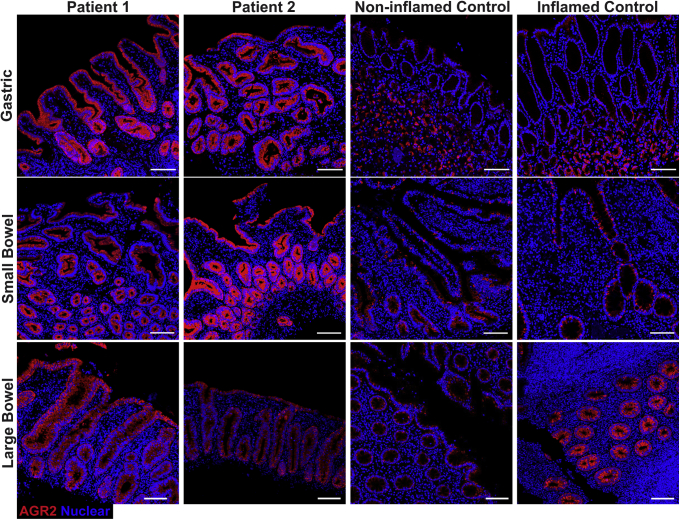
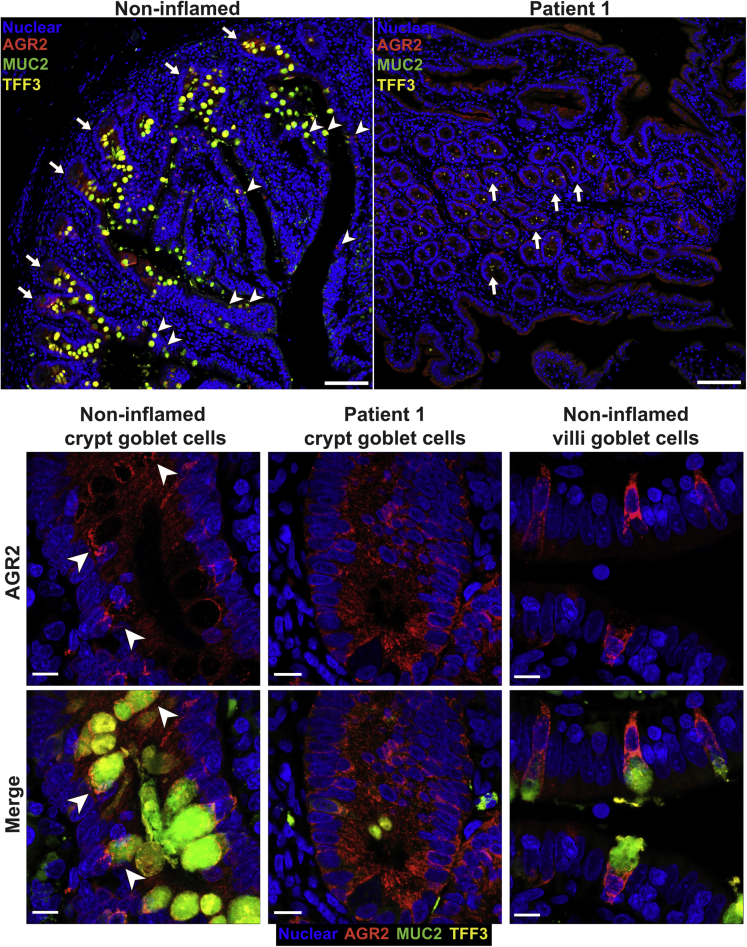
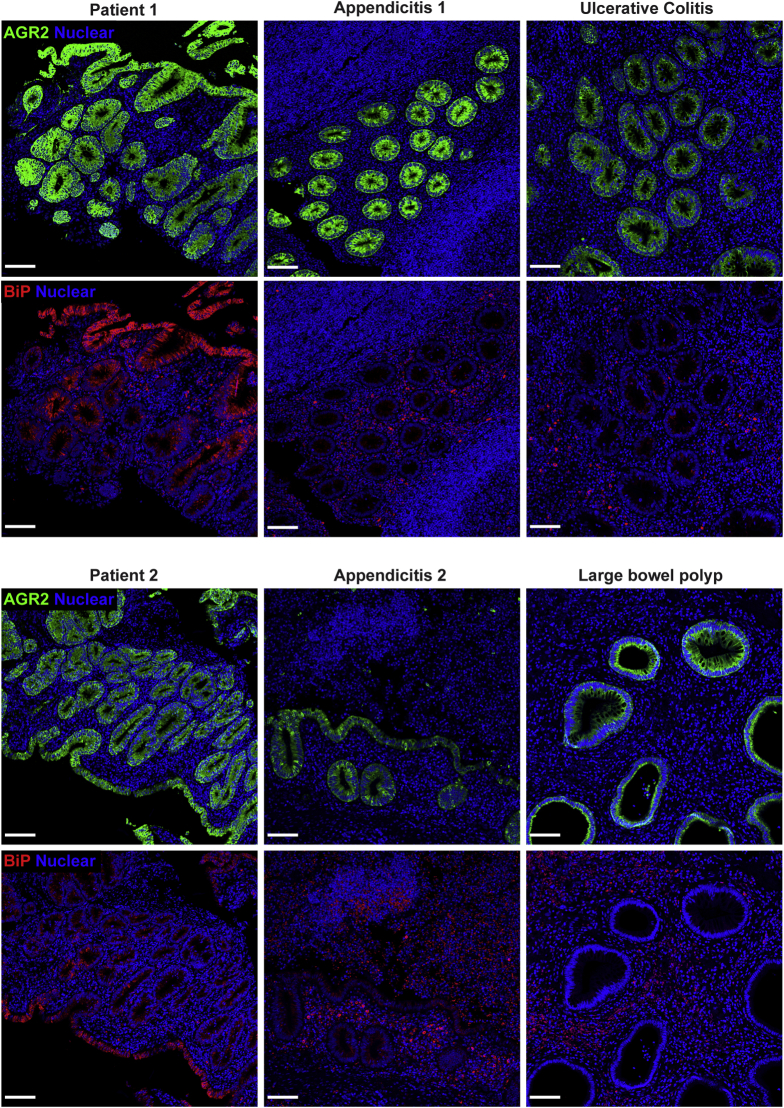
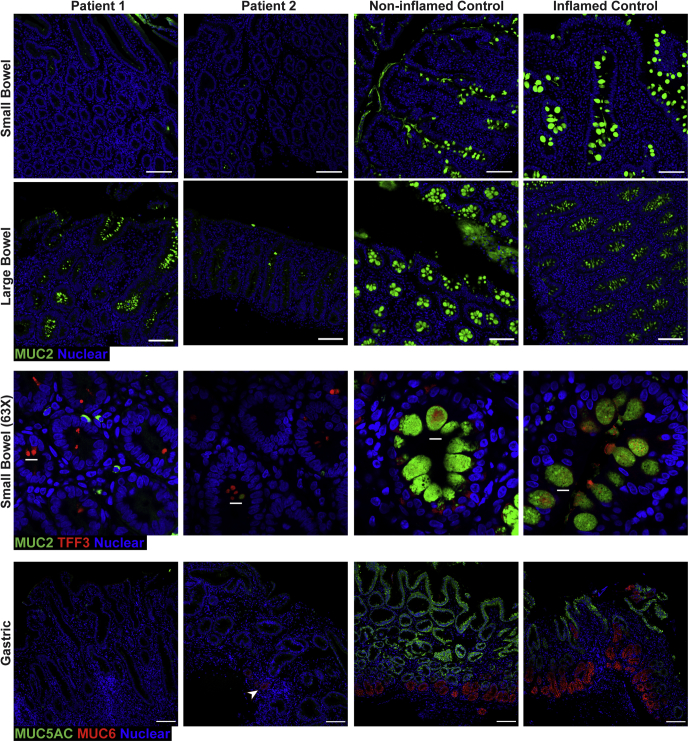
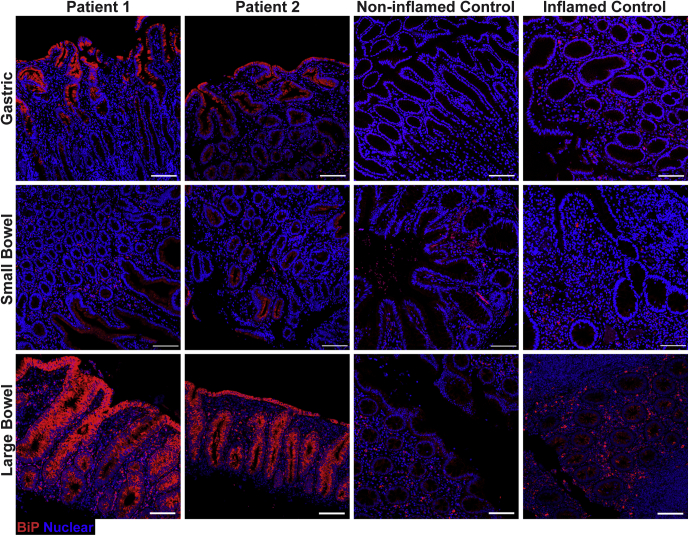
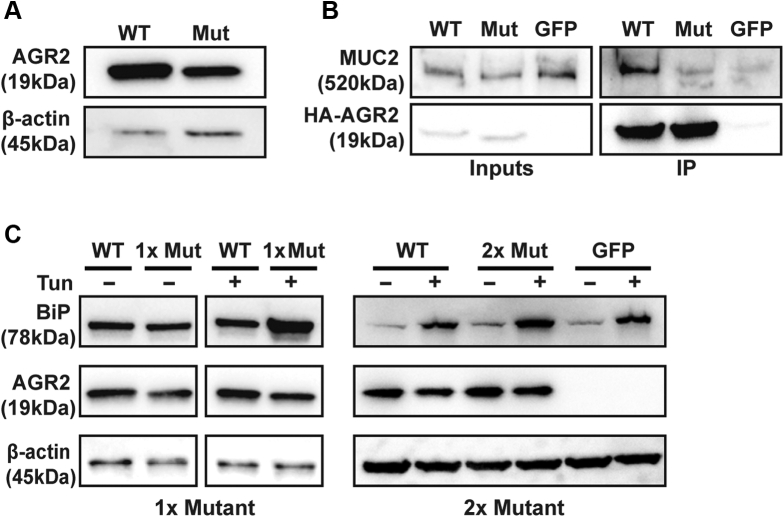
Background & aims: The gastrointestinal epithelium plays a crucial role in maintaining homeostasis with the gut microbiome. Mucins are essential for intestinal barrier function and serve as a scaffold for antimicrobial factors. Mucin 2 (MUC2) is the major intestinal gel-forming mucin produced predominantly by goblet cells. Goblet cells express anterior gradient 2 (AGR2), a protein disulfide isomerase that is crucial for proper processing of gel-forming mucins. Here, we investigated 2 siblings who presented with severe infantile-onset inflammatory bowel disease.

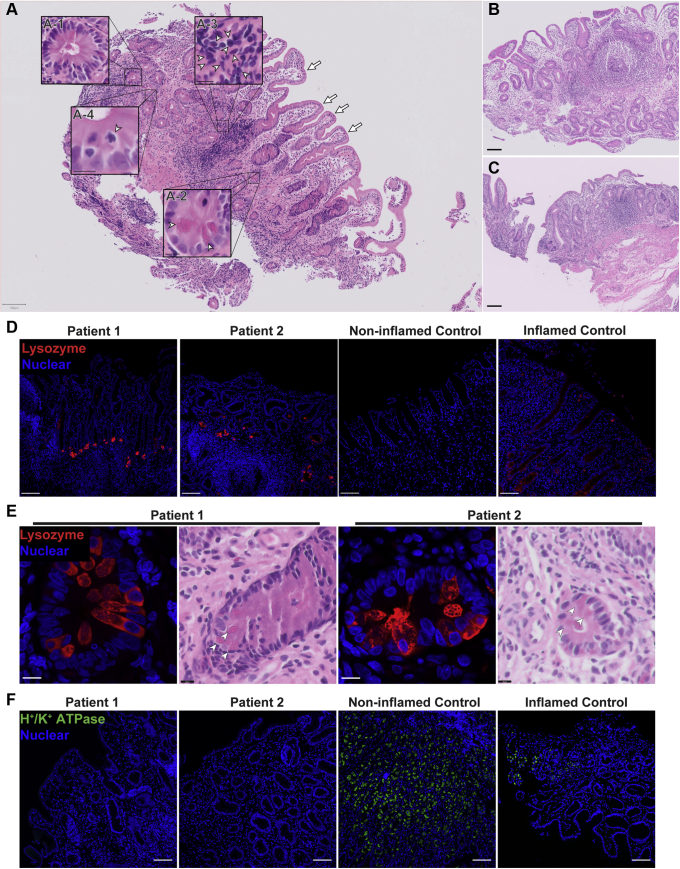
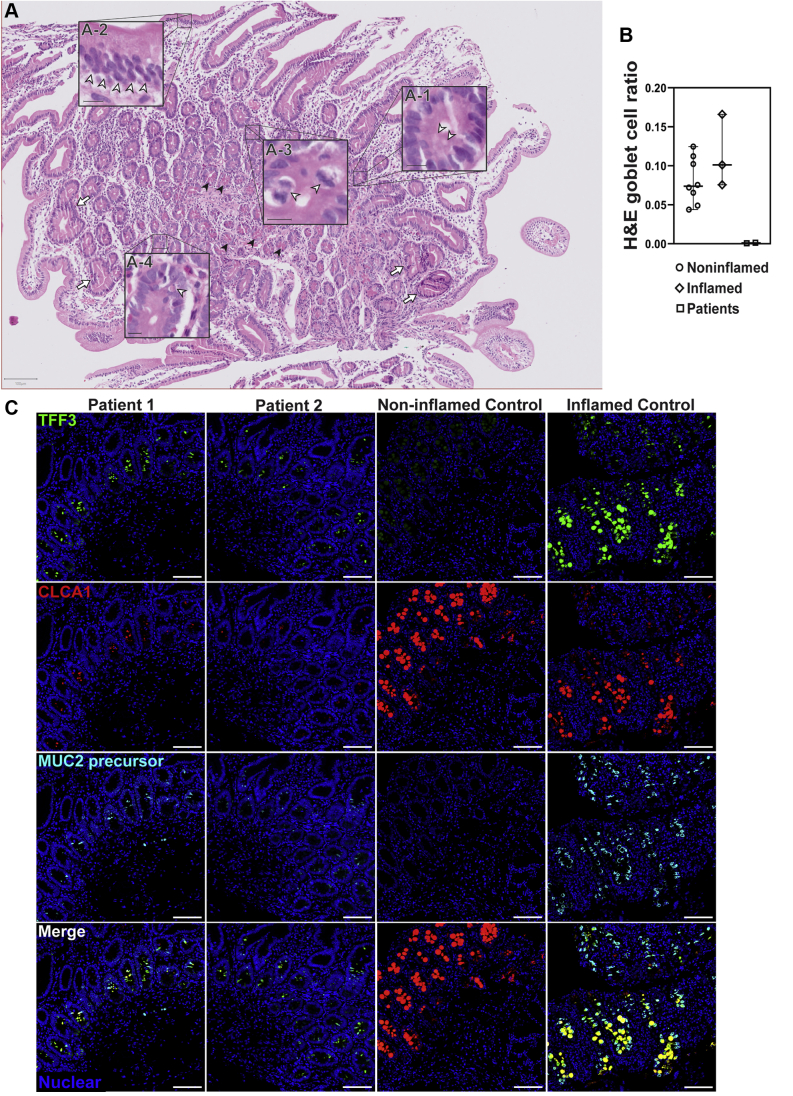
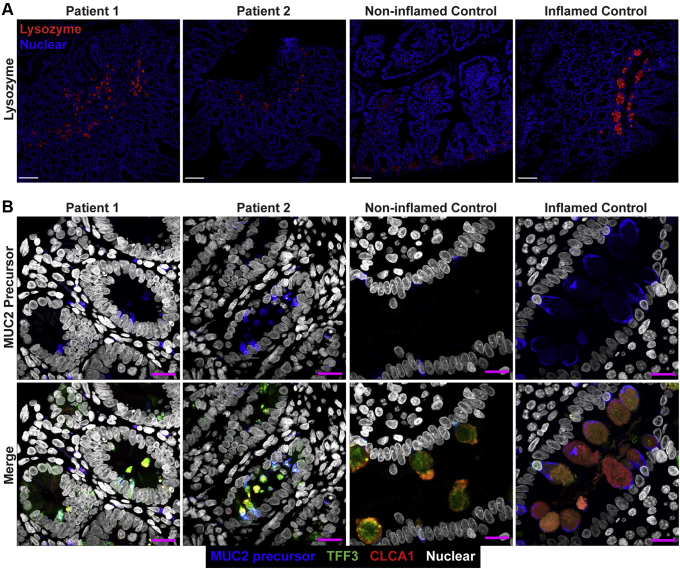
Methods: We performed whole-genome sequencing to identify candidate variants. We quantified goblet cell numbers using H&E histology and investigated the expression of gel-forming mucins, stress markers, and goblet cell markers using immunohistochemistry. AGR2-MUC2 binding was evaluated using co-immunoprecipitation. Endoplasmic reticulum (ER) stress regulatory function of mutant AGR2 was examined by expression studies in Human Embryonic Kidney 293T (HEK293T) using tunicamycin to induce ER stress.

Results: Both affected siblings were homozygous for a missense variant in AGR2. Patient biopsy specimens showed reduced goblet cells; depletion of MUC2, MUC5AC, and MUC6; up-regulation of AGR2; and increased ER stress. The mutant AGR2 showed reduced capacity to bind MUC2 and alleviate tunicamycin-induced ER stress.

Conclusions: Phenotype-genotype segregation, functional experiments, and the striking similarity of the human phenotype to AGR2-/- mouse models suggest that the AGR2 missense variant is pathogenic. The Mendelian deficiency of AGR2, termed "Enteropathy caused by AGR2 deficiency, Goblet cell Loss, and ER Stress" (EAGLES), results in a mucus barrier defect, the inability to mitigate ER stress, and causes infantile-onset inflammatory bowel disease.

Keywords: AGR2; ER Stress; Goblet Cells; Intestinal Metaplasia; MUC2.


Figures

None
Graphical abstract
Figure 1
Figure 1
Patients developed severe intestinal metaplasia in the gastric epithelium with the appearance of Paneth cells and loss of parietal cells. (A–C) Scans of H&E staining on formalin-fixed paraffin-embedded (FFPE) gastric sections were used to highlight metaplastic and inflammatory features of the patients. Insets: Arrowheads indicate the feature described in the legend pertaining to that particular inset. (A) Gastric section of patient 1 taken at 1 year of age showing severe intestinal metaplasia and patchy lymphocytic infiltration. Metaplasia was shown by the presence of villiforms (arrows), crypt-like structures (A-1), granulated Paneth-like cells (A-2), and a lack of recognizable parietal and foveolar cells. Inflammation is evident by the presence of patchy lymphocytic infiltrates (A-3), and mitotic figures indicate a regenerative state (A-4). Scans from gastric section of (B) patient 2 taken at 2 months of age alongside (C) patient 1 at 6 months of age showing the same extensive metaplasia and metaplastic features. Biopsies were performed at (A and B) Hamad General Hospital, and (C) Al Wakra Hospital. Each biopsy was performed by a different physician. (A–C) H&E slides were acquired with a slide scanner using a 40× objective. Insets were generated using digital zoom. (D) Lysozyme was detected by fluorescent immunohistochemistry (IHC) and confocal microscopy on FFPE sections. Nuclei were stained with Hoechst (blue). Lysozyme (red, polyclonal antibody) expression in the stomachs of patients was increased and localization was concentrated in the Paneth-like cells. (A–D) Scale bars: 100 μm. (E) Higher magnification of Paneth-like cells in the gastric epithelium via H&E and fluorescent IHC shows these cells expressed lysozyme (red) and were highly granular and eosinophilic. Thus, these gastric Paneth-like cells highly resemble the Paneth cells of the small bowel. Small panels and insets: Scale bars: 10 μm. (F) Fluorescent immunohistochemistry of parietal cell marker H+/K+ adenosine triphosphatase (ATPase) (green, clone C-4) performed on FFPE sections. Nuclei were stained with Hoechst (blue). The staining shows depletion of H+/K+ ATPase, which is consistent with the loss of parietal cells on H&E. H+/K+ ATPase staining was replicated 3 independent times with 2 inflamed controls and 2 noninflamed controls. Inflamed control shown in the figure is positive for H pylori. Lysozyme staining was replicated in at least 3 independent experiments including a total of 3 noninflamed controls and 4 inflamed controls. Identical thresholding parameters for each marker were used.
Figure 2
Figure 2
Patients 1 and 2 show severe loss of goblet cells in the small intestines. (A) Patient small bowel was nearly devoid of goblet cells on H&E staining of formalin-fixed paraffin-embedded (FFPE) sections, with few potential examples of apical staining clearances consistent with the morphology and localization of goblet cell thecae (A-1). The section also shows disorganization of columnar epithelial cells (A-2). Mitotic figures (A-3) and regenerative crypts (arrows) indicate a regenerative state. Apoptotic bodies also are present (A-4), indicating ongoing apoptotic activity. Paneth cells appeared unremarkable (black arrowheads). White arrowheads point to the features highlighted in each respective inset. Images were acquired using a slide scanner with a 40× objective and were cropped digitally. Scale bars: 100 μm (main panel); 10 μm (magnified insets). Digital zoom was used for magnified insets. Representative section from patient 1 is shown here. Both patients showed identical presentation. (B) Quantification of goblet cell depletion in small-bowel H&E sections. Results are the ratio of goblet cells to total epithelial cells. Each point represents the data from 1 individual. Line represents the median and bars indicate 95% CI. (C) Fluorescent immunohistochemistry staining for the goblet cell markers TFF3 (green, clone B-1), CLCA1 (red, clone EPR12254-88), and nonglycosylated MUC2 precursor (turquoise, clone CCP58) in paraffin-embedded sections from small bowel detected by a laser scanning microscope using a 10× objective. Nuclei were stained with Hoechst (blue). Signal was acquired from the entire thickness of the section by adjusting the pinhole to cover 9 μm. Each marker was replicated at least 3 independent times. CLCA1 was visualized using a goat anti-rabbit AF647 antibody and goat anti-mouse AF546 for TFF3. Nonglycosylated MUC2 antibody was conjugated directly with AF594. For small bowel, TFF3 staining was replicated across 4 noninflamed controls and 5 inflamed controls, while CLCA1 and nonglycosylated MUC2 precursor staining were replicated across 2 noninflamed controls and 2 inflamed controls. Small-bowel inflamed control shown in the figure is from a patient diagnosed with Familial Mediterranean fever.
Figure 3
Figure 3
Small bowel of the patients show unremarkable localization of lysozyme in Paneth cells and depletion of nonglycosylated MUC2 precursor compared with inflamed controls. (A) Confocal images of fluorescent immunohistochemical staining for lysozyme (red, polyclonal) shows normal localization of Paneth cells in the small intestines of both siblings. Confocal acquisition was performed using a 10× objective. Scale bars: 100 μm. Lysozyme staining was replicated in a minimum of 3 independent experiments including a total of 3 noninflamed controls and 4 inflamed controls. (B) Maximum intensity projection of confocal Z-stacks acquired from small-bowel sections stained for MUC2 precursor (blue, CCP58), TFF3 (green, B-1), and CLCA1 (red, EPR12254-88) with Hoechst nuclear counterstain (white). Staining shows little accumulation of MUC2 precursor in the patients compared with inflamed controls, but not with noninflamed controls, which appeared to have the lowest accumulation of the precursor. Patient sections also show reduced size of goblet cell thecae. Images were acquired using a 63× objective. Scale bar: 10 μm. Replicates included 2 noninflamed controls and 4 inflamed controls. Identical thresholding parameters for each marker were applied to all images in each respective panel.
Figure 4
Figure 4
Patient large bowel shows intense inflammation and loss of goblet cells. (A) H&E scan of patient 1 large bowel shows reduction of goblet cells with some remaining clusters (A-1). Other features include epithelial disorganization (A-2), frequent mitotic (A-3) and apoptotic bodies (A-4), eosinophilic infiltration (A-5), and regenerative crypts (arrows). Arrowheads indicate the features of each respective inset. Scale bars: 100 μm (main panel); 10 μm (magnified insets). Digital zoom was used for magnified insets. (B) Quantification of goblet cell depletion in H&E sections of large bowel. Each dot represents the ratio of goblet cells to total epithelial cells from 1 individual. Horizontal line represents the median and bars indicate 95% CI. (C) Fluorescent immunohistochemistry staining for the goblet cell markers TFF3 (green, clone B-1), CLCA1 (red, clone EPR12254-88), and nonglycosylated MUC2 precursor (turquoise, clone CCP58) in paraffin-embedded sections from large bowel with nuclear counterstain (blue, Hoechst). Representative images are shown for patients 1 and 2. Each marker was replicated at least 3 independent times. CLCA1 was visualized using a goat anti-rabbit AF647 antibody and goat anti-mouse AF546 for TFF3. Nonglycosylated MUC2 antibody was conjugated directly with AF594. Images were acquired using a laser scanning confocal microscope with a 10× objective. The pinhole was adjusted to 9 μm to acquire signal from the entire thickness of the section. Scale bar: 100 μm. TFF3 staining was replicated across 3 noninflamed controls and 6 inflamed controls, while CLCA1 and nonglycosylated MUC2 precursor staining were replicated across 2 noninflamed controls and 3 inflamed controls. Large-bowel inflamed control shown in the figure is from a patient with appendicitis.
Figure 5
Figure 5
Reduced accumulation of nonglycosylated MUC2 precursor within goblet cells of the large bowels of the patients compared with inflamed controls. Maximum intensity projection of confocal Z-stacks acquired from large-bowel sections stained for MUC2 precursor (blue, CCP58), TFF3 (green, B-1), CLCA1 (red, EPR12254-88), and nuclei counterstained with Hoechst (white). Accumulation of MUC2 precursor appears reduced in the goblet cells of patients compared with other inflamed controls, but not compared with noninflamed controls, which appear to have the least amount of MUC2 precursor. Goblet cells of the patients also show reduced size of their thecae. For patient 1, 2 images from the large bowel are shown to illustrate the heterogeneity in goblet cell phenotype between crypts of the large bowel in this patient. Staining for all markers was repeated at least 3 independent times. Scale bars: 10 μm. Acquisition was performed with a laser scanning confocal microscope using a 63× objective. Staining was replicated across 2 noninflamed and 3 inflamed controls. Identical thresholding parameters for each marker were applied to all images.
Figure 6
Figure 6
Identification of a homozygous missense variant in AGR2. (A) Map of AGR2 protein domains as reviewed by Delom et al with the mutation site indicated. (B) Pedigree showing the parents, the patients (P1, P2), and healthy siblings (S1–S5). Only the patients are homozygous for the mutation. (C) Chromatograms from Sanger sequencing of genomic DNA from the family and an unrelated healthy control. (D) Ribbon diagram of the WT AGR2 homodimer (grey/cyan, Protein Data Bank ID: 2LNS) showing the side chain position of H117 (green) at the protein surface in each monomer. (E) Surface location of H117 (green, thin stick representation) and modeling of the H117Y mutant side chain (blue) using the ICM software package (Molsoft). The neighboring residue L118 (grey) packs against V137 (purple, distance 4.3 Å) as shown. (F) H117 residue of AGR2 protein is conserved across species. Multiple sequence alignment of AGR2 orthologues, using Clustal Omega (UCD Conway Institute, Dublin, Ireland), and similarity highlighting were performed through UniProt. The following orthologues are shown with the UniProt identifiers in parentheses in the following order: humans (O95994), mouse (O88312), zebrafish (Q5RZ65), American chameleon (G1KMJ8), Tasmanian devil (G3VGV8), pig (A0A4X1TD21), sperm whale (A0A2Y9FEZ9), Sumatran orangutan (Q5R7P1), Japanese rice fish (A0A3B3IHX1), and Duckbill platypus (F7FAI5).
Figure 7
Figure 7
Up-regulation and altered localization of AGR2 in gastrointestinal tissues of the patients. Confocal images showing AGR2 (red, clone 5G1.1 for gastric and D9V2F for bowel) immunofluorescence staining on small and large intestinal and gastric sections. Intestinal stains were visualized with goat anti-rabbit AF647 secondary while gastric stains were visualized with goat anti-mouse AF546 secondary. Nuclei were stained with Hoechst (blue). Representative images are shown for patients 1 and 2. For small bowel, representative images are shown for 1 of 3 noninflamed controls and 1 of 5 inflamed controls. For large bowel, representative images are shown for 1 of 3 noninflamed controls and 1 of 6 inflamed controls. For gastric sections, representative images are shown for 1 of 3 noninflamed controls and 1 of 4 inflamed controls. Staining was replicated independently at least 3 times. Inflamed controls shown in the figure included ulcerative colitis for gastric, Crohn’s for small bowel, and appendicitis for large bowel. Scale bar: 100 μm. Identical thresholding parameters were applied for each row of images.
Figure 8
Figure 8
AGR2 localization changes in the small bowel of patients to encompass all epithelial surfaces. Fluorescent immunohistochemistry on formalin-fixed paraffin-embedded sections showing AGR2 (red, clone D9V2F) localization and goblet cells, identified by MUC2 (green, clone F-2) and TFF3 (yellow, clone B-1) staining. Nuclei were counterstained with Hoechst 33342 (blue). Images were acquired via confocal microscopy. The 2 large panels are low-magnification images (10× objective) of the small bowel from a noninflamed control and patient 1 and show the change in localization of AGR2 in the patients. In the control, crypts (arrows) show a diffuse staining of AGR2 across all cell types, while villi show near-exclusive staining within goblet cells (arrowheads). The patient on the other hand shows staining across all epithelial surfaces in the section. Smaller panels below show maximum intensity projection of the high-magnification (63× objective) confocal Z-stacks of representative goblet cells from the noninflamed control and patient 1. For each pair of images, top panels show only nuclear (blue) and AGR2 (red) staining, while the bottom panels show the merge for all 4 markers. Patient AGR2 staining is diffuse within the cytoplasm and is present throughout all epithelial cells, in contrast to the goblet cell–specific staining in the control. Accumulation of AGR2 against the mucin granules (arrowhead) observable in the control is lost in the patient. Identical thresholding parameters were applied for all images. Scale bars: 100 μm (large panels); 10 μm (small panels).
Figure 9
Figure 9
AGR2 up-regulation in the patients is similar to other inflamed conditions. Although AGR2 up-regulation occurs in multiple inflammatory conditions, patients 1 and 2 showed a strikingly greater up-regulation of BiP than the other conditions. Large-bowel sections from patients 1 and 2 and patients suffering from appendicitis, polyp, and ulcerative colitis were co-stained for AGR2 (green, clone 5G1.1) and BiP (red, C50B12). Nuclei were stained with Hoechst (blue). Confocal Z stacks were acquired with a 10× objective and visualized using maximum intensity projection. Scale bars: 100 μm. When comparing other conditions with the AGR2 mutant patients, we found increased AGR2 to be common in inflammatory conditions of the gut, but the BiP increase was greatest in AGR2 mutant patients. These observations support the impaired capacity of AGR2 H117Y to regulate ER stress.
Figure 10
Figure 10
Depletion of gel-forming mucins MUC2, MUC5AC, and MUC6 in gastrointestinal tissues of the patients. Fluorescent immunohistochemistry staining of formalin-fixed paraffin-embedded sections showing depletion of MUC2 (green, clone F-2) in small and large bowel, as well as MUC5AC (green, clone CLH2) and MUC6 (red, clone CLH5) in the stomach. Nuclei were stained with Hoechst (blue). Patient 2 shows a small group of cells positive for MUC6 (arrowhead). Representative images are shown for patients 1 and 2, 1 of 3 noninflamed controls, and 1 of 5 inflamed controls for small bowel. For large bowel, representative images are shown for 1 of 3 noninflamed controls and 1 of 6 inflamed controls. Representative, high-magnification (63× objective) images of small-bowel crypts show the reduced size of goblet cell thecae in the patients with staining for TFF3 (red, clone B-1) and MUC2 (green, clone F-2). All other images were acquired with a 10× objective. For gastric sections, MUC5AC staining was replicated across 3 noninflamed controls and 4 inflamed controls, while MUC6 staining was replicated across 2 noninflamed controls and 2 inflamed controls. Identical thresholding parameters were applied to the images from each respective tissue. Inflamed conditions shown in the figure are celiac for small bowel, appendicitis for large bowel, and H pylori for gastric. Staining for every marker was replicated a minimum of 3 independent times. Scale bars: 100 μm (low magnification); 10 μm (high magnification).
Figure 11
Figure 11
Increased ER stress in the gastrointestinal mucosa of the AGR2 variant patients. BiP (red, clone C50B12) abundance was assessed in gastric and intestinal formalin-fixed paraffin-embedded sections by fluorescent immunohistochemistry and confocal microscopy acquired with a 10× objective. Primary antibody was nonconjugated and used with a goat anti-rabbit AF647 secondary antibody. Nuclei were stained with Hoechst (blue). Inflamed conditions are Crohn’s for gastric, Crohn’s for small bowel, and appendicitis for large bowel. Scale bars: 100 μm. Representative images from 1 of at least 3 independent experiments are shown for patients 1 and 2. For small bowel, representative images of 1 of 3 noninflamed controls and 1 of 4 inflamed controls were shown. For large bowel, representative images are shown for 1 noninflamed control and 1 of 5 inflamed controls. For gastric sections, representative images are shown for 1 of 3 noninflamed controls and 1 of 4 inflamed controls. Identical thresholding parameters were applied to the images from each respective tissue.
Figure 12
Figure 12
AGR2 H117Y has a reduced ability to interact with MUC2 and regulate ER stress in vitro. (A) HEK293T cells were transfected with equal amounts of WT or H117Y mutant (Mut) HA-tagged AGR2 (HA-AGR2) and blotted for AGR2 or β-actin as a loading control. Mutant HA-AGR2 consistently showed lower expression when examined by Western blot. Data are representative of 3 independent experiments. (B and right panel of C) Mutant AGR2 was transfected at double the amount compared with WT plasmid to obtain the same level, or higher, of mutant AGR2 protein as WT. (B) LS174T cells were transfected with WT or H117Y mutant HA-AGR2 or Green Fluorescent Protein (GFP) as a transfection control. Transfected AGR2 was immunoprecipitated using anti-HA beads, and immunoprecipitates were blotted for MUC2 (clone CCP58) and HA-tag. (C) Immunoblots of the lysates of HEK293T cells overexpressing WT or Mut AGR2 or GFP and stressed with tunicamycin (Tun) 48 hours after transfection. Left: Data from cells transfected with equal amounts of WT or Mut (1×) plasmid. Right: Results in which twice (2×) the amount of mutant AGR2 plasmid was transfected than for WT. Blots were stained with antibodies against BiP (clone C50B12), AGR2 (clone D9V2F), HA (clone C29F4), and β-actin. Experiment was repeated 3 independent times in HEK293T.

Similar articles

Cited by

References

    1. Uhlig H.H., Schwerd T., Koletzko S., Shah N., Kammermeier J., Elkadri A., Ouahed J., Wilson D.C., Travis S.P., Turner D., Klein C., Snapper S.B., Muise A.M. The diagnostic approach to monogenic very early onset inflammatory bowel disease. Gastroenterology. 2014;147:990–1007.e3. - PMC - PubMed
    1. Crowley E., Warner N., Pan J., Khalouei S., Elkadri A., Fiedler K., Foong J., Turinsky A.L., Bronte-Tinkew D., Zhang S., Hu J., Tian D., Li D., Horowitz J., Siddiqui I., Upton J., Roifman C.M., Church P.C., Wall D.A., Ramani A.K., Kotlarz D., Klein C., Uhlig H., Snapper S.B., Gonzaga-Jauregui C., Paterson A.D., McGovern D.P.B., Brudno M., Walters T.D., Griffiths A.M., Muise A.M. Prevalence and clinical features of inflammatory bowel diseases associated with monogenic variants, identified by whole-exome sequencing in 1000 children at a single center. Gastroenterology. 2020;158:2208–2220. - PMC - PubMed
    1. Leung G., Muise A.M. Monogenic intestinal epithelium defects and the development of inflammatory bowel disease. Physiology. 2018;33:360–369. - PMC - PubMed
    1. Hooper L.V., MacPherson A.J. Immune adaptations that maintain homeostasis with the intestinal microbiota. Nat Rev Immunol. 2010;10:159–169. - PubMed
    1. Johansson M.E.V., Phillipson M., Petersson J., Velcich A., Holm L., Hansson G.C. The inner of the two Muc2 mucin-dependent mucus layers in colon is devoid of bacteria. Proc Natl Acad Sci U S A. 2008;105:15064–15069. - PMC - PubMed

Publication types

MeSH terms