Meta-Analysis
. 2021 Dec;600(7889):472-477.
doi: 10.1038/s41586-021-03767-x. Epub 2021 Jul 8.

Mapping the human genetic architecture of COVID-19

Collaborators
Meta-Analysis

Mapping the human genetic architecture of COVID-19

COVID-19 Host Genetics Initiative. Nature. 2021 Dec.

Abstract

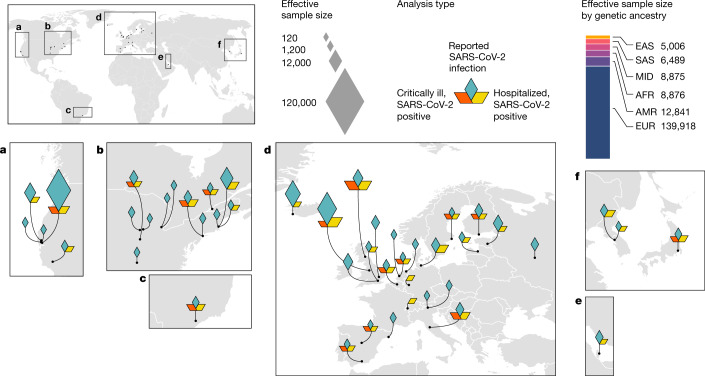
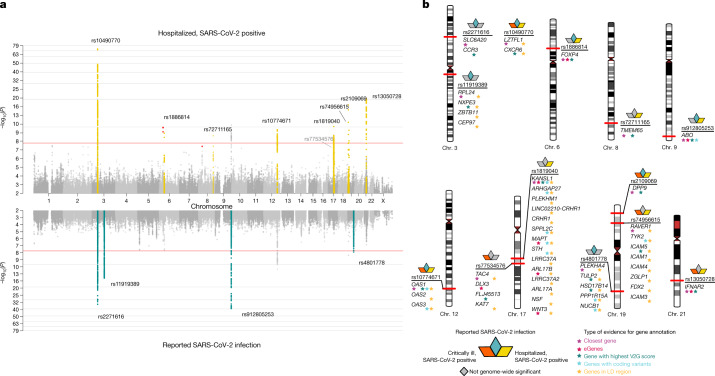
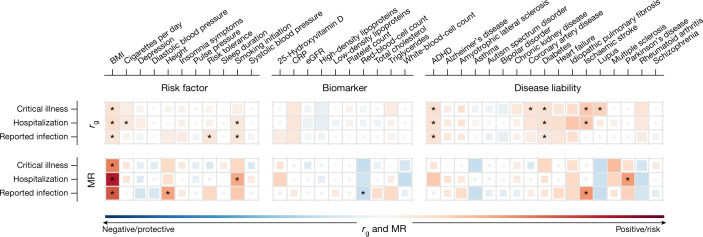
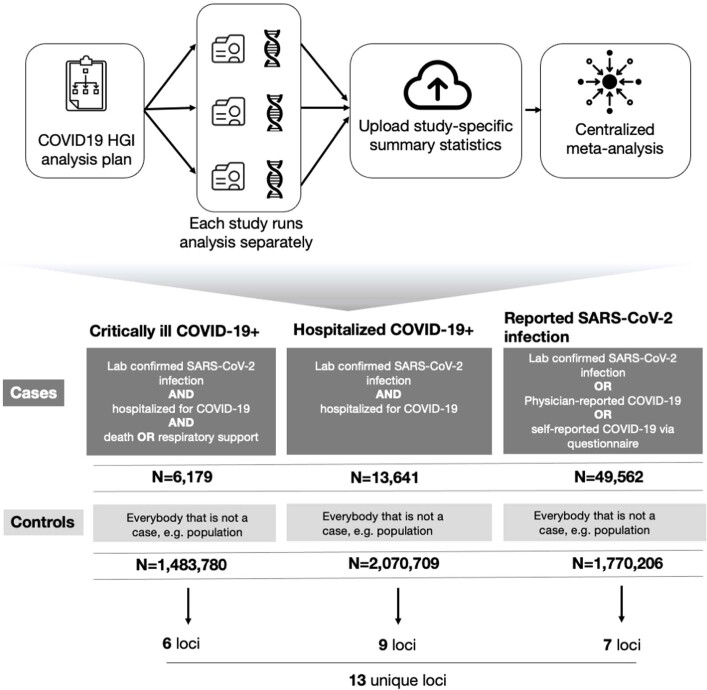
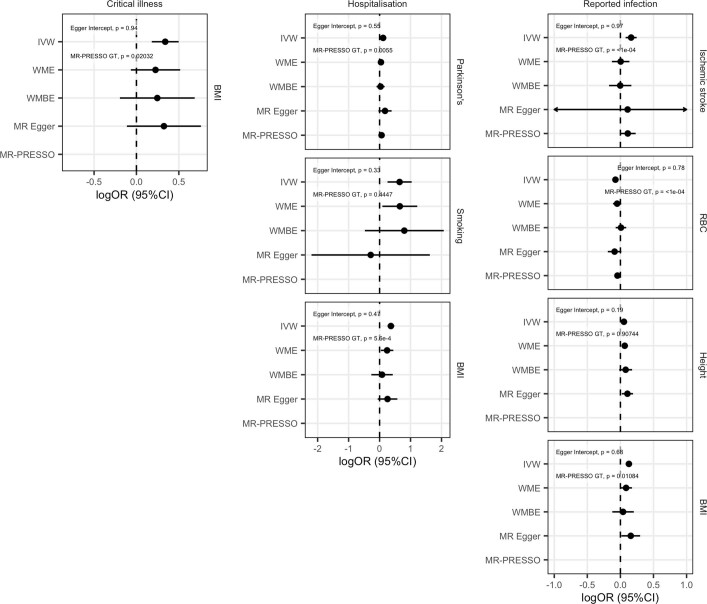
The genetic make-up of an individual contributes to the susceptibility and response to viral infection. Although environmental, clinical and social factors have a role in the chance of exposure to SARS-CoV-2 and the severity of COVID-191,2, host genetics may also be important. Identifying host-specific genetic factors may reveal biological mechanisms of therapeutic relevance and clarify causal relationships of modifiable environmental risk factors for SARS-CoV-2 infection and outcomes. We formed a global network of researchers to investigate the role of human genetics in SARS-CoV-2 infection and COVID-19 severity. Here we describe the results of three genome-wide association meta-analyses that consist of up to 49,562 patients with COVID-19 from 46 studies across 19 countries. We report 13 genome-wide significant loci that are associated with SARS-CoV-2 infection or severe manifestations of COVID-19. Several of these loci correspond to previously documented associations to lung or autoimmune and inflammatory diseases3-7. They also represent potentially actionable mechanisms in response to infection. Mendelian randomization analyses support a causal role for smoking and body-mass index for severe COVID-19 although not for type II diabetes. The identification of novel host genetic factors associated with COVID-19 was made possible by the community of human genetics researchers coming together to prioritize the sharing of data, results, resources and analytical frameworks. This working model of international collaboration underscores what is possible for future genetic discoveries in emerging pandemics, or indeed for any complex human disease.


Conflict of interest statement

A full list of competing interests is supplied as Supplementary Table 13.

Figures

Fig. 1
Fig. 1. Geographical overview of the contributing studies to the COVID-19 HGI and composition by major ancestry groups.
Populations are defined as African (AFR), admixed American (AMR), East Asian (EAS), European (EUR), Middle Eastern (MID) and South Asian (SAS).
Fig. 2
Fig. 2. Genome-wide association results for COVID-19.
a, Top, results of a genome-wide association study of hospitalized cases of COVID-19 (n = 13,641 cases and n = 2,070,709 controls). Bottom, the results of reported SARS-CoV-2 infections (n = 49,562 cases and n = 1,770,206 controls). Loci highlighted in yellow (top) represent regions associated with the severity of the COVID-19 manifestation—that is, increased odds of more severe COVID-19 phenotypes. Loci highlighted in green (bottom) are regions associated with susceptibility to a SARS-CoV-2 infection—that is, the effect is the same across mild and severe COVID-19 phenotypes. We highlight in red genome-wide significant variants that had high heterogeneity across contributing studies and that were therefore excluded from the list of loci found. b, Results of gene prioritization using different evidence measures of gene annotation. Genes in the LD region, genes with coding variants and eGenes (fine-mapped cis-eQTL variant PIP > 0.1 in GTEx Lung) are annotated if in LD with a COVID-19 lead variant (r2 > 0.6). V2G, highest gene prioritized by the V2G score of Open Target Genetics.
Fig. 3
Fig. 3. Genetic correlations and Mendelian randomization causal estimates between 38 traits and COVID-19 critical illness, hospitalization and reported SARS-CoV-2 infection.
Larger squares correspond to P values with higher significance, with genetic correlations (rg) or Mendelian randomization (MR) causal estimates significantly different from zero. The size of each coloured square indicates the magnitude of the P value, with P < 0.05 shown as a full-sized square, P = 0.05–0.1 as a large square, P = 0.1–0.5 as a medium square and P > 0.5 as a small square. Genetic correlations or causal estimates that are significantly different from zero at an FDR of 5% are marked with an asterisk. Two-sided P values were calculated using LDSC for genetic correlations and inverse-variance-weighted analysis for Mendelian randomization. ADHD, attention-deficit hyperactivity disorder; BMI, body mass index; CRP, C-reactive protein; eGFR, estimated glomerular filtration rate.
Extended Data Fig. 1
Extended Data Fig. 1. Analytical summary of the COVID-19 HGI meta-analysis.
Using the analytical plan set by the COVID-19 HGI, each individual study runs their analyses and uploads the results to the Initiative, who then runs the meta-analysis. There are three main analyses that each study can contribute summary statistics to: critically ill COVID-19, hospitalized COVID-19 and reported SARS-CoV-2 infection. The phenotypic criteria used to define cases are listed in the dark grey boxes, along with the numbers of cases (N) included in the final all-ancestries meta-analysis. Controls were defined in the same way across all three analyses as everybody that is not a case—for example, population controls (light grey box). Sensitivity analyses—not reported in this extended data figure—also included mild and/or asymptomatic cases of COVID-19 as control individuals. Sample number (N) of control individuals differed between the analyses due to the difference in the number of studies contributing data to these.
Extended Data Fig. 2
Extended Data Fig. 2. Projection of contributing studies samples into the same PC space.
We asked participating studies to perform a PC projection using the 1000 Genomes Project and Human Genome Diversity Project as a reference, with a common set of variants. For each panel (except for the reference), coloured points correspond to contributed samples from each cohort, whereas grey points correspond to the reference samples from the 1000 Genomes Project. Colour represents a genetic population that each cohort specified. As 23andMe, Genomics England 100,000 Genomes Project (GenomicsEngland100kgp), and Million Veterans Program (MVP) only submitted PCA images, we overlaid their submitted transparent images using the same coordinates, instead of directly plotting them. Populations are defined as African (AFR), admixed American (AMR), East Asian (EAS), European (EUR), Middle Eastern (MID) and South Asian (SAS), Oceanian (OCE).
Extended Data Fig. 3
Extended Data Fig. 3. Locus-zoom plots of the 3p21.31 region for reported SARS-CoV-2 infection.
a, A standard plot without exclusion. Here, the severity lead variant rs10490770 (chr. 3: 45823240T:C) is shown as a lead variant. b, Additional independent susceptibility signal(s) after excluding variants with r2 > 0.05 with rs10490770. The susceptibility lead variant rs2271616 (chr. 3: 45796521G:T) is highlighted.
Extended Data Fig. 4
Extended Data Fig. 4. Genome-wide meta-analysis association results for critical illness due to COVID-19.
The locus on chromosome 6 is the HLA locus, which was removed from the list of reported loci in Supplementary Table 2 due to the high heterogeneity in effect size estimated between studies included in the analysis. The locus on chromosome 7 was also not reported in Supplementary Table 2 due to missingness across studies—that is, the high number of studies in the meta-analysis that did not report summary statistics for this region. There are two association peaks on chromosome 19.
Extended Data Fig. 5
Extended Data Fig. 5. Sensitivity analyses for overlapping controls in genomiCC and UK Biobank.
Comparison of the beta effect sizes (top) and unadjusted P values (bottom) of the 13 lead variants, using data from the COVID-19 critical illness meta-analysis in all the cohorts to leaving out genomiCC (cases, n = 4,354; controls, n = 1,474,655; total, n = 1,479,009), leaving out the UK Biobank (UKBB; cases, n = 5,870; controls, n = 1,155,203; total, n = 1,161,073) and leaving out both genomiCC and UK Biobank (cases, n = 4,045; controls, n = 1,146,078; total, n = 1,150,123) (from left to right, respectively). Top, dots and grey bars represent the beta effect size estimates ± standard error from the corresponding GWAS meta-analysis. Bottom, dots represent two-sided P values from the corresponding GWAS meta-analysis. Filled dots indicate variants that showed genome-wide significance in the full meta-analysis of critical illness due to COVID-19, and empty dots represent variants that were not significant for critical illness but were significant for either hospitalization due to COVID-19 or reported SARS-CoV-2 infection. Red dots represent variants that showed genome-wide significance in the leave-one-out analysis for genomiCC, UK Biobank or genomiCC and UK Biobank.
Extended Data Fig. 6
Extended Data Fig. 6. Comparison of χ2 statistics and r2 values to the lead variant in the 3p21.31 region.
ac, Data are shown for critical illness (a), hospitalization (b) and reported SARS-CoV-2 infection (c). The left blue peak in c, which is uncorrelated with the lead variants in the region, indicates that there are independent signals.
Extended Data Fig. 7
Extended Data Fig. 7. Comparison of the effect sizes of lead variants between pairs of COVID-19 meta-analyses.
Comparison of effect sizes for the nine variants associated with severity of COVID-19 disease. a, Comparing hospitalized cases of COVID-19 versus population controls (n = 10,428 cases and n = 1,483,270 controls) and critically ill cases of COVID-19 versus population controls (n = 6,179 cases and n = 1,483,780 controls). b, Hospitalized cases of COVID-19 versus population controls (n = 5,806 cases and n = 1,144,263 controls) and hospitalized cases of COVID-19 versus non-hospitalized cases of COVID-19 (n = 5,773 cases and n = 15,497 controls). Sample sizes for hospitalized cases of COVID-19 versus population controls differ between a and b due to differences in the sampling of studies selected for the analysis. This selection included all studies that were able to contribute data to the respective analyses that the data were compared to (shown on the y axis) in each panel. Dots represent the effect size beta estimates, bars represent the 95% confidence interval of the estimates. Effect size estimates and P values for heterogeneity tests (Cochran’s Q, two-tailed test) are reported in Supplementary Table 3.
Extended Data Fig. 8
Extended Data Fig. 8. PheWAS for genome-wide significant lead variants.
Selected phenotypes associated with genome-wide significant COVID-19 variants (see Supplementary Table 6 for a complete list). We report those associations for which a lead variant from a previous GWAS result was in high LD (r2 > 0.8) with the index COVID-19 variants. The colour represents the z-scores of correlated risk increasing alleles for the trait. The total number of associations for each COVID-19 variant is highlighted in the grey box.
Extended Data Fig. 9
Extended Data Fig. 9. Genetic correlation with COVID-19 phenotypes.
Each column shows the genetic correlation results for the three COVID-19 phenotypes (European-ancestry analyses only): critical illness, hospitalization and reported SARS-CoV-2 infection. The traits that the genetic correlation is run against are listed on the left. Significant correlations (FDR < 0.05) are shown with their 95% confidence intervals in red, nominally significant correlations (P < 0.05) are in black and non-significant correlations are in grey. Two-sided P values were calculated using LDSC for genetic correlations and exact estimates, unadjusted standard errors and two-sided P values are available in Supplementary Table 11.
Extended Data Fig. 10
Extended Data Fig. 10. Mendelian randomization sensitivity analyses.
Genetic correlations and Forest plots displaying the causal estimates for each of the sensitivity analyses used in the Mendelian randomization analysis for trait pairs that were significant at an FDR of 5%. Two-sided P values were estimated using IVW, WME, WMBE and MR-PRESSO analyses. RBC, red blood cell count.

Comment in

References

    1. Docherty AB, et al. Features of 20 133 UK patients in hospital with COVID-19 using the ISARIC WHO Clinical Characterisation Protocol: prospective observational cohort study. Br. Med. J. 2020;369:m1985. doi: 10.1136/bmj.m1985. - DOI - PMC - PubMed
    1. Zhou F, et al. Clinical course and risk factors for mortality of adult inpatients with COVID-19 in Wuhan, China: a retrospective cohort study. Lancet. 2020;395:1054–1062. doi: 10.1016/S0140-6736(20)30566-3. - DOI - PMC - PubMed
    1. Dendrou CA, et al. Resolving TYK2 locus genotype-to-phenotype differences in autoimmunity. Sci. Transl. Med. 2016;8:363ra149. doi: 10.1126/scitranslmed.aag1974. - DOI - PMC - PubMed
    1. Astle WJ, et al. The allelic landscape of human blood cell trait variation and links to common complex disease. Cell. 2016;167:1415–1429.e19. doi: 10.1016/j.cell.2016.10.042. - DOI - PMC - PubMed
    1. Fingerlin TE, et al. Genome-wide association study identifies multiple susceptibility loci for pulmonary fibrosis. Nat. Genet. 2013;45:613–620. doi: 10.1038/ng.2609. - DOI - PMC - PubMed

Publication types

MeSH terms

Grants and funding