. 2021 Jul 8;22(1):363.
doi: 10.1186/s12859-021-04213-5.

Predicting synchronized gene coexpression patterns from fibration symmetries in gene regulatory networks in bacteria

Affiliations

Predicting synchronized gene coexpression patterns from fibration symmetries in gene regulatory networks in bacteria

Ian Leifer et al. BMC Bioinformatics. .

Abstract

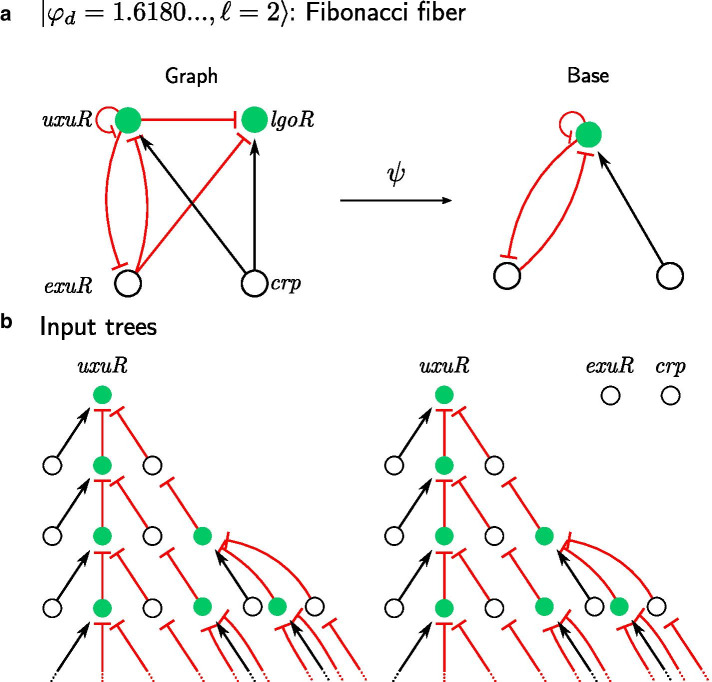
Background: Gene regulatory networks coordinate the expression of genes across physiological states and ensure a synchronized expression of genes in cellular subsystems, critical for the coherent functioning of cells. Here we address the question whether it is possible to predict gene synchronization from network structure alone. We have recently shown that synchronized gene expression can be predicted from symmetries in the gene regulatory networks described by the concept of symmetry fibrations. We showed that symmetry fibrations partition the genes into groups called fibers based on the symmetries of their 'input trees', the set of paths in the network through which signals can reach a gene. In idealized dynamic gene expression models, all genes in a fiber are perfectly synchronized, while less idealized models-with gene input functions differencing between genes-predict symmetry breaking and desynchronization.

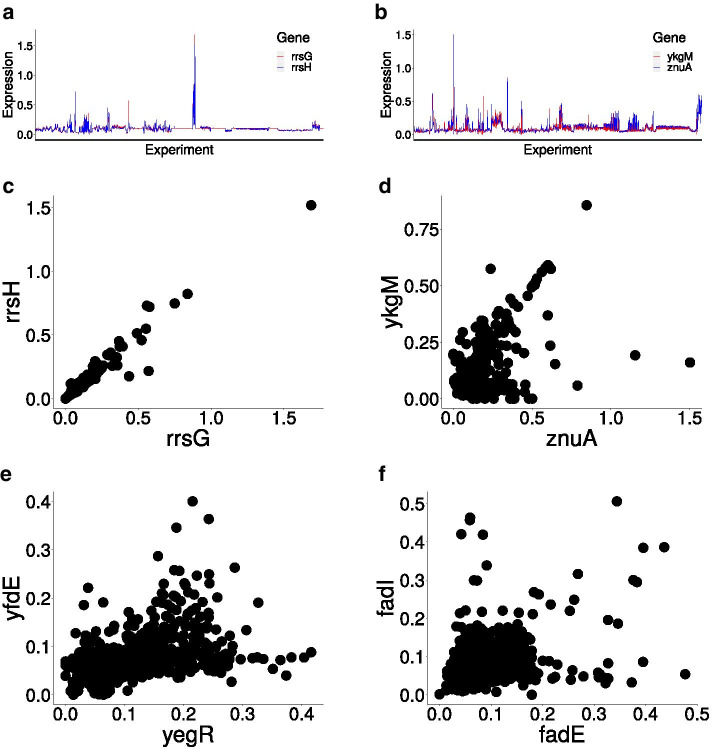
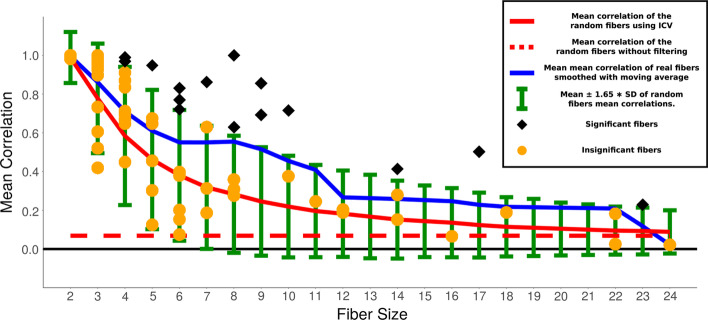
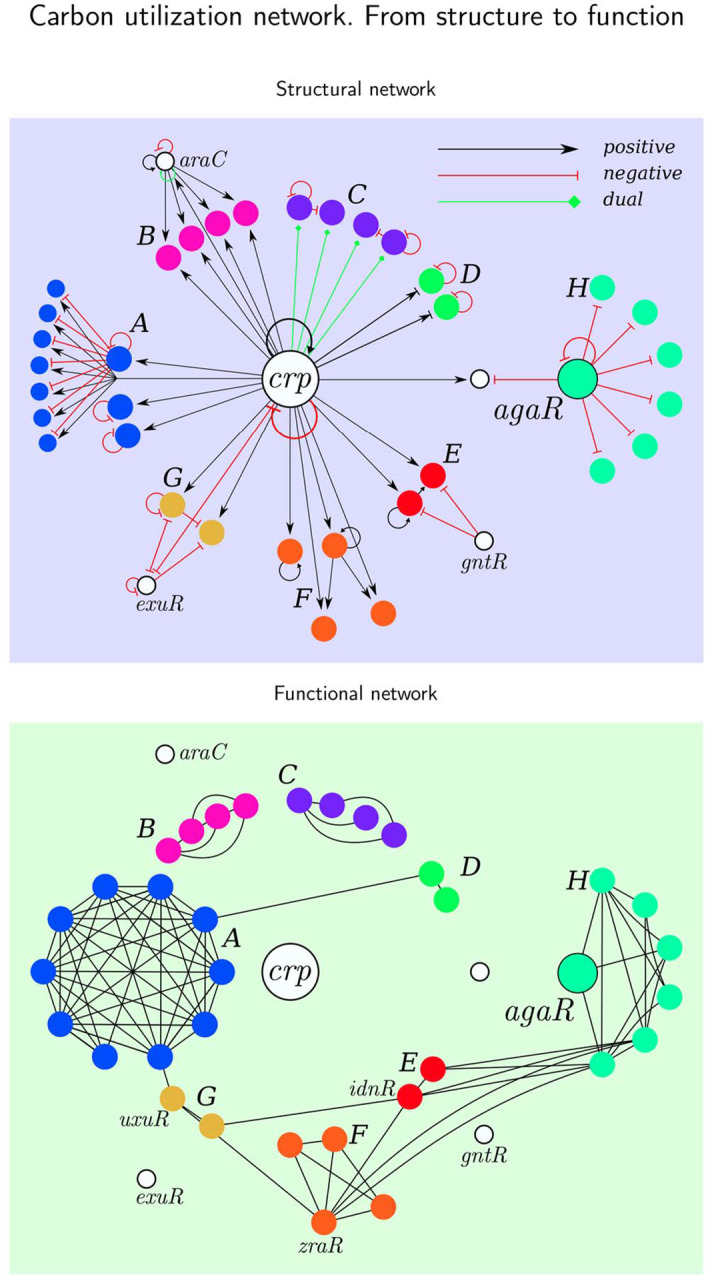
Results: To study the functional role of gene fibers and to test whether some of the fiber-induced coexpression remains in reality, we analyze gene fibrations for the gene regulatory networks of E. coli and B. subtilis and confront them with expression data. We find approximate gene coexpression patterns consistent with symmetry fibrations with idealized gene expression dynamics. This shows that network structure alone provides useful information about gene synchronization, and suggest that gene input functions within fibers may be further streamlined by evolutionary pressures to realize a coexpression of genes.

Conclusions: Thus, gene fibrations provide a sound conceptual tool to describe tunable coexpression induced by network topology and shaped by mechanistic details of gene expression.


Conflict of interest statement

The authors declare no competing interest.

Figures

Fig. 1
Fig. 1
Coupled-cell network of 3 nodes and it’s base. Admissible ODEs corresponding to the network G exhibit a synchronous solution x2=x3 as a consequence of the existence of fibration ψ. This is a simple case of a fibration (corresponding to a trivial regulon) which is shown here only for a didactic purpose. We will show that fibrations describe non-trivial cases below
Fig. 2
Fig. 2
Trivial circuits leading to synchronization: Regulons with co-regulation. a Genes cbpAM, gltX, gyrB and msrA are controlled by the same TF (fis). Fiber numbers describing this circuit are |n=0,=1 since there are no loops and fiber has 1 regulator. Gene activity can synchronize, because any two nodes can be permuted without the change in the network under the S4 symmetry group. fis won’t be synchronized with cbpAM, gltX, gyrB, msrA, because it can’t be permuted with any of the genes without changing network. b Regulon circuit consisting of genes clrA, fiu and operons entCEBAH, fepA-entD controlled by two regulators crp and fis also synchronizes, because symmetry group S4 is conserved irregardless of the number of the regulators. In this case fiber has two regulators and no loops and therefore is characterized by fiber numbers |n=0,=2
Fig. 3
Fig. 3
Non-trivial circuits leading to synchronization: AR loop with regulon. a Genes aroH and trpLEDCBA can be permuted under S2 symmetry group, while trpR can’t be permuted with them without changing the network. b trpR receives input only from itself, therefore its input tree is an infinite chain. aroH and trpLEDCBA receive input from trpR, that in turn receives input from itself turning these input trees into chains too. Therefore, input trees of all 3 genes are isomorphic to each other. Thus, aroH, trpLEDCBA and trpR belong to the same fiber and can synchronize their activity. Circuit has one loop and no external regulators, therefore it is classified as |n=1,=0
Fig. 4
Fig. 4
Non-trivial circuits leading to synchronization: FFF (AR loop with regulon and external regulator). a purR and its target gene pyrC regulated by fur form a FFF. FFF has one loop and one external regulator and therefore is classified as |n=1,=1. purR and pyrC belong to the same fiber (will be shown in b) and therefore are “collapsed” under fibration ψ, while fur is left untouched. b purR receives an input from itself creating an infinite chain and regulator fur, that doesn’t have any inputs. Therefore, infinite chain with additional input on each layer represents an input tree of purR. Similarly, pyrC receives input from purR that leads to the infinite chain and fur that creates an additional input. fur doesn’t receive any inputs and therefore has an input tree of height 0. Input trees of purR and pyrC are isomorphic, therefore purR and pyrC belong to the same fiber and synchronize their activity
Fig. 5
Fig. 5
Non-trivial circuits leading to synchronization: Multi-layer composite fiber. a Circuit consists of two layers of fibers: add, dsbG, gor, grxA, hemH, oxyS, trxC classified with |n=0,=1 and rbsR, oxyR classified with |n=1,=1, therefore forming a multi-layer composite fiber |n=0,=1|n=1,=1. Fibration ψ of this circuit “collapses” both fibers and leaves the regulator untouched. b Genes in the red fiber receive one input from the gene in the green fiber, which in turn receives an input from itself and the regulator. Therefore, input trees of genes in the red fiber resemble the sum of an input tree of |n=0,=1, followed by the input tree of |n=1,=1. Input trees of the green fiber are those of the FFF. Regulator node has no inputs. Thus, multi-layer composite has two non-trivial fibers that can synchronize their activity. Note, gene add is separated from the rest of the red fiber by two steps, therefore allowing for a long range synchronization in the network
Fig. 6
Fig. 6
Non-trivial circuits leading to synchronization: Fibonacci fiber (FF). a FF circuit is the FFF circuit with the additional edge from the fiber back to the regulator. In this example uxuR sends back to exuR, creating an extra loop in the circuit. Extra edge won’t change the fiber, therefore fibration will stay the same. b However, extra loop changes an input tree of fiber nodes. uxuR receives from itself and exuR, which in turn receives from uxuR, which creates an input tree with layer sizes following Fibonacci sequence. Branching ratio then defines the first fiber number and this FF is classified as |φd=1.6180,=2. Note, node lgoR receives an input from exuR and then from uxuR, which means that even if there was no link from uxuR to lgoR, information would still be passed along through the regulator. This is another way how networks can process the information
Fig. 7
Fig. 7
Similarity in gene expression data for selected pairs of genes belonging to the same fiber. Gene co-expression is demonstrated on the data from all experiments in the Ecomics database. We pick best examples out of 85 fibers obtained in E. coli. a, b Gene expression of pairs of genes in rrsH, rrsG and ykgM, znuA for 1575 experimental conditions from Ecomics. It’s easy to see that data is highly correlated. c Gene expression of rrsH (Position in genome: 223771–> 225312) vs gene expression of rrsG (Position in genome: 2729616 <– 2731157), correlation = 0.98, d Gene expression of ykgM (312514 <– 312777) vs gene expression of znuA (1941651 <– 1942583), correlation = 0.58, e Gene expression of yfdE (2488023 <– 2489168) vs gene expression of yegR (2167989<– 2168306), correlation = 0.49, f Gene expression of fadI (240859 <– 243303) vs gene expression of fadE (2459159 <– 2460469), correlation = 0.49
Fig. 8
Fig. 8
Mean correlation within the fibers, computed without filtering versus sizes of gene fibers (number of nodes). Black and orange dots—mean correlation of 85 fibers of size < 25. Shape shows significance: black diamond—significant, orange circle—insignificant. Blue—mean of mean correlation of real fibers in black (smoothed with moving average). Green error bars—mean±1.65SD of random fibers mean correlations. 1.65 is chosen, because 0.05 values of the normal distribution with μ=0 and σ=1 are above 1.65, therefore 1.65 corresponds to the p value of 0.05. Red—mean correlation of the random fibers
Fig. 9
Fig. 9
Mean correlation of fibers calculated using the filtering method of ICV vs number of nodes in the fiber. Black and orange dots—mean correlation of 85 fibers of size < 25. Shape shows significance: black diamond—significant, orange circle—insignificant. Blue—mean of mean correlation of real fibers in black (smoothed with moving average). Green error bars—mean±1.65SD of random fibers mean correlations. 1.65 corresponds to the p value of 0.05 as explained in Fig. 8. Red solid line—mean correlation of random fibers found using ICV. Red dashed line - mean correlation of the random fibers without filtering
Fig. 10
Fig. 10
Fiber Class Examples. We display the six different fiber classes with their genetic circuit and correlation matrix. Genetic circuits: A graphical representation of the genes and their regulators interactions. Edges: Black—Activation, Red—Repression. Nodes: Green and red—Fibers, White—Regulators. Correlation graphs: Correlation between Fiber genes (green and red font) and regulators (black font). Operons are shown with lines along the correlation matrix diagonal. Black lines in the correlation matrix enclose fibers, black dotted lines show cross-correlations between fibers and inside multi-layered fibers. Genes inside fibers are correlated and are not correlated with regulators and different fibers. Note, observed correlations have high p values using ICV method. This happens due to the fact that the displayed fibers are small and, as mentioned before, small fibers are have high p values with method with no filtering. Observed correlations can guide future research in finding missing transcriptional regulations. For example, self-regulation loop on spoIIID could explain the correlation inside multi-layered fiber in bacillus
Fig. 11
Fig. 11
Carbon utilization circuit: correlation matrix. Correlation matrix of the fiber building blocks involved in the carbon utilization system. Colored rectangles A,BH on the left code gene names that will be used in expression matrix plot Fig. 12 and structure vs function plot Fig. 13. Operons are shown with lines along the correlation matrix diagonal. Black crosses show correlation entries below 0.6 to compare low cross-correlation with high correlation inside fibers. COG categories are obtained using UniProt database [65]. Function of each block (Galactosamine, Arabinose, etc.) is defined by the type of it’s regulator obtained from RegulonDB [49]
Fig. 12
Fig. 12
Carbon utilization circuit: expression profile. Expression profile of 39 genes involved in the carbon utilization system over 1575 experimental conditions. Gene names correspond to the building blocks A,BH defined in Fig. 11. Conditions in white are filtered out using the method of ICV described in “Selecting relevant experimental data based on the inverse coefficient of variation” section and the rest of the conditions are used to calculate the correlation represented in Fig. 11
Fig. 13
Fig. 13
Carbon utilization circuit: structural network vs functional network. Top part shows topology of the transcriptional regulation of the carbon utilization system. Bottom part shows the functional network of the carbon utilization system based on the Pearson correlation from Fig. 11. Correlation C(ij) is thresholded at C(i,j)>0.6 to produce a functional network

Similar articles

Cited by

References

    1. Monod J, Jacob F. General conclusions: teleonomic mechanisms in cellular metabolism, growth and differentiation. Cold Spring Harb Symp Quant Biol. 1961;26:389–401. doi: 10.1101/SQB.1961.026.01.048. - DOI - PubMed
    1. Klipp E, Liebermeister W, Wierling C, Kowald A, Herwig R. Systems Biology: a textbook. Weinheim: Wiley-VCH; 2016.
    1. Palsson BØ. Systems biology: properties of reconstructed networks. New York: Cambridge University Press; 2006.
    1. Gerosa L, Kochanowski K, Heinemann M, Sauer U. Dissecting specific and global transcriptional regulation of bacterial gene expression. Mol Syst Biol. 2013;9:658. doi: 10.1038/msb.2013.14. - DOI - PMC - PubMed
    1. Karlebach G, Shamir R. Modelling and analysis of gene regulatory networks. Nat Rev Mol Cell Biol. 2008;9(10):770–780. doi: 10.1038/nrm2503. - DOI - PubMed

LinkOut - more resources