. 2021 Jul 8;14(1):110.
doi: 10.1186/s13041-021-00803-9.

APOE genotype dependent molecular abnormalities in the cerebrovasculature of Alzheimer's disease and age-matched non-demented brains

Affiliations

APOE genotype dependent molecular abnormalities in the cerebrovasculature of Alzheimer's disease and age-matched non-demented brains

Joseph O Ojo et al. Mol Brain. .

Abstract

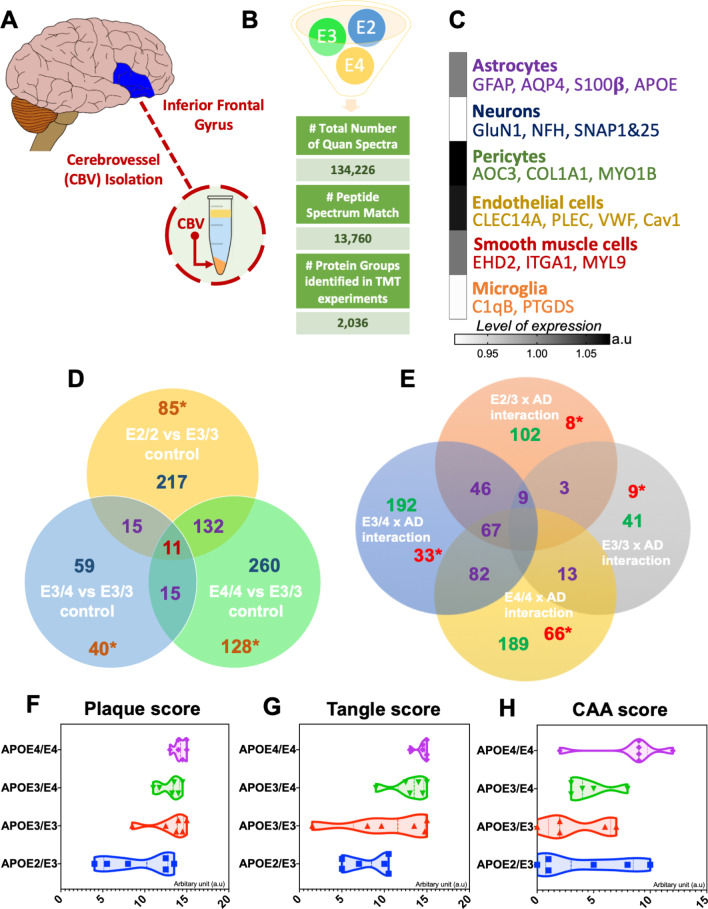
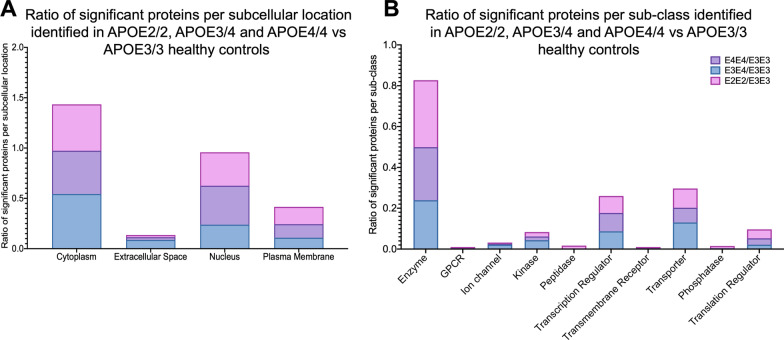
Cerebrovascular dysfunction is a hallmark feature of Alzheimer's disease (AD). One of the greatest risk factors for AD is the apolipoprotein E4 (E4) allele. The APOE4 genotype has been shown to negatively impact vascular amyloid clearance, however, its direct influence on the molecular integrity of the cerebrovasculature compared to other APOE variants (APOE2 and APOE3) has been largely unexplored. To address this, we employed a 10-plex tandem isobaric mass tag approach in combination with an ultra-high pressure liquid chromatography MS/MS (Q-Exactive) method, to interrogate unbiased proteomic changes in cerebrovessels from AD and healthy control brains with different APOE genotypes. We first interrogated changes between healthy control cases to identify underlying genotype specific effects in cerebrovessels. EIF2 signaling, regulation of eIF4 and 70S6K signaling and mTOR signaling were the top significantly altered pathways in E4/E4 compared to E3/E3 cases. Oxidative phosphorylation, EIF2 signaling and mitochondrial dysfunction were the top significant pathways in E2E2 vs E3/E3cases. We also identified AD-dependent changes and their interactions with APOE genotype and found the highest number of significant proteins from this interaction was observed in the E3/E4 (192) and E4/E4 (189) cases. As above, EIF2, mTOR signaling and eIF4 and 70S6K signaling were the top three significantly altered pathways in E4 allele carriers (i.e. E3/E4 and E4/E4 genotypes). Of all the cerebrovascular cell-type specific markers identified in our proteomic analyses, endothelial cell, astrocyte, and smooth muscle cell specific protein markers were significantly altered in E3/E4 cases, while endothelial cells and astrocyte specific protein markers were altered in E4/E4 cases. These proteomic changes provide novel insights into the longstanding link between APOE4 and cerebrovascular dysfunction, implicating a role for impaired autophagy, ER stress, and mitochondrial bioenergetics. These APOE4 dependent changes we identified could provide novel cerebrovascular targets for developing disease modifying strategies to mitigate the effects of APOE4 genotype on AD pathogenesis.

Keywords: APOE; Aging; Alzheimer’s disease; Cerebrovasculature; Endothelial cells; Mass spectrometry; Mural cells; Proteomics.


Conflict of interest statement

The authors declare that they have no competing interests.

Figures

Fig. 1
Fig. 1
Summary of liquid chromatography/mass spectrometry (LC/MS) and proteomic analyses of tissue from the cerebrovasculature isolated from the inferior frontal gyrus in Alzheimer’s disease (AD) and healthy control cases from different APOE genotypes. (A) shows brain region of interest used to isolate cerebrovessel fractions. (B) shows identified total number of quantified spectra, peptide spectrum matches and non-redundant master protein groups from all TMT experiments. (C) Data shows level of expression for gene IDs associated with specific cell types identified in our proteomic analyses of the isolated cerebrovasculature (i.e. astrocytes, microglia, pericytes, endothelial cells, and smooth muscle cells). Data represent ratio expressed in arbitrary units. Venn diagram shows unique and overlapping significantly regulated proteins in the comparisons between (D) healthy controls from APOE2/2 vs APOE3/3, APOE3/4 vs APOE3/3, and APOE4/4 vs APOE3/3 genotypes, (E) Healthy matched Alzheimer’s disease cases vs controls from APOE2/3, APOE3/3, APOE3/4, and APOE4/4 genotypes. Asterisk in Venn diagram [*] denote unique non-overlapping proteins from each comparisons. F, G and H shows the violin plot for Amyloid plaque score, Tangle score and CAA score, respectively
Fig. 2
Fig. 2
Differentially expressed proteins and cell type origin in healthy controls with  different APOE genotypes. Heat map (Log2FC) of all master proteins identified across the three different genotypes of interests compared to APOE3/E3 controls (A). Volcano plot of differentially expressed proteins in healthy controls from APOE2/E2 vs APOE3/E3 genotypes (B), APOE4/E4 vs APOE3/E3 genotypes (C), and APOE3/E4 vs APOE3/E3 genotypes (D). Pie chart inset of graphs shows up/down-regulated proteins from each comparisons. Pie Chart shows origin of cell types where significant (cerebrovascular cell specific) proteins are observed  between APOE2/E2 vs APOE3/E3 controls (b), APOE4/E4 vs APOE3/E3 controls (c), and APOE3/E4 vs APOE3/E3 controls (d). Values are generated from the ratio of significantly altered cerebrovascular cell specific proteins identified within our entire control datasets, and further expressed as a percentage of all 4 cerebrovascular cell types. EnD—endothelial cells, Ast—astrocytes, Per—Pericytes, SMC—smooth muscle cells. (E) shows heat map of the top 3 altered pathways  from the three different APOE genotype comparisons and the corresponding number of significant proteins and their Log2 fold change expression level
Fig. 3
Fig. 3
Subcellular localization and sub-class of proteins identified in the cerebrovessels of the inferior frontal gyrus in APOE2/2, APOE3/4 and APOE4/4 vs APOE3/E3  healthy controls. A shows ratio of significant proteins localized to the cytoplasm, extracellular space, nucleus and plasma membranes. B shows ratio of significant proteins and their corresponding sub-classification
Fig. 4
Fig. 4
Canonical pathways modulated in the cerebrovasculature of the inferior frontal gyrus in healthy controls with different  APOE genotypes cases. Identified canonical pathways were generated from the list of significantly modulated proteins between healthy controls from APOE2/E2 vs APOE3/E3, APOE3/E4 vs APOE3/E3, and APOE4/E4 vs APOE3/E3 genotypes using Ingenuity pathway analyses. Values represent negative log 10 of FDR adjusted P value after Fischer’s test and Benjamin Hochberg correction. Significant cut-off is set at 2. APOE2/E2 vs APOE3/E3 (45 pathways identified), APOE4/E4 vs APOE3/E3 (25 pathways identified), and APOE3/E4 vs APOE3/E3 (7 pathways identified)
Fig. 5
Fig. 5
APOE levels in the cerebrovasculature of the inferior frontal gyrus in AD cases vs healthy controls from different APOE genotypes. Asterisk denotes *P < 0.05
Fig. 6
Fig. 6
Differentially expressed proteins and cell type origin in the cerebrovasculature of the inferior frontal gyrus between Alzheimer's disease (AD) patients and controls from different APOE genotype backgrounds. Heat map (Log2FC) of all master proteins identified between AD vs controls cases across the four different APOE genotypes (A). Volcano plot of differentially expressed proteins in AD vs matched controls from APOE2/E3 (B), APOE3/E3 (C), APOE3/E4 (D), and APOE4/E4 (E) genotypes. Pie chart inset of graphs shows up/down-regulated proteins from each comparisons. Pie Chart shows origin of cell types where significant (cerebrovascular cell specific) proteins are observed from the comparisons between AD vs control cases from APOE2/E3 (b), APOE3/E3 (c), APOE3/E4 (d), and APOE4E/4 (e) genotypes. Values are generated from the ratio of significantly altered cerebrovascular cell specific proteins identified within our AD vs control datasets, and expressed as a percentage of all 4 cerebrovascular cell types. . EnD—endothelial cells, Ast—astrocytes, Per—Pericytes, SMC—smooth muscle cells. (F) shows heat map of the top 3 pathways for the four different genotype comparisons and the corresponding number of significant proteins and their Log2 fold change expression level
Fig. 7
Fig. 7
Subcellular localization and sub-class of proteins identified in the cerebrovessels of the inferior frontal gyrus in AD cases vs controls from APOE2/E3, APOE3/E3, APOE3/E4 and APOE4/E4 genotypes. (A) shows ratio of significant proteins localized to the cytoplasm, extracellular space, nucleus and plasma membranes. (B) shows ratio of significant proteins and their corresponding sub-classification
Fig. 8
Fig. 8
Upstream regulators implicated in the proteomic changes observed in the cerebrovasculature of the inferior frontal gyrus between Alzheimer's disease (AD) patients and controls from different APOE genotype backgrounds. Histograms shows Top 5 significantly altered upstream regulators identified by ingenuity pathway analyses between AD vs  controls from APOE2/E3 (A), APOE3/E3 (B), APOE3/E4 (C) and APOE4/E4 (D) genotypes. Data represents negative Log10 of the FDR adjusted “overlap” P value after Fischer’s test and Benjamin Hochberg correction. Overlap P values are generated based on the significant overlap between dataset proteins/genes and known targets regulated by a transcription factor/upstream regulator. Cut of level for significantly altered upstream regulators was set at 2 (i.e. −log 10[P value])

References

    1. de la Torre J. The vascular hypothesis of Alzheimer’s Disease: a key to preclinical prediction of dementia using neuroimaging. Mecocci P, editor. J Alzheimers Dis. 2018;63:35–52. 10.3233/JAD-180004 - PubMed
    1. De la Torre JC, Mussivand T. Can disturbed brain microcirculation cause Alzheimer’s disease? Neurol Res. 1993;15:146–153. doi: 10.1080/01616412.1993.11740127. - DOI - PubMed
    1. Di Marco LY, Venneri A, Farkas E, Evans PC, Marzo A, Frangi AF. Vascular dysfunction in the pathogenesis of Alzheimer’s disease—a review of endothelium-mediated mechanisms and ensuing vicious circles. Neurobiol Dis. 2015;82:593–606. doi: 10.1016/j.nbd.2015.08.014. - DOI - PubMed
    1. Binnewijzend MAA, Benedictus MR, Kuijer JPA, van der Flier WM, Teunissen CE, Prins ND, et al. Cerebral perfusion in the predementia stages of Alzheimer’s disease. Eur Radiol. 2016;26:506–514. doi: 10.1007/s00330-015-3834-9. - DOI - PMC - PubMed
    1. Hays CC, Zlatar ZZ, Wierenga CE. The utility of cerebral blood flow as a biomarker of preclinical Alzheimer’s disease. Cell Mol Neurobiol. 2016;36:167–179. doi: 10.1007/s10571-015-0261-z. - DOI - PMC - PubMed

Publication types