

DEEPMIR: a deep neural network for differential detection of cerebral microbleeds and iron deposits in MRI
- PMID: 34238951
- PMCID: PMC8266884
- DOI: 10.1038/s41598-021-93427-x
DEEPMIR: a deep neural network for differential detection of cerebral microbleeds and iron deposits in MRI
Abstract
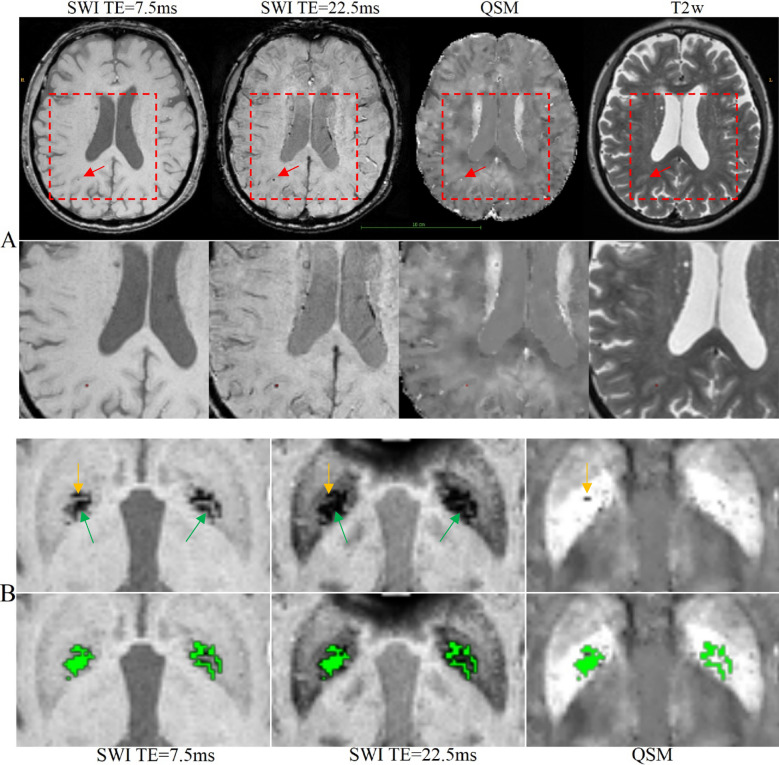
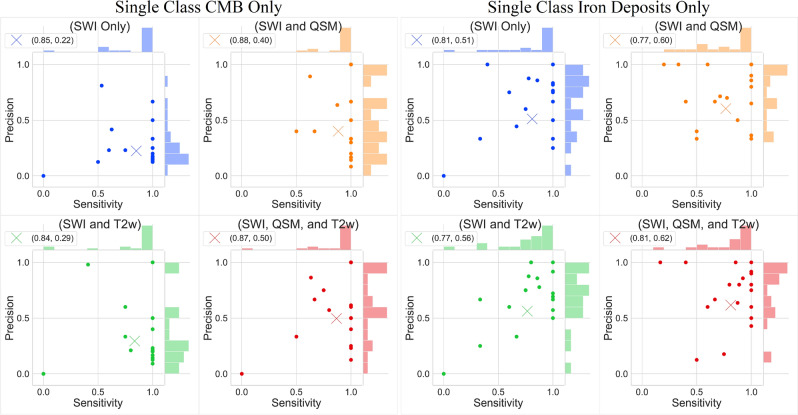
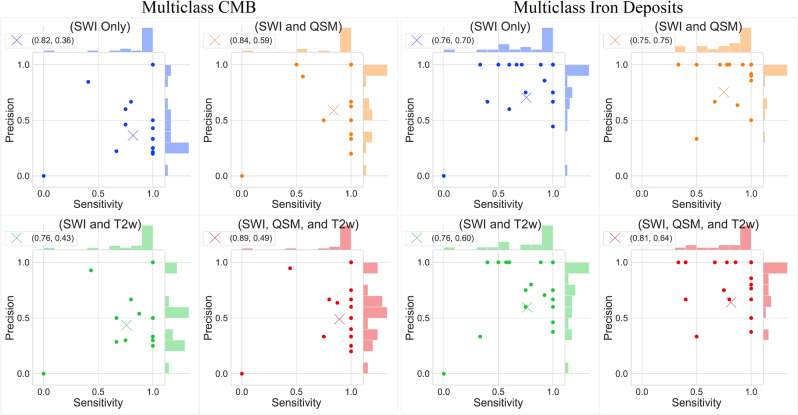
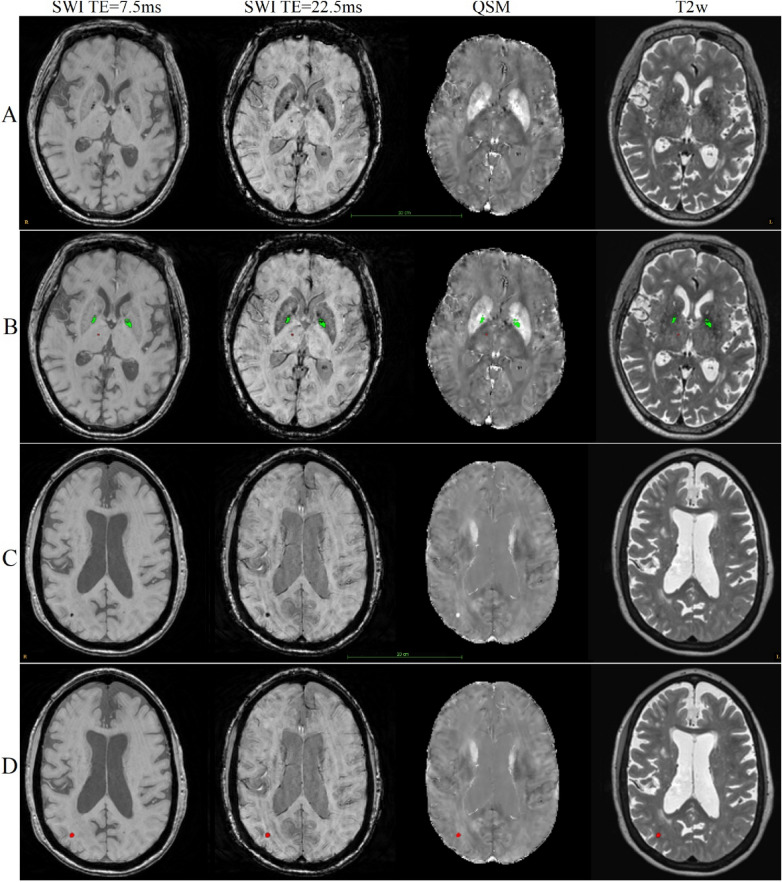
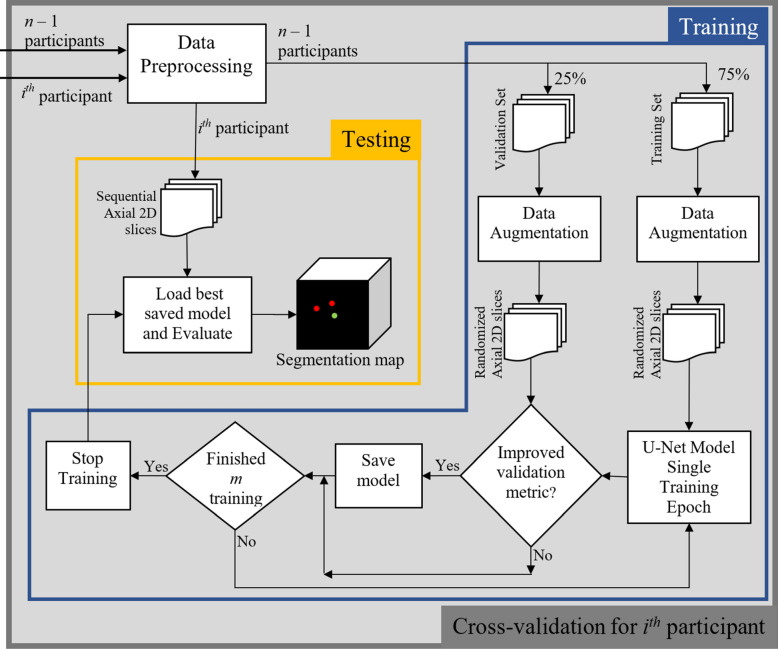
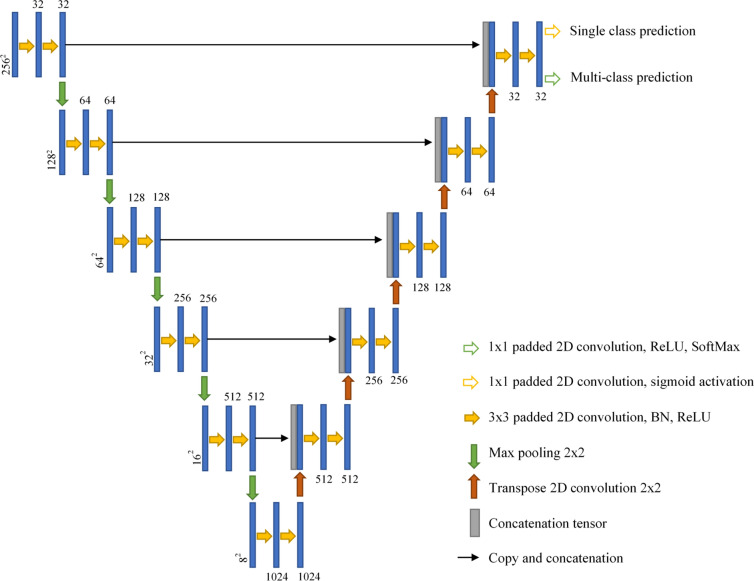
Lobar cerebral microbleeds (CMBs) and localized non-hemorrhage iron deposits in the basal ganglia have been associated with brain aging, vascular disease and neurodegenerative disorders. Particularly, CMBs are small lesions and require multiple neuroimaging modalities for accurate detection. Quantitative susceptibility mapping (QSM) derived from in vivo magnetic resonance imaging (MRI) is necessary to differentiate between iron content and mineralization. We set out to develop a deep learning-based segmentation method suitable for segmenting both CMBs and iron deposits. We included a convenience sample of 24 participants from the MESA cohort and used T2-weighted images, susceptibility weighted imaging (SWI), and QSM to segment the two types of lesions. We developed a protocol for simultaneous manual annotation of CMBs and non-hemorrhage iron deposits in the basal ganglia. This manual annotation was then used to train a deep convolution neural network (CNN). Specifically, we adapted the U-Net model with a higher number of resolution layers to be able to detect small lesions such as CMBs from standard resolution MRI. We tested different combinations of the three modalities to determine the most informative data sources for the detection tasks. In the detection of CMBs using single class and multiclass models, we achieved an average sensitivity and precision of between 0.84-0.88 and 0.40-0.59, respectively. The same framework detected non-hemorrhage iron deposits with an average sensitivity and precision of about 0.75-0.81 and 0.62-0.75, respectively. Our results showed that deep learning could automate the detection of small vessel disease lesions and including multimodal MR data (particularly QSM) can improve the detection of CMB and non-hemorrhage iron deposits with sensitivity and precision that is compatible with use in large-scale research studies.
Conflict of interest statement
The authors declare no competing interests.
Figures
References
Publication types
MeSH terms
Substances
Grants and funding
- 75N95020D00003/DA/NIDA NIH HHS/United States
- HHSN268201500003C/HL/NHLBI NIH HHS/United States
- N01 HC095168/HL/NHLBI NIH HHS/United States
- N01 HC095167/HL/NHLBI NIH HHS/United States
- N01 HC095159/HL/NHLBI NIH HHS/United States
- 75N99020D00002/OF/ORFDO NIH HHS/United States
- 75N99020D00006/OF/ORFDO NIH HHS/United States
- 75N95020D00007/DA/NIDA NIH HHS/United States
- N01 HC095163/HL/NHLBI NIH HHS/United States
- HHSN268201500003I/HL/NHLBI NIH HHS/United States
- 75N99020D00007/OF/ORFDO NIH HHS/United States
- UL1 TR000040/TR/NCATS NIH HHS/United States
- N01 HC095162/HL/NHLBI NIH HHS/United States
- 75N90020D00002/CL/CLC NIH HHS/United States
- N01 HC095161/HL/NHLBI NIH HHS/United States
- UL1 TR001079/TR/NCATS NIH HHS/United States
- 75N96020D00002/ES/NIEHS NIH HHS/United States
- N01 HC095169/HL/NHLBI NIH HHS/United States
- R01 AG059725/AG/NIA NIH HHS/United States
- 75N93020D00002/AI/NIAID NIH HHS/United States
- 75N99020D00003/OF/ORFDO NIH HHS/United States
- 75N95020D00002/DA/NIDA NIH HHS/United States
- 75N90020D00003/CL/CLC NIH HHS/United States
- 75N96020D00003/ES/NIEHS NIH HHS/United States
- UL1 TR001420/TR/NCATS NIH HHS/United States
- 75N95020D00005/DA/NIDA NIH HHS/United States
- 75N92021D00006/HL/NHLBI NIH HHS/United States
- 75N99020D00005/OF/ORFDO NIH HHS/United States
- N01 HC095166/HL/NHLBI NIH HHS/United States
- R03 AG048180/AG/NIA NIH HHS/United States
- 75N98020D00007/OD/NIH HHS/United States
- N01 HC095165/HL/NHLBI NIH HHS/United States
- N01 HC095164/HL/NHLBI NIH HHS/United States
- 75N95020D00004/DA/NIDA NIH HHS/United States
- R01 HL127659/HL/NHLBI NIH HHS/United States
- 75N99020D00004/OF/ORFDO NIH HHS/United States
- N01 HC095160/HL/NHLBI NIH HHS/United States
