. 2021 Aug;40(33):5224-5235.
doi: 10.1038/s41388-021-01906-2. Epub 2021 Jul 8.

A SNAI2-PEAK1-INHBA stromal axis drives progression and lapatinib resistance in HER2-positive breast cancer by supporting subpopulations of tumor cells positive for antiapoptotic and stress signaling markers

Affiliations

A SNAI2-PEAK1-INHBA stromal axis drives progression and lapatinib resistance in HER2-positive breast cancer by supporting subpopulations of tumor cells positive for antiapoptotic and stress signaling markers

Sarkis Hamalian et al. Oncogene. 2021 Aug.

Abstract

Intercellular mechanisms by which the stromal microenvironment contributes to solid tumor progression and targeted therapy resistance remain poorly understood, presenting significant clinical hurdles. PEAK1 (Pseudopodium-Enriched Atypical Kinase One) is an actin cytoskeleton- and focal adhesion-associated pseudokinase that promotes cell state plasticity and cancer metastasis by mediating growth factor-integrin signaling crosstalk. Here, we determined that stromal PEAK1 expression predicts poor outcomes in HER2-positive breast cancers high in SNAI2 expression and enriched for MSC content. Specifically, we identified that the fibroblastic stroma in HER2-positive breast cancer patient tissue stains positive for both nuclear SNAI2 and cytoplasmic PEAK1. Furthermore, mesenchymal stem cells (MSCs) and cancer-associated fibroblasts (CAFs) express high PEAK1 protein levels and potentiate tumorigenesis, lapatinib resistance and metastasis of HER2-positive breast cancer cells in a PEAK1-dependent manner. Analysis of PEAK1-dependent secreted factors from MSCs revealed INHBA/activin-A as a necessary factor in the conditioned media of PEAK1-expressing MSCs that promotes lapatinib resistance. Single-cell CycIF analysis of MSC-breast cancer cell co-cultures identified enrichment of p-Akthigh/p-gH2AXlow, MCL1high/p-gH2AXlow and GRP78high/VIMhigh breast cancer cell subpopulations by the presence of PEAK1-expressing MSCs and lapatinib treatment. Bioinformatic analyses on a PEAK1-centric stroma-tumor cell gene set and follow-up immunostaining of co-cultures predict targeting antiapoptotic and stress pathways as a means to improve targeted therapy responses and patient outcomes in HER2-positive breast cancer and other stroma-rich malignancies. These data provide the first evidence that PEAK1 promotes tumorigenic phenotypes through a previously unrecognized SNAI2-PEAK1-INHBA stromal cell axis.


Conflict of interest statement

The authors declare no competing interests.

Figures

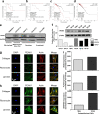
Fig. 1
Fig. 1. A SNAI2-PEAK1 axis correlates with disease relapse and co-stains the non-epithelial fibroblastic stroma in HER2-positive breast cancer.
a Kaplan–Meier relapse-free survival (RFS) curves for patients with low or high PEAK1 transcript levels across all breast cancer subtypes (n = 1784). b Kaplan–Meier RFS curves for HER2-positive breast cancer patients with low or high PEAK1 transcript levels (n = 272). c PEAK1 transcript levels in normal breast stroma and breast cancer stroma across all subtypes (n = 6 and 53, respectively). d PEAK1 transcript levels in breast cancer stroma of relapse-free patients and those with disease recurrence across all subtypes (n = 42 and 11, respectively). e Expression correlation analysis of PEAK1 and ETS1, KLF4, SNAI2, FN1, FOXC2 or MYC in patients having mixed or good outcomes (top, n = 45) and patients having poor outcomes (bottom, n = 8). f Representative IHC images for HER2, PEAK1, SNAI2, MYC and FN1 in breast cancer tissue where PEAK1 expression in the stromal compartment is low (top) or high (bottom). g Stromal IHC score correlation and linear regression analyses of PEAK1 and SNAI2, MYC or FN1 across six breast cancer tissue samples (patient #s 1874, 1939, 2428, 1920, 2392 and 3257). h Average stromal IHC scores for PEAK1, SNAI2, MYC and FN1 in three HER2-negative patients and three HER2-positive patients. ik Violin plots of quantified PEAK1, SNAI2 or PEAK1/SNAI2 stromal expression from IHC/IF data on a 144-breast cancer sample tissue microarray (79 HER2-positive cases). jm Representative 3D deconvolution widefield microscopy images for PEAK1 and SNAI2 in TB130 (HER2-negative) and TB122 (HER2-positive) breast cancer tissues. no Kaplan–Meier relapse-free survival (RFS) curves for patients with low or high SNAI2 in all breast cancer subtypes (n, n = 1784) or HER2-positive breast cancer (o, n = 272). Kaplan–Meier relapse-free survival (RFS) curves for patients with low or high PEAK1 in all SNAI2low or SNAI2high breast cancers (p and r, n = 892) and HER2-positive SNAI2low or SNAI2high breast cancers (q and s, n = 136). *, **, *** and **** indicates p value < 0.05, 0.01, 0.001 and 0.0001, respectively, as determined by a Student’s T test.
Fig. 2
Fig. 2. SNAI2 and PEAK1 coexpression in breast cancers enriched for mesenchymal stem cell content is prognostically unfavorable.
ac. Kaplan–Meier OS curves for low or high PEAK1 transcript levels in breast cancer patients selected for high SNAI2 expression and enriched innate immune (a), adaptive immune (b) or mesenchymal stem cell contents (n = 45, 19 and 382, respectively). d Kaplan–Meier OS curves for low or high PEAK1 transcript levels in breast cancer patients selected for high SNAI2 expression and decreased mesenchymal stem cell content (n = 381). e Western blot for PEAK1 and GAPDH in total lysates from the indicated non-tumorigenic cell lines. f Western blot and relative band intensity for PEAK1 and β-actin in total lysates from the indicated patient-derived breast cancer-associated fibroblasts. Representative confocal microscopy images for nucleus (DAPI), filamentous actin (Phalloidin) and PEAK1 in TB98 (g) and TB129 (h) CAF lines plated onto 5 ug/mL collagen, fibronectin or laminin substrates. i Normalized expression of SNAI2, PLAU and SERPINE1 in the indicated TB CAF lines obtained from the GEO database using the GSE37614 dataset.
Fig. 3
Fig. 3. Chicken embryo chorioallantoic membrane (CAM) xenografting of patient-derived CAFs or MSCs with HER2-positive breast cancer cells increases primary tumor mass.
a Schematic of the chorioallantoic membrane (CAM) xenograft system using chicken (Gallus gallus) embryos together with human tumor cells and end point analysis of whole tissue genomic DNA by qPCR for human alu repeats and host chicken Gapdh levels. The method has been modified from the original assay system [32] to enable a 5-day drug treatment regimen beginning at 2 days post-xenograft. b Representative images of BT474 cells, BT474 cells + TB122 CAFs or BT474 cells + C3H10T1/2 mesenchymal stem cells. Scale bar = 1 cm. c Quantified primary tumor mass of experiments represented in b. d Relative metastasis of BT474 cells in the lung (left) and brain (right) of experiment in b. *Indicates a p value < 0.05 as determined by a One-Way ANOVA w/ multiple comparisons post-test.
Fig. 4
Fig. 4. Knockdown of PEAK1 in MSCs abrogates their ability to promote tumorigenesis, intratumoral αSMA expression, lapatinib resistance and lapatinib-induced brain metastasis.
a Western blot and relative band intensity quantification for PEAK1 and α-tubulin levels in shScramble control (shScr) and 5 different PEAK1-targeting (shP1) shRNA derivatives of C3H10T1/2 mesenchymal stem cells. Unless otherwise noted, shP1(1) construct is used throughout experiments. b Quantified primary tumor mass of CAM xenograft assay using BT474 cells only or BT474 cells xenografted together with the C3HshScr, C3HshP1(1) or C3HshP1(5) cells. c Representative images and quantification of alpha-smooth muscle actin staining of stromal tissue in CAM tumors from b. d Representative assay endpoint images for CAM xenograft experiment using the same cell combinations as in b with either vehicle control or 1 uM lapatinib treatments. e Quantified primary tumor mass of experiment in d including the treatment condition of 300 nM lapatinib. f Hematoxylin and eosin staining of CAM tumor tissue in d. g Relative metastasis of BT474 cells in the lung (left) and brain (right) of experiment in d. *, **, *** and **** indicates a p value < 0.05, 0.01, 0.001 and 0.0001, respectively, as determined by a One-Way or Two-Way ANOVA w/ multiple comparisons post-test.
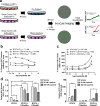
Fig. 5
Fig. 5. MSC expression of PEAK1 protects neighboring breast cancer cells from lapatinib-induced cytotoxicity.
a Schematic of breast cancer cell mono- or breast cancer cell-CAF/MSC co-culture using non-labeled stromal fibroblasts and H2B-eGFP+ BT474 breast cancer cells for downstream analysis of breast cancer cell number and death using the IncuCyte imaging system over 96 h (48 h pre-incubation and 48 h incubation with therapy and EtBr). bc Endpoint dose-response curves for lapatinib effects on breast cancer cell number (b) or cell death (c) in the indicated breast cancer cell and stromal fibroblast culture combinations. d Quantification of tumor cell number (left) and EtBr uptake (right) at assay endpoint for BT474 cells alone or co-cultured with the shScr or shP1(5) derivatives of C3H10T1/2 cells and treated with vehicle control or the indicated dose of lapatinib. * of **** indicates a p valule of 0.05 or 0.0001, respectively as determined by a Two-Way ANOVA with multiple comparisons post-test.
Fig. 6
Fig. 6. PEAK1 expression in MSCs drives the production of secreted factors that promote breast cancer cell proliferation/survival and lapatinib resistance in vitro.
a Schematic for generating TB CAF or C3H MSC conditioned media (CM) for analysis on breast cancer cell growth/survival over 48 h in vitro. b Cell viability analysis of BT474 cells treated with mock or TB122 CM. c Cell viability analysis of BT474 cells treated with mock CM or CM from the indicated shRNA derivatives of C3H10T1/2 cells. d Cell viability analysis of BT474 cells treated with mock CM or CM from the indicated shRNA derivatives of C3H10T1/2 cells and treated with vehicle control or the indicated dose of lapatinib. *, ***, or **** indicates a p value < 0.05, 0.001 or 0.0001, respectively, as determined by a One-Way or Two-Way ANOVA w/multiple comparisons post-test.
Fig. 7
Fig. 7. PEAK1-dependent INHBA/activin-A expression/secretion from MSCs mediates MSC-induced lapatinib resistance in HER2-positive breast cancer cells.
a Representative slide scan images from the semi-quantitative mouse antibody array 308 (L-308) following incubation and reactivity with total cell lysates prepared from the shScramble and indicated PEAK1-specific shRNA derivatives of the C3H10T1/2 MSCs. b Quantification of ranked protein expression across the 308 array antigens with confidence intervals set to identify antigen expression changes up (red line) and down (green) with a p value < 0.05. c Relative mRNA expression for the indicated PEAK1-dependent cytokines in normal versus malignant stroma as reported in the indicated studies. d Expression relationship for TGFB3, VEGFA, CSF1, CCL4, INHBA and GDF5 versus PEAK1 mRNA levels in breast cancer patients. e ELISA analysis for activin-A in mock conditioned media or media conditioned with the indicated shRNA derivatives of the C3H10T1/2 cells. fg Aqueous One cell viability assay on BT474 cells treated with either mock or C3H10T1/2 cell conditioned media and increasing doses of lapatinib in the presence of control or 1 μg/mL Follistatin (f) or ACTRII-ECD (g).
Fig. 8
Fig. 8. PEAK1-expressing MSCs promote lapitinib resistance by modulating antiapopototic/DNA damage signaling within a subpopulation of highly plastic HER2-positive breast cancer cells.
a Schematic of the CycIF workflow used for single-cell analysis. bc t-SNE plots of all cells across biological replicates of cell culture and lapatinib treatment conditions (b) and overlayed with the GFP-positive BT474 HER2-positive breast cancer cells (c, inlay shows GFP gating scheme). d Averaged BT474 GFP-positive breast cancer cell (BCC) number at 48 h post-therapy treatment. e Quantification of ar–––ea under the curve (AUC) for data plotted in d. f Overlay of notable breast cancer cell and MSC subpopulations onto the t-SNE plot from c. g Pseudocoloring of the single-cell antigen intensities of GRP78, MCL1, VIM, p-γH2AX, p65NFκB and p-Akt in the GFP-positive breast cancer cells and αSMA in the GFP-negative MSCs overlayed onto the t-SNE plots for these cell populations. hm Average integrated signal intensity for indicated tumor cell markers within indicated gated populations of complementary markers across the four cell culture conditions. np Histograms representing lapatinib-induced changes of the single-cell antigen expression patterns for p-Akthigh/p-gH2AXlow, MCL1high/p-gH2AXlow and GRP78high/VIMhigh BT474 cell subpopulations identified in km. q Representative microscopy images of nuclear (DAPI), MCL1 and p-gH2AX immunofluorescence across cell culture and lapatinib treatment conditions. IPA-derived canonical pathway (r) or disease/function annotation enrichments (s) for SNAI2, PEAK1, INHBA, CCL4, GDF5, MCL1, AKT1, H2AFX, GRP78 and VIM. t Proposed model of mechanism by which stromal expression of PEAK1 drives tumor growth, metastasis and targeted therapy resistance in neighboring HER2-positive breast cancer cells.

Similar articles

Cited by

References

    1. Yuan S, Norgard RJ, Stanger BZ. Cellular plasticity in cancer. Cancer Discov. 2019;9:837–851. doi: 10.1158/2159-8290.CD-19-0015. - DOI - PMC - PubMed
    1. Gupta PB, Pastushenko I, Skibinski A, Blanpain C, Kuperwasser C. Phenotypic plasticity: driver of cancer initiation, progression, and therapy resistance. Cell Stem Cell. 2019;24:65–78. doi: 10.1016/j.stem.2018.11.011. - DOI - PMC - PubMed
    1. Runa F, Hamalian S, Meade K, Shisgal P, Gray PC, Kelber JA. Tumor microenvironment heterogeneity: challenges and opportunities. Curr Mol Biol Rep. 2017;3:218–229. doi: 10.1007/s40610-017-0073-7. - DOI - PMC - PubMed
    1. Marusyk A, Janiszewska M, Polyak K. Intratumor heterogeneity: the rosetta stone of therapy resistance. Cancer Cell. 2020;37:471–484. doi: 10.1016/j.ccell.2020.03.007. - DOI - PMC - PubMed
    1. Marusyk A, Tabassum DP, Janiszewska M, Place AE, Trinh A, Rozhok AI, et al. Spatial proximity to fibroblasts impacts molecular features and therapeutic sensitivity of breast cancer cells influencing clinical outcomes. Cancer Res. 2016;76:6495–6506. doi: 10.1158/0008-5472.CAN-16-1457. - DOI - PMC - PubMed

Publication types

MeSH terms