. 2021 Oct;31(10):1072-1087.
doi: 10.1038/s41422-021-00528-3. Epub 2021 Jul 8.

Pericytes augment glioblastoma cell resistance to temozolomide through CCL5-CCR5 paracrine signaling

Affiliations

Pericytes augment glioblastoma cell resistance to temozolomide through CCL5-CCR5 paracrine signaling

Xiao-Ning Zhang et al. Cell Res. 2021 Oct.

Abstract

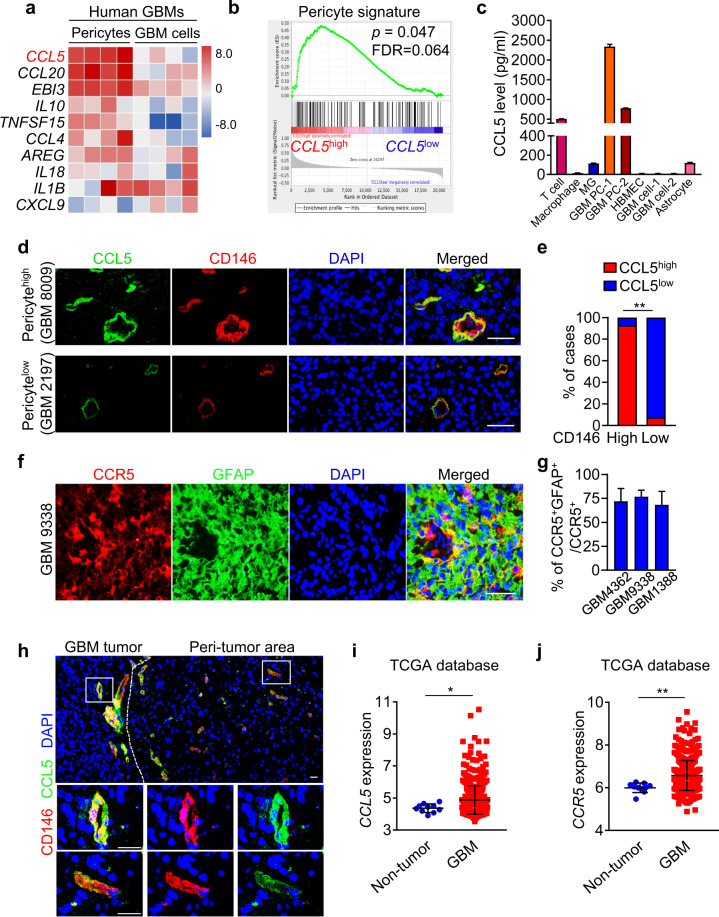
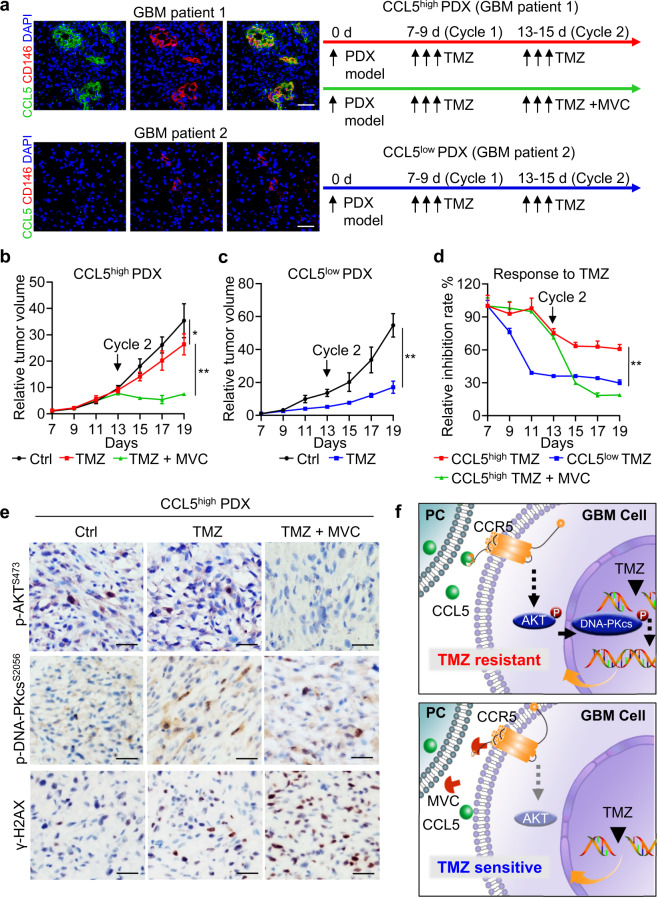
Glioblastoma (GBM) is a prevalent and highly lethal form of glioma, with rapid tumor progression and frequent recurrence. Excessive outgrowth of pericytes in GBM governs the ecology of the perivascular niche, but their function in mediating chemoresistance has not been fully explored. Herein, we uncovered that pericytes potentiate DNA damage repair (DDR) in GBM cells residing in the perivascular niche, which induces temozolomide (TMZ) chemoresistance. We found that increased pericyte proportion correlates with accelerated tumor recurrence and worse prognosis. Genetic depletion of pericytes in GBM xenografts enhances TMZ-induced cytotoxicity and prolongs survival of tumor-bearing mice. Mechanistically, C-C motif chemokine ligand 5 (CCL5) secreted by pericytes activates C-C motif chemokine receptor 5 (CCR5) on GBM cells to enable DNA-dependent protein kinase catalytic subunit (DNA-PKcs)-mediated DDR upon TMZ treatment. Disrupting CCL5-CCR5 paracrine signaling through the brain-penetrable CCR5 antagonist maraviroc (MVC) potently inhibits pericyte-promoted DDR and effectively improves the chemotherapeutic efficacy of TMZ. GBM patient-derived xenografts with high CCL5 expression benefit from combined treatment with TMZ and MVC. Our study reveals the role of pericytes as an extrinsic stimulator potentiating DDR signaling in GBM cells and suggests that targeting CCL5-CCR5 signaling could be an effective therapeutic strategy to improve chemotherapeutic efficacy against GBM.


Conflict of interest statement

The authors declare no competing interests.

Figures

Fig. 1
Fig. 1. Enriched pericyte signature informs poor therapeutic efficacy of TMZ in glioma patients.
a Heatmap of pericyte markers (CD248, ACTA2, DES, PDGFRB, ENPEP and MCAM) in TMZ-resistant (n = 38) and TMZ-sensitive GBMs (n = 37) from the TCGA database. b Kaplan–Meier survival analysis of the OS of TMZ-treated GBM patients stratified by pericyte score. Pericyte score was calculated according to the expression of pericyte (PC) markers in GBMs from the TCGA database (PChigh, n = 96; PClow, n = 215). c Correlation analysis of pericyte score and tumor progression score in TMZ-treated GBMs from the TCGA database (n = 311). Tumor progression score was constructed by single sample gene set enrichment analysis (ssGSEA) model based on 14 signature genes derived from multi-focal GBM RNA-Seq. d Immunofluorescence staining of pericyte (PC) marker CD146 (red) and endothelial cell marker CD31 (green) in WHO III and IV gliomas treated with TMZ from Southwest Hospital. Scale bars, 50 μm. e Kaplan–Meier analysis of progression-free survival (PFS) of TMZ-treated WHO III and IV glioma patients stratified by pericyte level from Southwest Hospital. The corrected level of pericyte (PC) was defined as CD146-positive area/vessel number (PChigh, n = 25; PClow, n = 24). f Immunofluorescence staining of pericyte marker CD146 (green) and endothelial cell marker CD31 (red), and TUNEL staining of apoptotic cells (white) in the recurrent GBMs treated with TMZ. DAPI, 4,6-diamidino-2-phenylindole; TUNEL, TdT-mediated dUTP nick-end labeling. Scale bars, 100 μm. g Quantification of TUNEL-positive cells at a distance of 100 μm, 200 μm or 300 μm from pericytes in the recurrent GBMs treated with TMZ. *P < 0.05; **P < 0.01.
Fig. 2
Fig. 2. Depletion of pericytes in pericytehigh GBMs improves the therapeutic efficacy of TMZ.
a Schematic diagram of Desmin promoter-driven expression of HsvTK vector and control vector. Gene therapy was achieved through administration of GCV, which is converted to a toxic metabolite to eliminate cells expressing HsvTK. b Schematic diagram of the combined treatment of TMZ and GCV in mice bearing GBM-2 (pericytehigh) xenografts expressing DesPro-TK or control DesPro. GCV (50 mg/kg, i.p.) was given for 4 days with 1-day interval since Day 15 and TMZ (5 mg/kg, i.p.) was given for 3 consecutive days since Day 16 after tumor implantation. Xenograft growth was monitored by bioluminescence imaging on Day 15 and Day 23 after tumor implantation. IVIS, In Vivo Imaging System. c, d In vivo bioluminescence images (c) and quantification (d) of tumor growth of human GBM-2 xenografts treated with GCV together with or without TMZ on Day 15 and Day 23 after tumor implantation. ns, not significant. *P < 0.05. n = 5 for each group. e Kaplan–Meier survival analysis of mice bearing GBM-2 xenografts with the indicated treatment. n = 5 for each group. f, g Immunofluorescence staining (f) and quantification (g) of pericyte marker α-SMA (green) in GBM-2 xenografts treated with GCV together with or without TMZ. ns, not significant. *P < 0.05. Scale bars, 25 μm. h, i Immunofluorescence staining (h) and quantification (i) of γ-H2AX (red)-positive cells in GBM-2 xenografts treated with GCV together with or without TMZ. **P < 0.01. Scale bars, 25 μm. j TMZ concentration in GBM-2 xenografts and blood in mice expressing DesPro-TK or control DesPro with GCV treatment. n = 4 for each group.
Fig. 3
Fig. 3. CD146+ pericytes isolated from human GBMs protect GBM cells from TMZ-induced apoptosis.
a Schematic diagram of pericyte isolation from human GBMs. CD146 was used as a pericyte marker for FACS and the isolated CD146+ pericytes were excluded from potential contamination of endothelial cells (marked by CD31) or leukocytes (marked by CD45). b Immunofluorescence staining of the pericyte (PC) markers α-SMA and CD146, GBM cell marker GFAP, endothelial cell (EC) marker CD31 and leukocyte marker CD45 in CD146+ cells sorted from human GBMs. Scale bars, 25 μm. c, d Representative images (c) and morphometric analysis (d) of cell spreading of pericytes (red, left panel of c) or GBM cells (red, right panel of c) co-cultured with HBMECs (green). **P < 0.01. Scale bars, 50 μm. e Schematic diagram of transwell co-culture of pericytes and GBM cells with TMZ treatment. Human pericytes or GBM cells were added into the upper or lower chamber of transwells, respectively. TMZ or DMSO was added into the upper chamber 24 h after co-culture. Apoptosis and cell survival analyses were performed 48 h after the treatment. f, g Apoptosis (f) and cell survival (g) of GBM-1 cells with or without pericyte co-culture and TMZ treatment. ns, not significant. *P < 0.05; **P < 0.01. h Schematic diagram of GBM cells cultured in pericyte CM or control GBM cell CM followed by TMZ or DMSO treatment. i, j Apoptosis (i) or cell survival (j) of GBM-1 cells with or without pericyte CM stimulation and TMZ treatment. ns, not significant. *P < 0.05; **P < 0.01. Experiments in cj were independently performed three times.
Fig. 4
Fig. 4. CCL5-CCR5 paracrine axis represents a molecular link between pericytes and GBM cells.
a Top 10 upregulated cytokines in human pericytes relative to GBM cells identified by RNA-Seq and qRT-PCR analyses. b GSEA of pericyte score in human GBMs from the TCGA database (n = 152). c ELISA of CCL5 level in T cell, macrophage, microglia (MG), GBM pericytes (GBM PC-1, -2), HBMECs, GBM cells (GBM cell-1, -2) and astrocyte. Expression of CCL5 in CD3+ T cells was used as a positive control. d, e Immunofluorescence staining (d) and correlation (e) of CCL5 (green) and CD146 (red) expressions in human GBMs (n = 28). Scale bars, 50 μm. **P < 0.01. f, g Immunofluorescence staining of CCR5 (red) and GFAP (green) (f) and proportion of CCR5+/GFAP+ GBM cells in CCR5+ cells (g) in human GBMs. Scale bars, 50 μm. h Immunofluorescence staining of CD146 (red) and CCL5 (green) in GBM tumor and peri-tumor area of GBM. Scale bars, 25 μm. i, j Expression of CCL5 (i) and CCR5 (j) in human GBMs (n = 528) and non-tumor tissues (n = 10) from the TCGA database. *P < 0.05; **P < 0.01. Experiments were performed three times independently (a, c).
Fig. 5
Fig. 5. CCL5-CCR5 paracrine signaling activates DDR signaling in GBM cells to potentiate TMZ resistance.
a Apoptosis analysis of GBM-1 cells with indicated treatments. GBM cells were stimulated with CCL5 (10 ng/mL) or vehicle (PBS) followed by the administration of TMZ (500 μmol/L) or DMSO. ns, not significant. **P < 0.01. b Cell survival analysis of GBM-1 cells with indicated treatments. CM from pericytes expressing shNT or shCCL5 (sh-1 or sh-2) was collected and added to GBM cells. GBM cells were treated with TMZ (500 μmol/L) after CM addition. **P < 0.01. c Cell survival analysis of GBM-1 cells with indicated treatments. Pericyte CM was pretreated with neutralizing anti-CCL5 antibody or IgG before being added to GBM cells. GBM cells were treated with TMZ (500 μmol/L) after pericyte CM addition. **P < 0.01. d Apoptosis analysis of GBM-1 cells with indicated treatments. GBM cells expressing shNT or shCCR5 (sh-1 or sh-2) were pretreated with pericyte CM or control GBM cell CM followed by TMZ (500 μmol/L) treatment. *P < 0.05; **P < 0.01. e Schematic diagram of MVC-mediated inhibition of CCL5-CCR5 signaling. The binding of MVC to CCR5 leads to a conformational change of its extracellular domain to prevent ligand-stimulated CCR5 activation. f Apoptosis analysis of GBM-1 cells with indicated treatments. GBM-1 cells were pretreated with MVC (500 nmol/L) or DMSO for 1 h, followed by pericyte CM stimulation. Apoptosis and cell survival analyses were performed 48 h after TMZ treatment. ns, not significant. **P < 0.01. g DNA damage after the indicated treatments was assessed by comet assay. Scale bars, 50 μm. h Quantification of percentage of cells with comet tails with indicated treatments. ns, not significant. *P < 0.05; **P < 0.01. i, j Immunoblot analysis of phosphorylated AKT (Ser473) and AKT (i) or phosphorylated DNA-PKcs (Ser2056) and DNA-PKcs (j) in GBM-1 cells with indicated treatments. k Immunoblot analysis of phosphorylated AKT (Ser473), AKT, phosphorylated DNA-PKcs (Ser2056), DNA-PKcs, γ-H2AX in GBM-1 cells with indicated treatments. DNA-PKi (DNA-PKcs inhibitor) represents KU-57788; AKTi (AKT inhibitor) represents MK-2206. Experiments in ak were independently performed three times.
Fig. 6
Fig. 6. MVC, as a CCR5 antagonist, combines with TMZ to effectively impair GBM growth.
a Schematic diagram of the combined treatment of MVC and TMZ in tumor-bearing mice. MVC (100 mg/kg, i.p.) was given for 4 consecutive days since Day 14 and TMZ (5 mg/kg, i.p.) was given for 3 consecutive days since Day 15 after tumor implantation. The growth of GBM-2 xenografts was monitored by bioluminescence imaging on Day 14, Day 17 and Day 21 after tumor implantation. b, c In vivo bioluminescence images (b) and quantification (c) of tumor growth of GBM-2 xenografts treated with TMZ, MVC or vehicle on Day 14, Day 17 and Day 21 after tumor implantation. ns, not significant. *P < 0.05; **P < 0.01. n = 5 for each group. d Kaplan–Meier survival analysis of mice bearing GBM-2 xenografts treated with TMZ, MVC or vehicle. n = 5 for each group. e, f Immunofluorescence staining (e) and quantification (f) of γ-H2AX-positive cells (green) in GBM-2 xenografts treated with TMZ, MVC or vehicle. ns, not significant. *P < 0.05; **P < 0.01. Scale bars, 25 μm. g, h Immunofluorescence staining (g) and quantification (h) of phosphorylated DNA-PKcs (Ser2056, red) in GBM-2 xenografts treated with TMZ, MVC or vehicle. ns, not significant. *P < 0.05. Scale bars, 25 μm.
Fig. 7
Fig. 7. Increased CCL5 informs poor therapeutic efficacy of TMZ and worse outcome of GBM patients.
a Therapeutic response of TMZ in two representative GBM patients with high or low CCL5 expression. Representative MRI, immunofluorescence staining of CD146 (red) and CCL5 (green) and PFS were shown. Tumor border was marked by red dotted lines in enhanced T1 image (T1c) of MRI. Patients with low CCL5/pericyte proportion benefit more from TMZ treatment relative to those with high CCL5/pericyte proportion. Scale bars, 50 μm. b, c Correlation analysis of CCL5 level (b) or CD146 level (c) and PFS of glioma patients (n = 28). High level of CCL5 or CD146 indicates rapid glioma recurrence. d Therapeutic response to TMZ in glioma patients with high or low CCL5 expression (n = 28). Therapeutic responses were evaluated by the Response Assessment in Neuro-Oncology (RANO) standard. CR, complete response; PR, partial response; PD, progressive disease; SD, stable disease. e Expression patterns of CCL5, CCR5 and pericyte markers ACTA2, MCAM, PDGFRB and DES in human gliomas with different molecular signatures using the TCGA pan-glioma (GBM-LGG) dataset (n = 669). Codel, co-deletion of chromosomes 1p and 19q; G-CIMP, glioma-CpG island methylator phenotype (CpG, C-phosphate-G); PA-like, pilocytic astrocytoma-like; LGm6-glioblastoma, a subgroup of glioma enriched for histologic low-grade gliomas but also contains a subset of tumors with GBM-defining histologic criteria; MGMT, O6-methylguanine-DNA methyltransferase; IDH, isocitrate dehydrogenase; WT, wild type; NA, not available.
Fig. 8
Fig. 8. GBM PDXs with high CCL5 expression benefit from combined treatment of TMZ and MVC.
a Development of adjuvant MVC treatment together with TMZ chemo-treatment according to CCL5 expression in GBM PDXs. PDXs were cultured and passaged in NCG mice in vivo. Representative immunofluorescence staining of CCL5 (green) and CD146 (red) in two human GBMs (CCL5high or CCL5low) with PDX model constructed. CCL5high PDXs were treated with two cycles of TMZ (5 mg/kg, i.p., 3 consecutive days per cycle starting from Day 7 and Day 13) and one cycle of MVC (100 mg/kg, i.p., 3 consecutive days starting from Day 13), while CCL5low PDXs were treated with two cycles of TMZ (5 mg/kg, i.p., 3 consecutive days per cycle starting from Day 7 and Day 13) alone. Scale bars, 50 μm. b, c Relative tumor volume of CCL5high PDXs (b) and CCL5low PDXs (c) with indicated treatments. n = 5 for each group. *P < 0.05; **P < 0.01. d Relative inhibition rate of CCL5high PDXs treated with TMZ (red), TMZ + MVC (green) and CCL5low PDXs treated with TMZ (blue). **P < 0.01. e Representative images of immunohistochemistry staining of phosphorylated AKT (Ser473), phosphorylated DNA-PKcs (Ser2056) and γ-H2AX (Ser139) in CCL5high PDXs treated with TMZ together with or without MVC as an adjuvant agent. Scale bars, 50 μm. f Schematic diagram of the mechanism underlying pericyte-mediated DDR and TMZ resistance.

References

    1. Lapointe S, Perry A, Butowski NA. Primary brain tumours in adults. Lancet. 2018;392:432–46. doi: 10.1016/S0140-6736(18)30990-5. - DOI - PubMed
    1. Hanahan D, Weinberg RA. Hallmarks of cancer: the next generation. Cell. 2011;144:646–74. doi: 10.1016/j.cell.2011.02.013. - DOI - PubMed
    1. Nikolakopoulou AM, et al. Pericyte loss leads to circulatory failure and pleiotrophin depletion causing neuron loss. Nat Neurosci. 2019;22:1089–98. doi: 10.1038/s41593-019-0434-z. - DOI - PMC - PubMed
    1. Östman A, Corvigno S. Microvascular mural cells in cancer. Trends Cancer. 2018;4:838–48. doi: 10.1016/j.trecan.2018.10.004. - DOI - PubMed
    1. Song S, Ewald AJ, Stallcup W, Werb Z, Bergers G. PDGFRβ+ perivascular progenitor cells in tumours regulate pericyte differentiation and vascular survival. Nat Cell Biol. 2005;7:870–9. doi: 10.1038/ncb1288. - DOI - PMC - PubMed

Publication types